Requirement 3
January 31, 2015
Interest Expense ($500,000 x 9% x 1/12) 3,750.00
Notes Payable (difference) 1,321.33
Requirement 4
Requirement 1
Assets = Liabilities +
Stockholders’
Equity
Total
Liabilities ÷
Stockholders’
Equity =
Debt to Equity
Ratio
In the first monthly payment, $3,750.00 goes to interest expense and only $1,321.33
Over the 15 year mortgage, $412,839 is interest expense and $500,000 goes to reducing
Problem 9-6B (LO 9-6, 9-7)
Stockholders’ equity must be $49 million ($201 million – $152 million).
Requirement 2
Operating lease:
Total
Liabilities ÷
Stockholders’
Equity =
Debt to Equity
Ratio
Capital lease:
Total
Liabilities ÷
Stockholders’
Equity =
Debt to Equity
Ratio
($ in millions)
Total
Liabilities ÷
Stockholders’
Equity =
Debt to Equity
Ratio
Requirement 3
An operating lease is like a rental. Over the lease term, the company making the lease
payments records rent expense and the company receiving the rent payments records
rent revenue. A capital lease is different. In a capital lease, the company making lease
Requirement 4
Yes. The debt to equity ratio will not be affected under an operating lease. However,
under a capital lease, assets and liabilities will both increase $26 million while
Requirement 5
The debt to equity ratio will not be in violation under an operating lease, but will be in
Problem 9-7B (LO 9-7)
Requirement 1
Royal Caribbean has a higher debt to equity ratio than Carnival. Royal Caribbean and
Carnival have a lower debt to equity ratio in comparison to the soft drink industry
represented by Coca-Cola and Pepsi.
($ in millions)
Net
Income ÷
Average
Total Assets =
Return on
Assets Ratio
Royal Caribbean $18 ÷$19,816* = 0.1%
Carnival $1,298 ÷ $38,899** = 3.3%
($ in millions)
Net Income +
Interest + Taxes ÷ Interest =
Times Interest
Earned Ratio
Requirement 2
Carnival has better profitability ratios than Royal Caribbean. However, Coca-Cola and
Pepsi are both more profitable than Carnival.
Requirement 3
Carnival, with a times interest earned ratio of 4.9, is better able to meet interest
payments as they become due than Royal Caribbean with a ratio of only 1.1.
ADDITIONAL PERSPECTIVES
Continuing Problem: Great Adventures
AP9-1
Requirement 1
(1)
Date
(2)
Cash
Paid
(3)
Interest
Expense
(4)
Decrease in
Carrying
Value
(5)
Carrying
Value
Monthly
Payment
Carrying Value
x 6% x 1/12 (2) – (3)
Prior Carrying
Value – (4)
1/ 1 /17 $ 500,000
Requirement 2
January 1, 2017
Cash 500,000
January 31, 2017
Interest Expense ($500,000 x 6% x 1/12) 2,500
Notes Payable (difference) 3,051
February 28, 2017
Interest Expense ($496,949 x 6% x 1/12) 2,485
Notes Payable (difference) 3,066
($ in thousands)
Total
Liabilities ÷
Stockholders’
Equity =
Debt to Equity
Ratio
The ratio weakened in the more recent year.
Financial Analysis: American Eagle
AP9-2
Requirement 1
Requirement 2
($ in thousands)
Net
Income
÷
Average
Stockholders’
Equity
= Return on
Equity
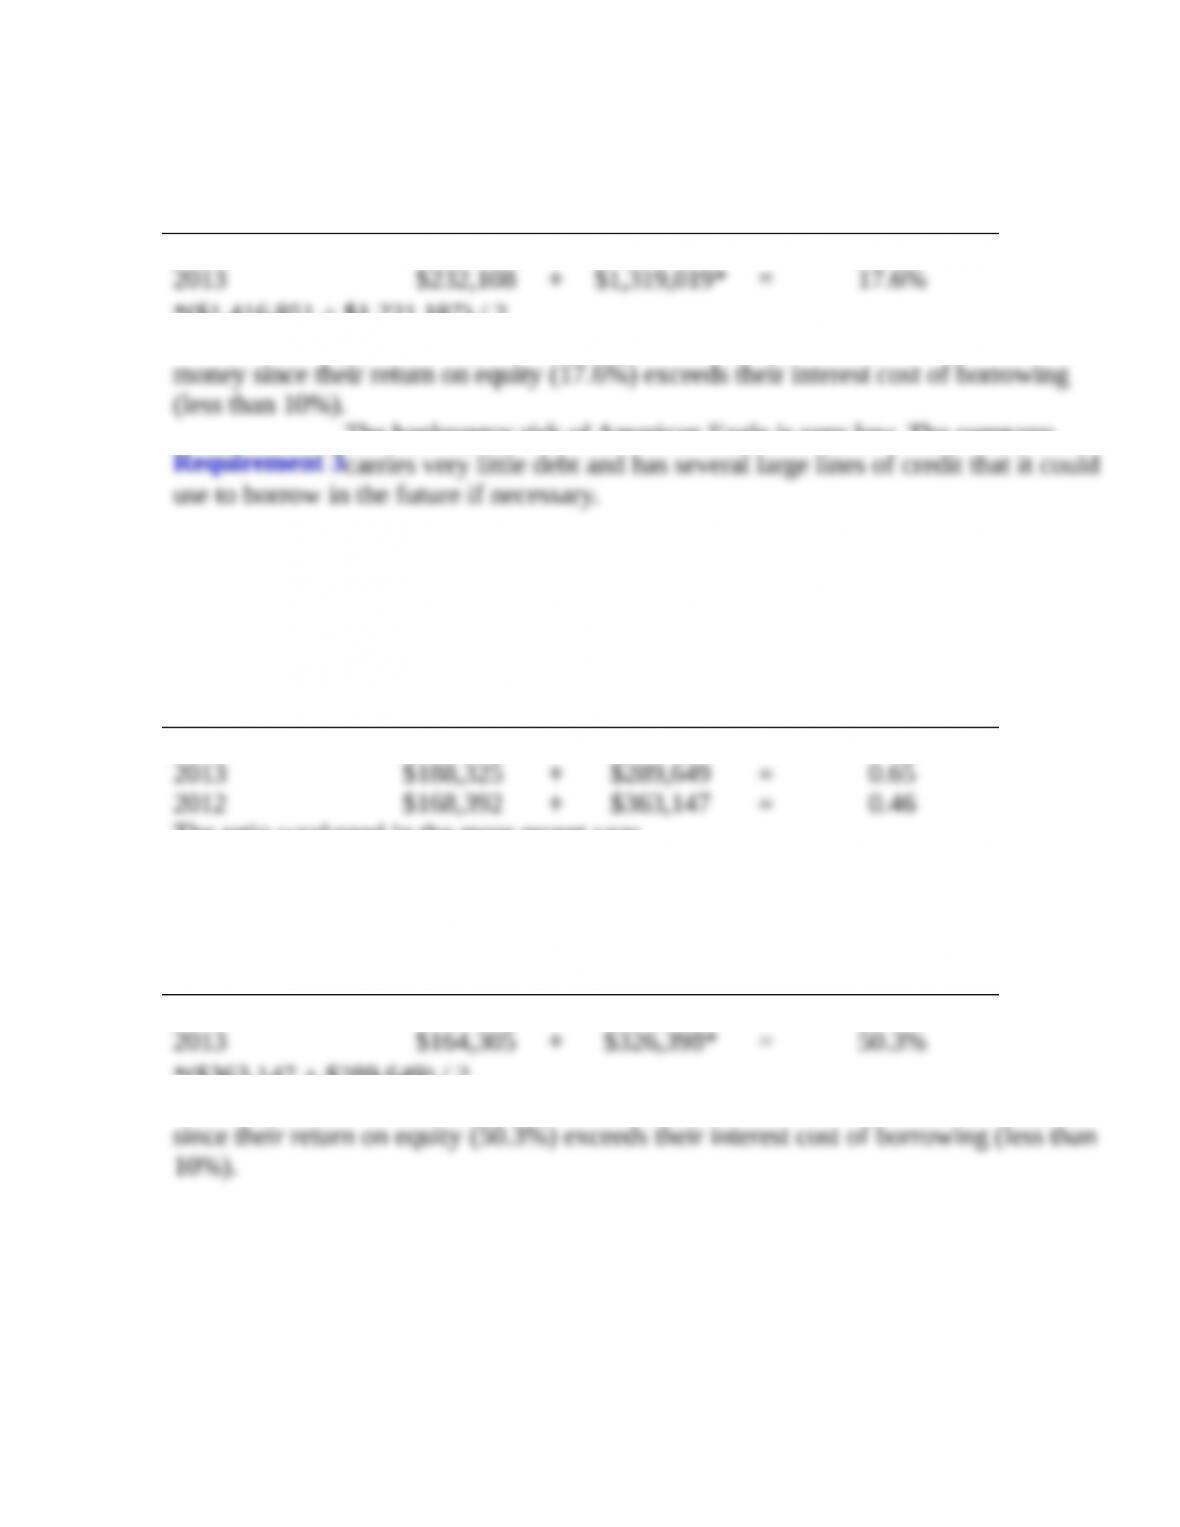
Investors would obtain a higher return on equity if American Eagle borrowed more
The bankruptcy risk of American Eagle is very low. The company
($ in thousands)
Total
Liabilities ÷
Stockholders’
Equity =
Debt to Equity
Ratio
The ratio weakened in the more recent year.
Requirement 2
($ in thousands)
Net
Income
÷
Average
Stockholders’
Equity
= Return on
Equity
Investors would obtain a higher return on equity if Buckle borrowed more money
*($1,416,851 + $1,221,187) / 2
Financial Analysis: Buckle
AP9-3
Requirement 1
*($363,147 + $289,649) / 2
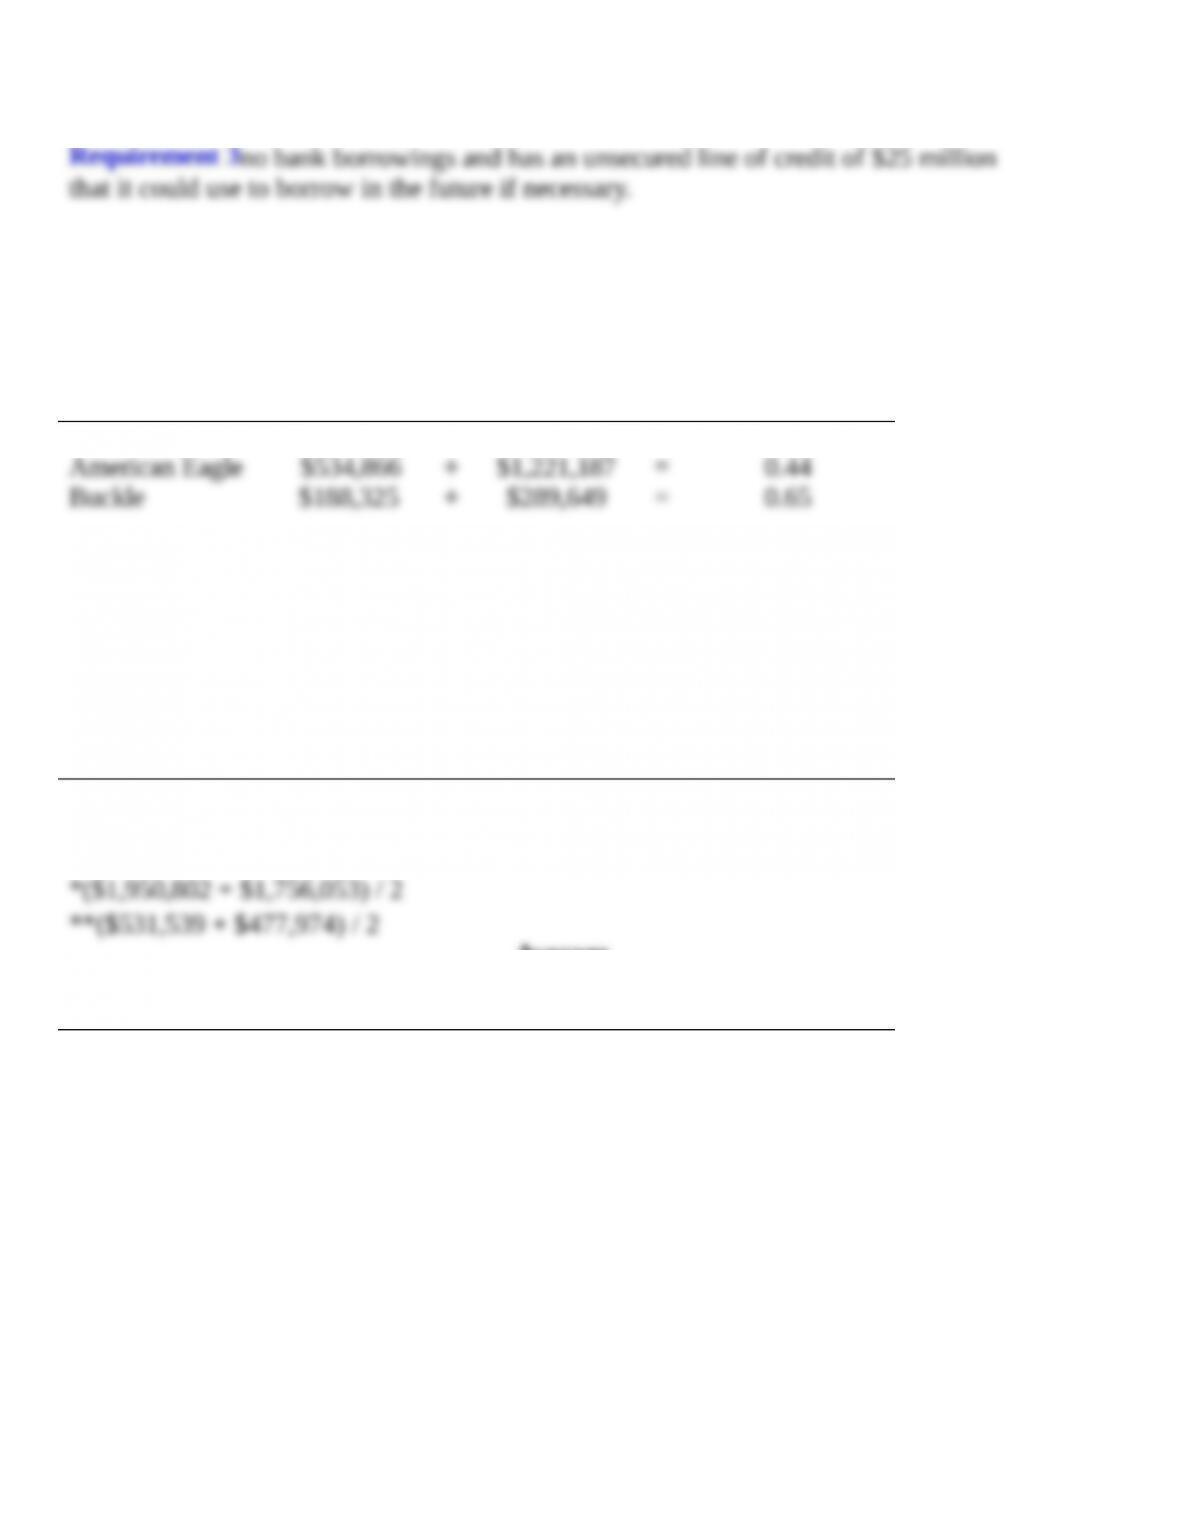
The bankruptcy risk of The Buckle is very low. The company carries
($ in thousands)
Total
Liabilities ÷
Stockholders’
Equity =
Debt to Equity
Ratio
American Eagle has a better (lower) debt to equity ratio. The ratios are both lower
than those for Coca-Cola and Pepsi reported in the chapter. The soft-drink industry
maintains a higher debt to equity ratio than the retail clothing industry.
Requirement 2
($ in thousands)
Net
Income
÷
Average
Total
Assets
= Return on
Assets Ratio
American Eagle $232,108 ÷$1,853,428* = 12.5%
Buckle $164,305 ÷$504,757** = 32.6%
($ in thousands)
Net
Income
÷
Average
Stockholders’
Equity
= Return on
Equity Ratio
American Eagle $232,108 ÷$1,319,019* = 17.6%
Buckle $164,305 ÷$326,398** = 50.3%
Comparative Analysis: American Eagle vs. Buckle
AP9-4
Requirement 1
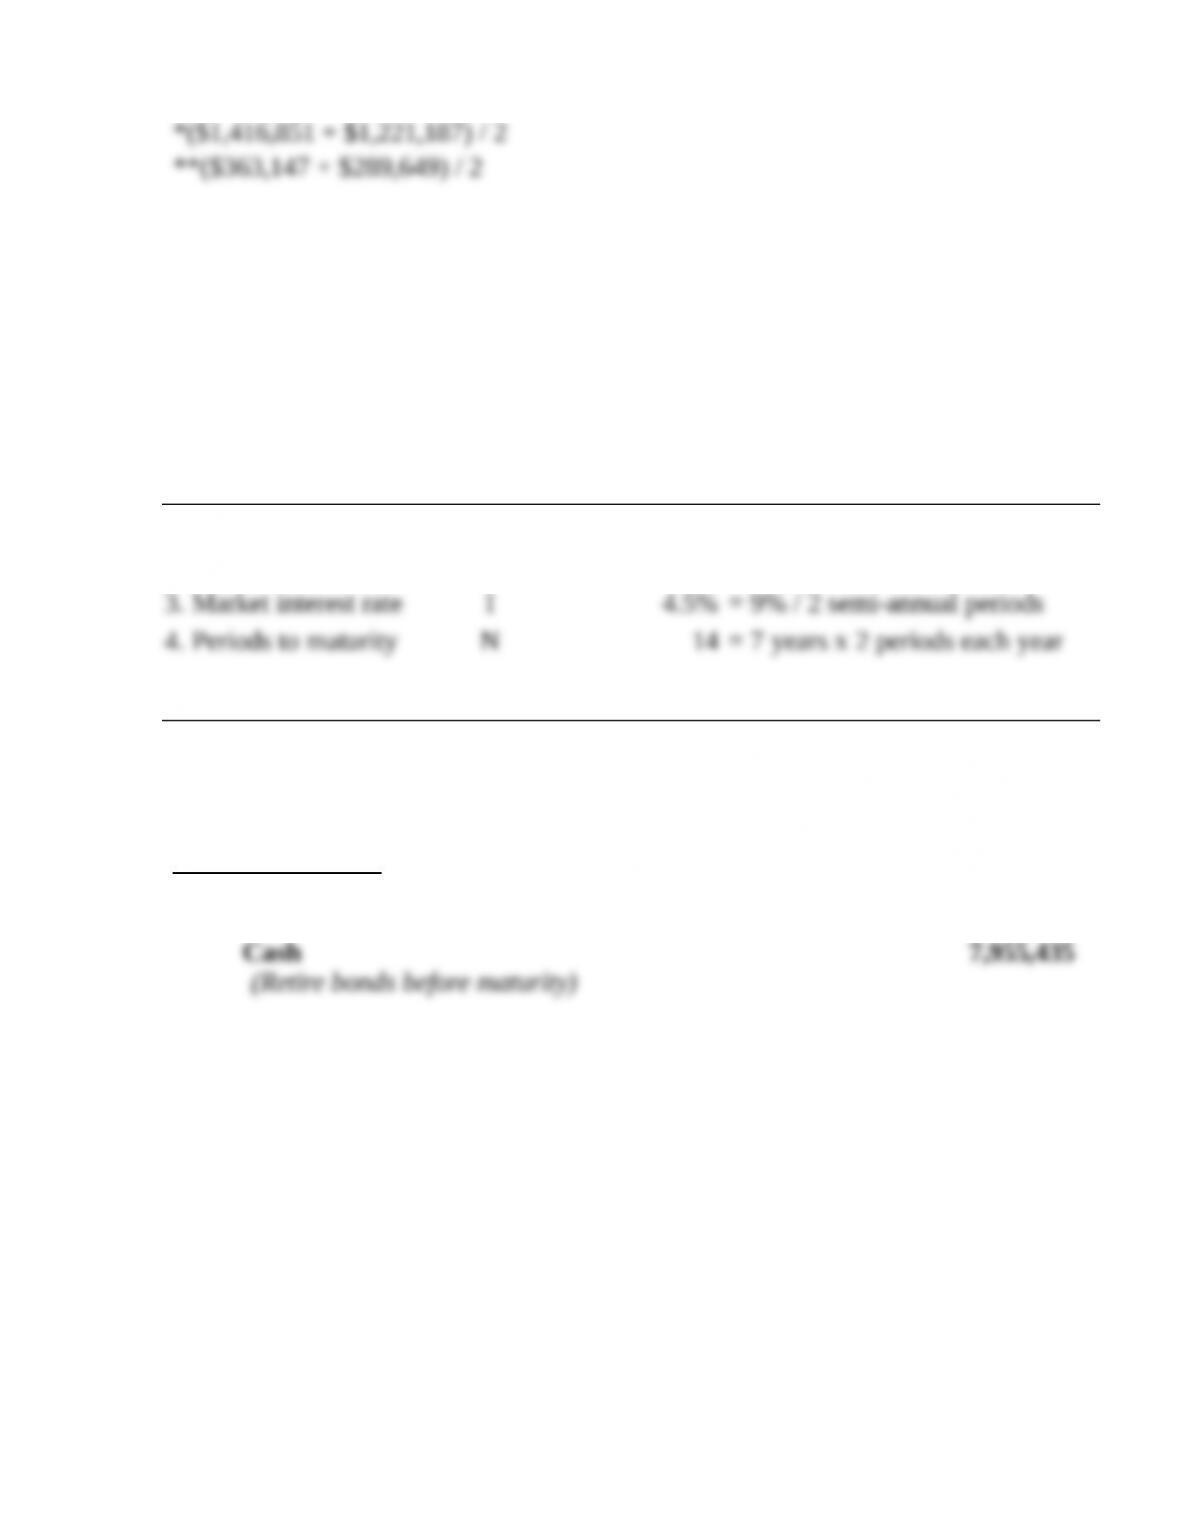
Calculator Input
Bond
Characteristics Key Amount
1. Face amount FV $10,000,000
2. Interest payment PMT $250,000 = $10,000,000 x 5% x ½ year
Calculator Output
Issue price PV $7,955,435
December 31, 2015
Bonds Payable 10,000,000
Gain 2,044,565
Cash 7,955,435
(Retire bonds before maturity)
*($1,416,851 + $1,221,187) / 2
**($363,147 + $289,649) / 2
Buckle has a better return on assets and return on equity ratio than American Eagle.
Ethics
AP9-5
Requirement 1
Requirement 2
Requirement 3
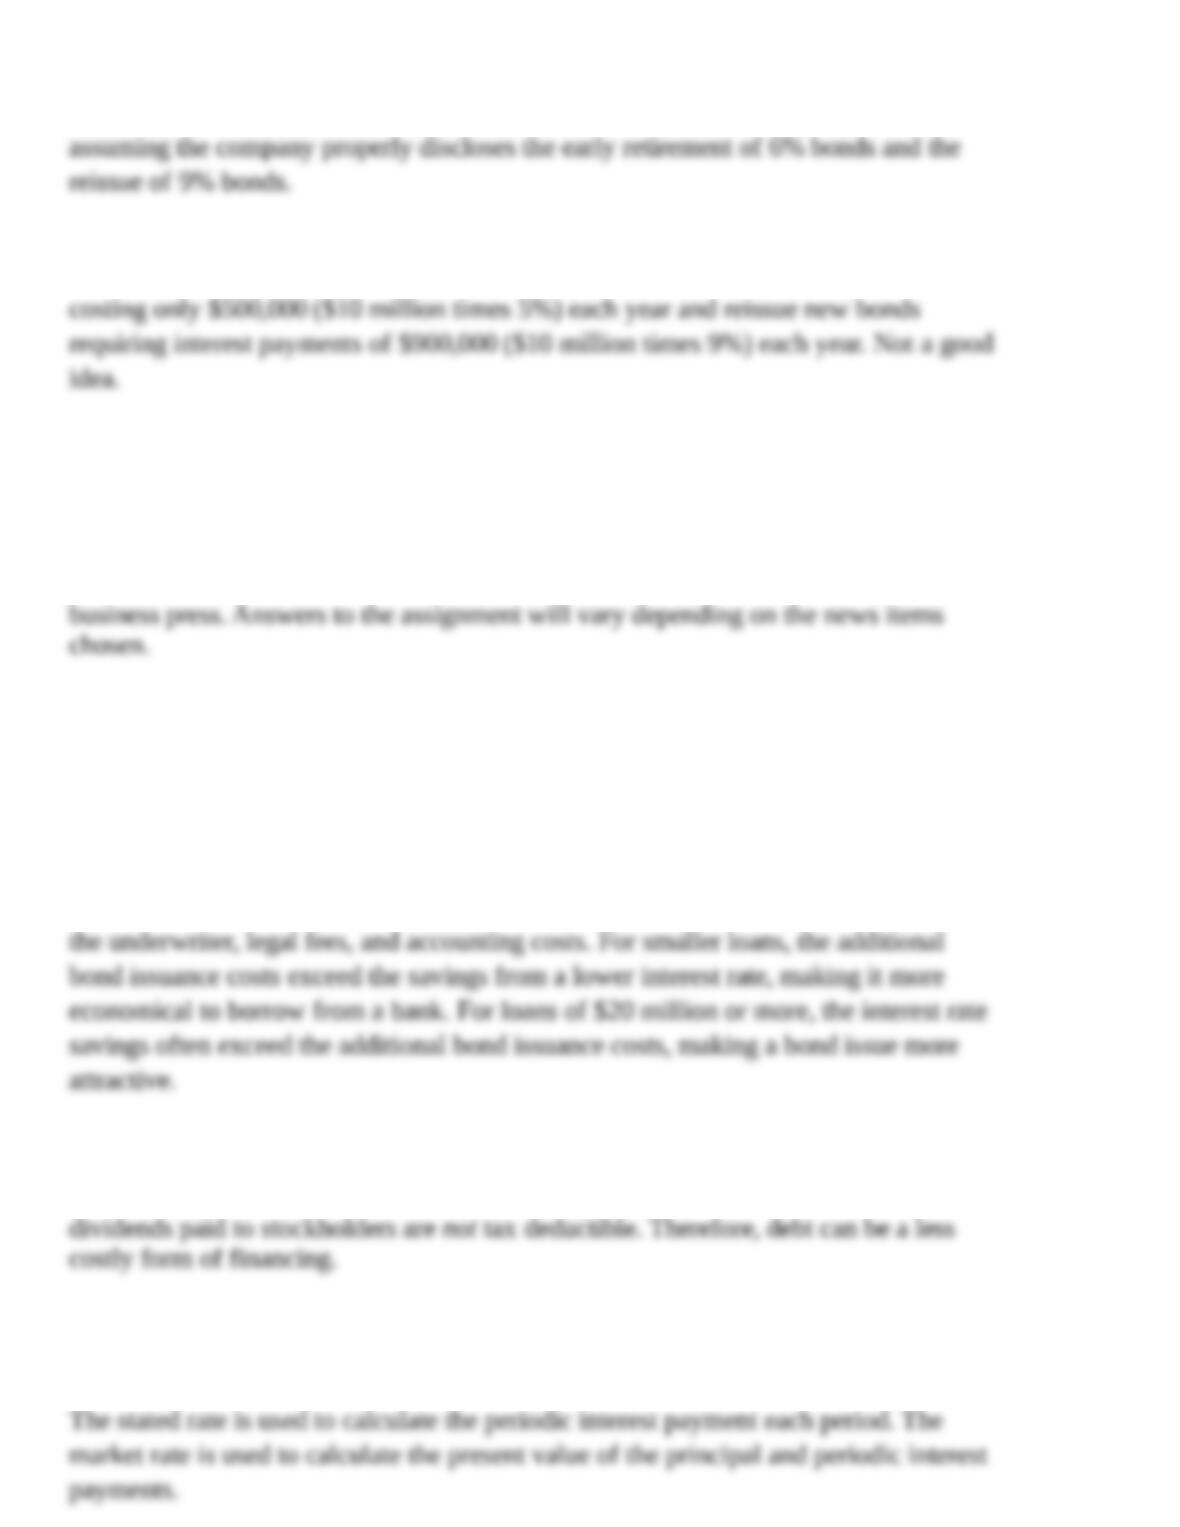
It is not ethical to deceive investors into thinking the $2 million gain is part of
on-going operating income. However, the repurchase of bonds itself is ethical
Requirement 4
In order to report the $2 million gain, the company will give up bonds with interest
Internet Research
AP9-6
This case provides an opportunity for students to learn more about credit ratings at
Standard & Poor’s. This case also allows students to access current items in the
Written Communication
AP9-7
Requirement 1
A company that borrows by issuing bonds is effectively by-passing the bank and
borrowing directly from the investing public, usually at a lower interest rate than it
would in a bank loan. However, issuing bonds entails significant bond issue costs for
Requirement 2
One of the primary reasons for issuing bonds over issuing common stock relates to
taxes. Interest expense incurred when borrowing money is tax deductible, while
Requirement 3
The price of a bond is calculated as the present value of the principal (the face amount
on the bond due at maturity) plus the present value of the periodic interest payments.
Calculator Input
Bond
Characteristics Key Amount
1. Face amount FV $100,000,000
2. Interest payment PMT $3,000,000 = $100,000,000 x 6% x ½ year
Calculator Output
Issue price PV $110,465,146
Calculator Input
Bond
Characteristics Key Amount
1. Face amount FV $100,000,000
2. Interest payment PMT $3,000,000 = $100,000,000 x 6% x ½ year
Calculator Output
Issue price PV $107,794,581
Requirement 2
Requirement 3
Calculator Input
Bond
Characteristics Key Amount
1. Face amount FV $100,000,000
2. Interest payment PMT $3,000,000 = $100,000,000 x 6% x ½ year
Calculator Output
Issue price PV $80,488,095
December 31, 2017
Bonds Payable 107,794,581
Gain 27,306,486
Requirement 4
Requirement 5David Plesko’s plan is ethical as long as he properly discloses the early
retirement of 6% bonds and the reissue of 9% bonds. However, investors would