Problem 6-6B (continued)
Requirement 1 (continued)
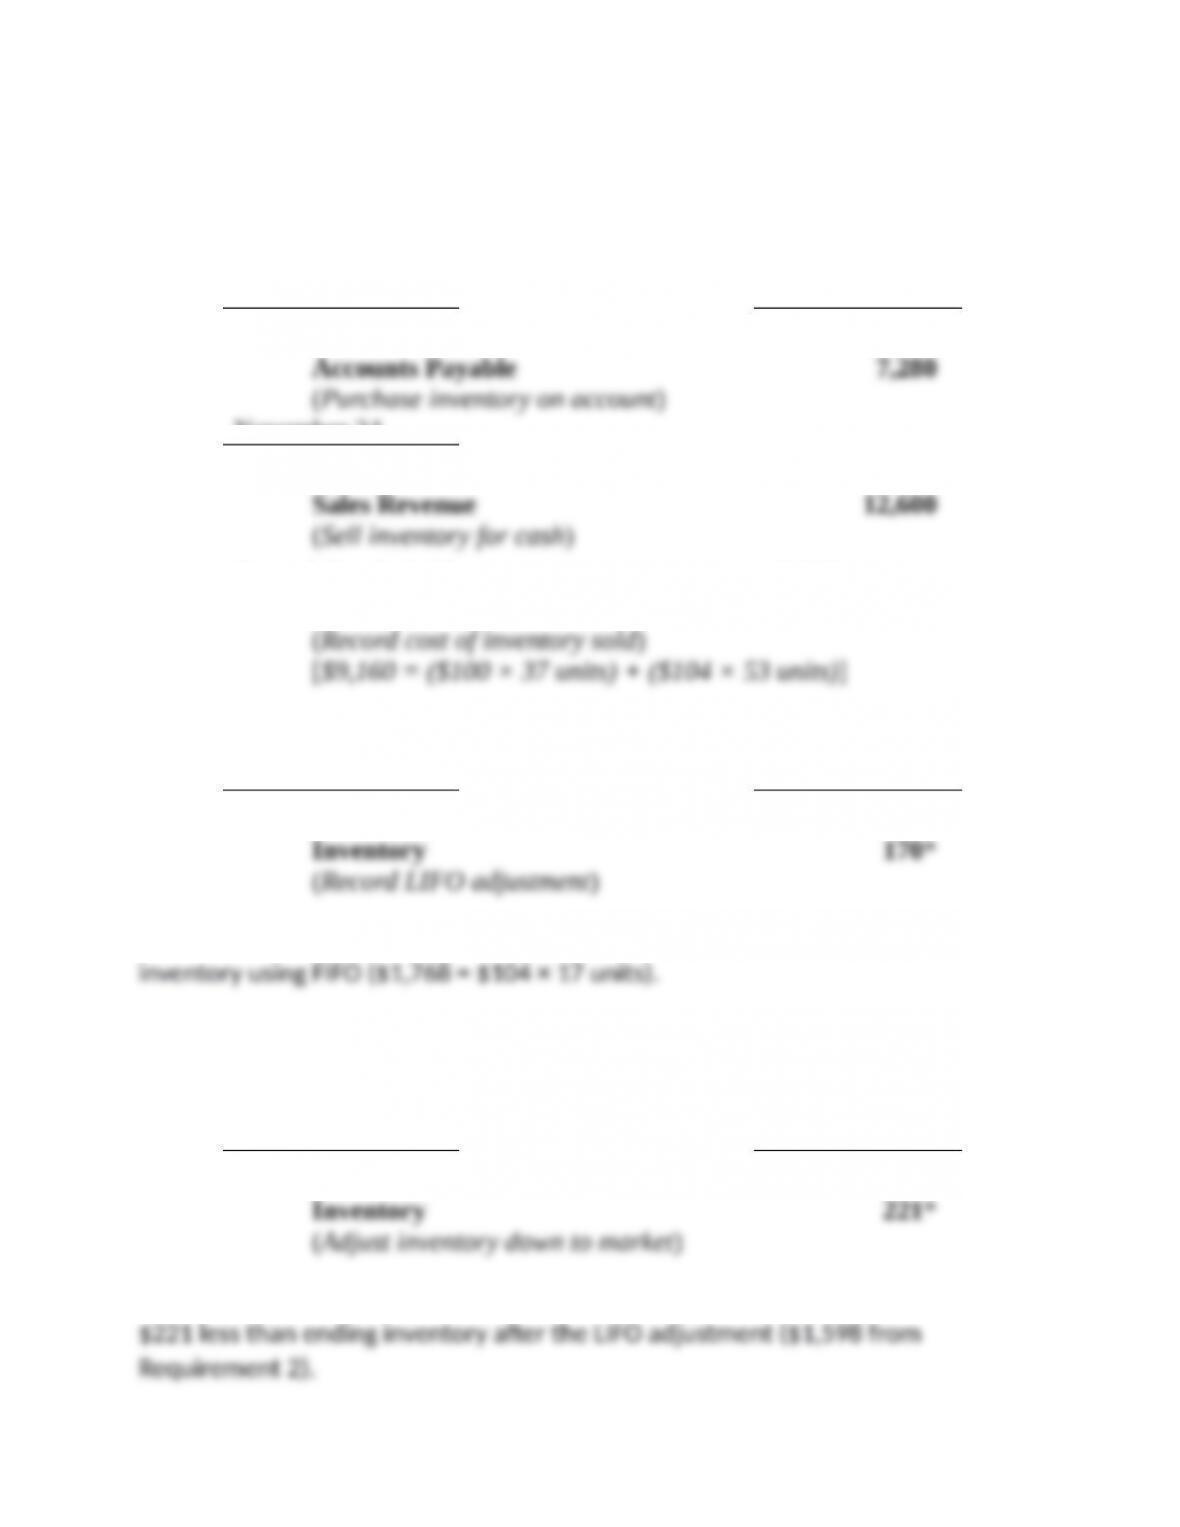
November 21 Debit Credit
Inventory 7,280
November 24
Cash 12,600
Cost of Goods Sold 9,212
Inventory 9,212
Requirement 2
November 30 Debit Credit
Cost of Goods Sold 170
* Ending inventory using LIFO ($1,598 = $94 × 17 units) is $170 less than ending
Problem 6-6B (concluded)
Requirement 3
November 30 Debit Credit
Cost of Goods Sold 221
* The market value of ending inventory ($1,377 = $81 market value × 17 units) is
Requirement 4
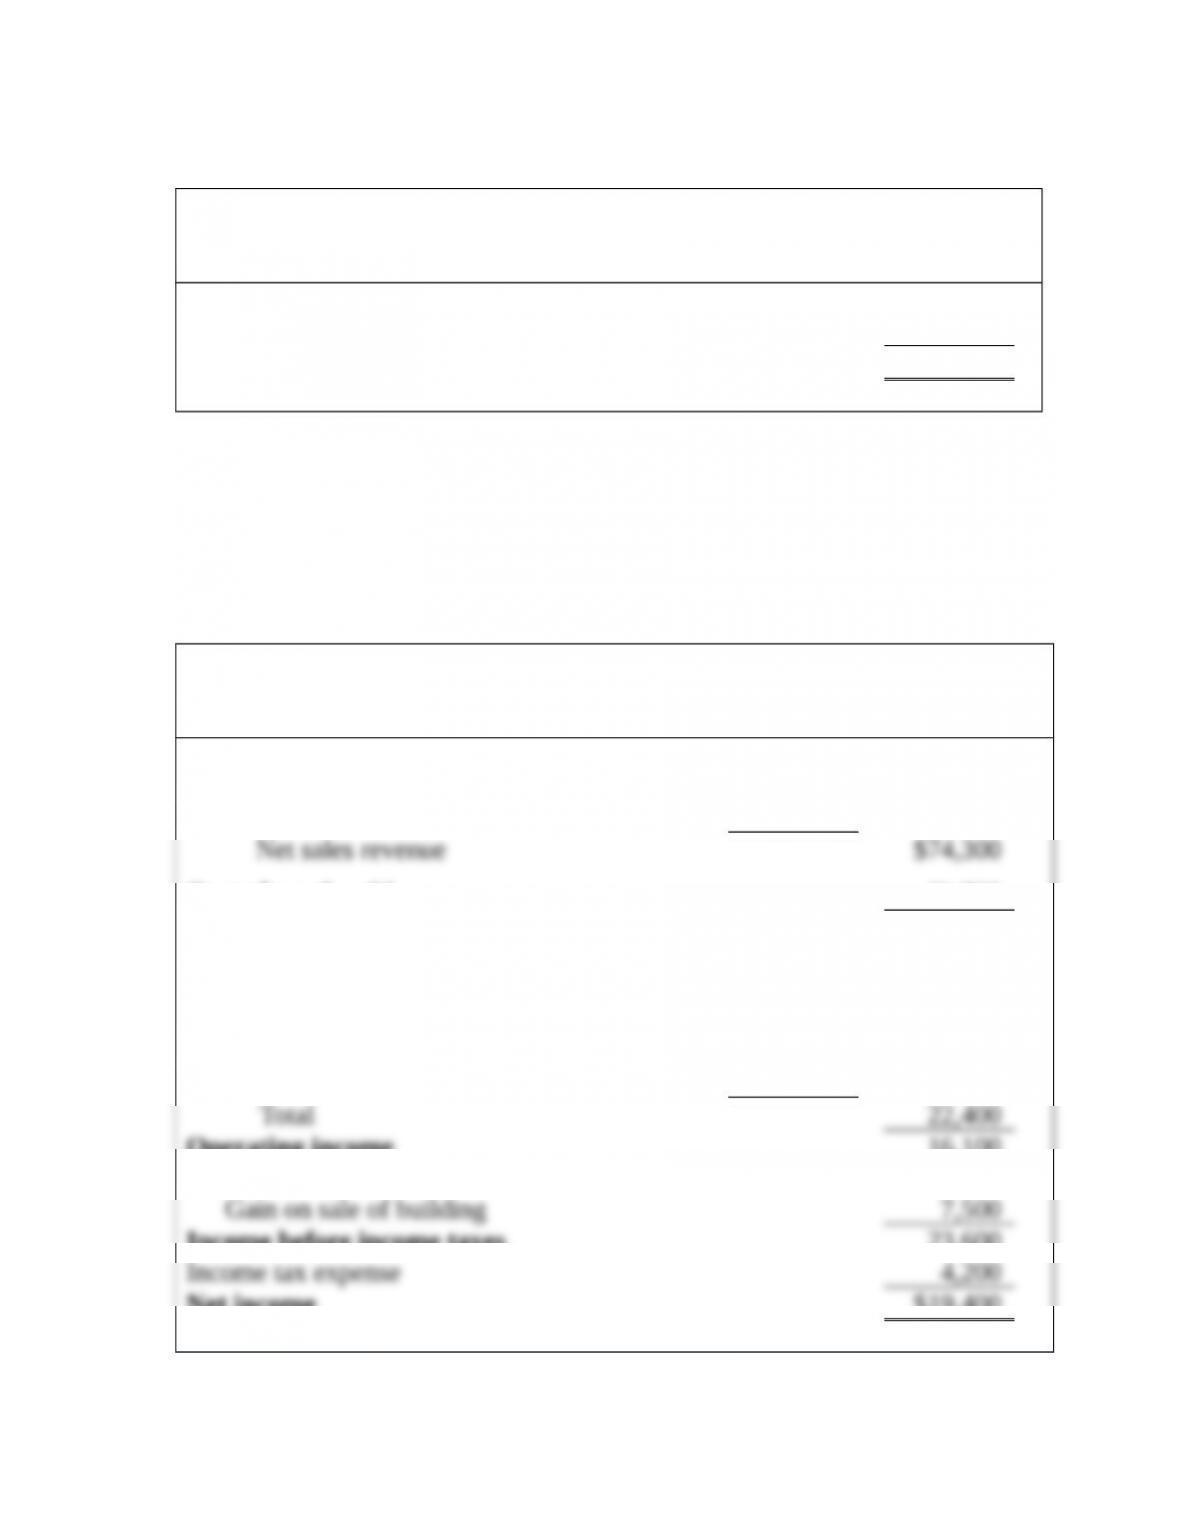
Yoshi Inc.
Multiple-step Income Statement (partial)
For the month of November
Net sales $26,600
Cost of goods sold* 19,243
Gross profit $ 7,357
* Cost of goods sold equals the cost of the units sold ($18,852) + LIFO adjustment
($170) + write down to market value ($221).
Problem 6-7B (LO 6-2, 6-7)
Requirement 1
Toys “R” Us
Multiple-step Income Statement
For the month of March, 2015
Net sales:
Total sales revenue $77,300
Less: Sales discounts (3,000)
Cost of goods sold 35,800
Gross profit 38,500
Operating expenses:
Advertising 6,400
Rent 4,300
Insurance 2,300
Salaries 9,400
Operating income 16,100
Non-operating items:
Income before income taxes 23,600
Net income $19,400

Problem 6-7B (concluded)
Requirement 2
Inventory
turnover
ratio
=Cost of goods sold =$35,800
Average inventory ($2,800 + $1,000) /2
This ratio will likely be higher in December when inventory is being sold at a much
faster pace due to the holiday season.
Requirement 3
Gross
profit
ratio
=Gross profit =$38,500
Net sales $74,300
Problem 6-8B (LO 6-7)
Requirement 1
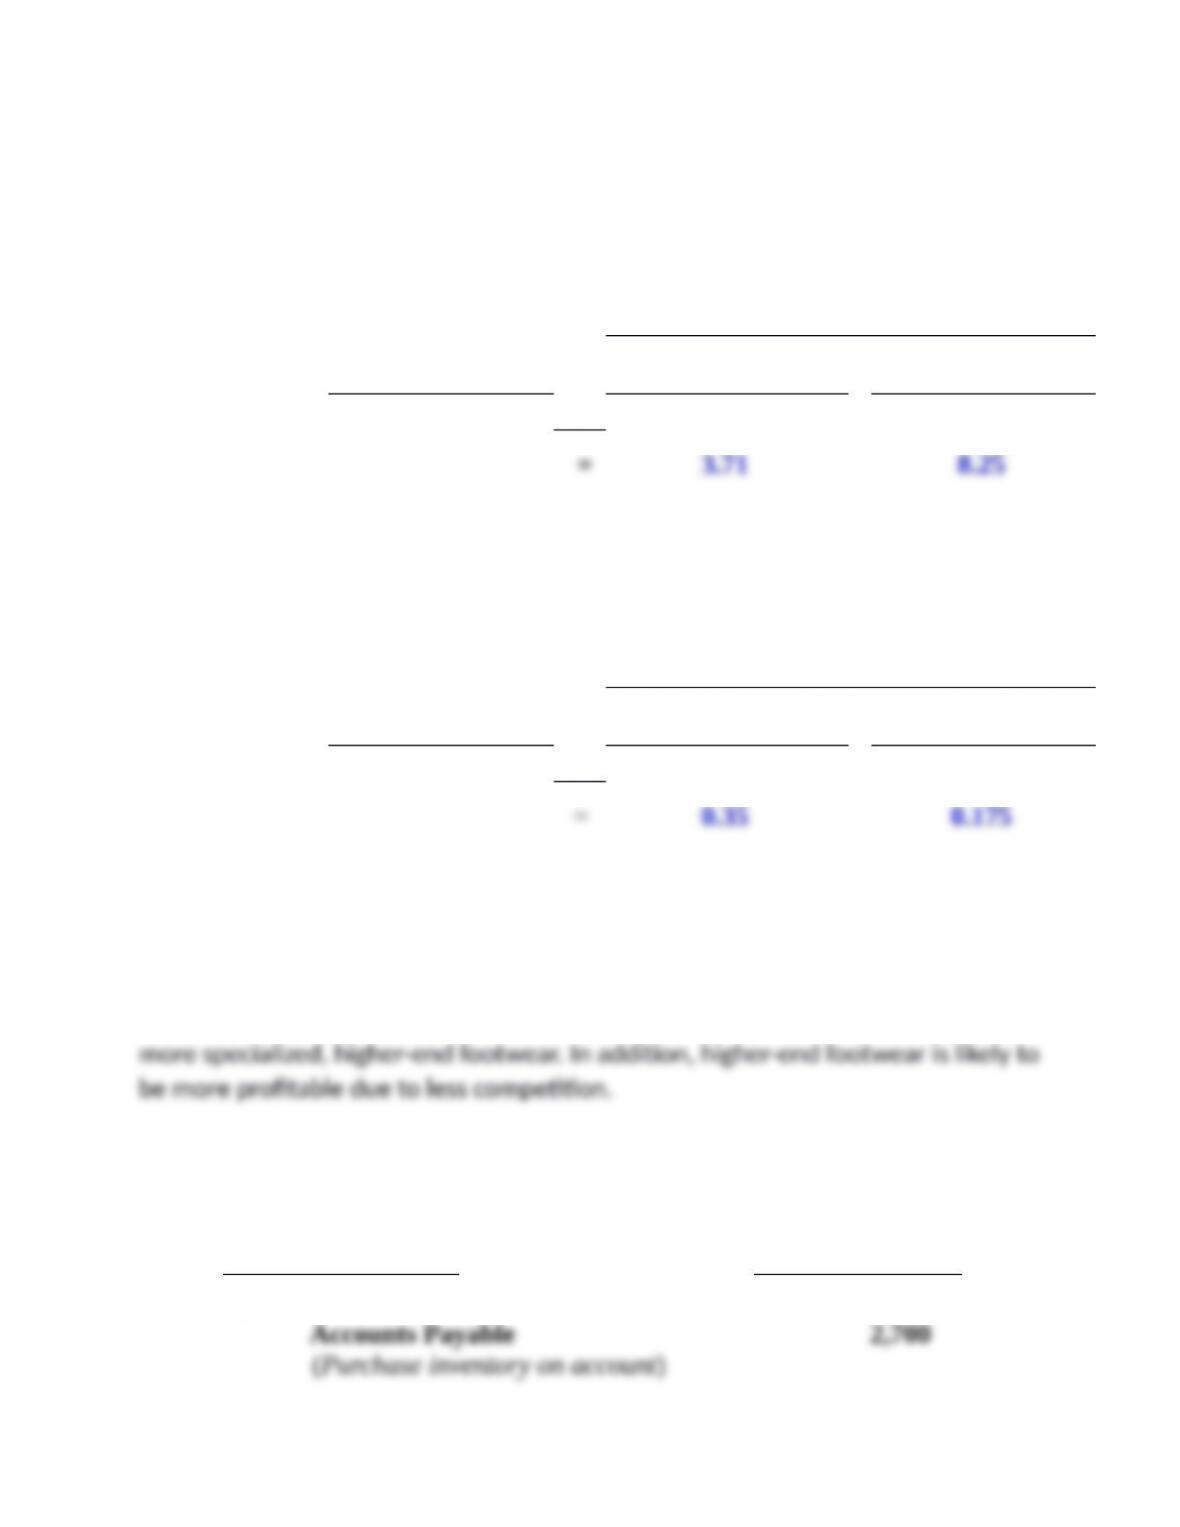
Company 1 Company 2
Inventory
turnover
ratio
=Cost of goods sold =$130,000 $165,000
Average inventory $35,000 $20,000
Requirement 2
Company 1 Company 2
Gross
profit
ratio
=Gross profit =$70,000 $35,000
Net sales $200,000 $200,000
Requirement 3
Company 1 is likely Dillard’s and Company 2 is likely Payless. The reason is that
common, lower-to-middle priced footwear is likely to sell more quickly than is
Problem 6-9B (LO 6-8)
Requirement 1
June 2 Debit Credit
Purchases 2,700
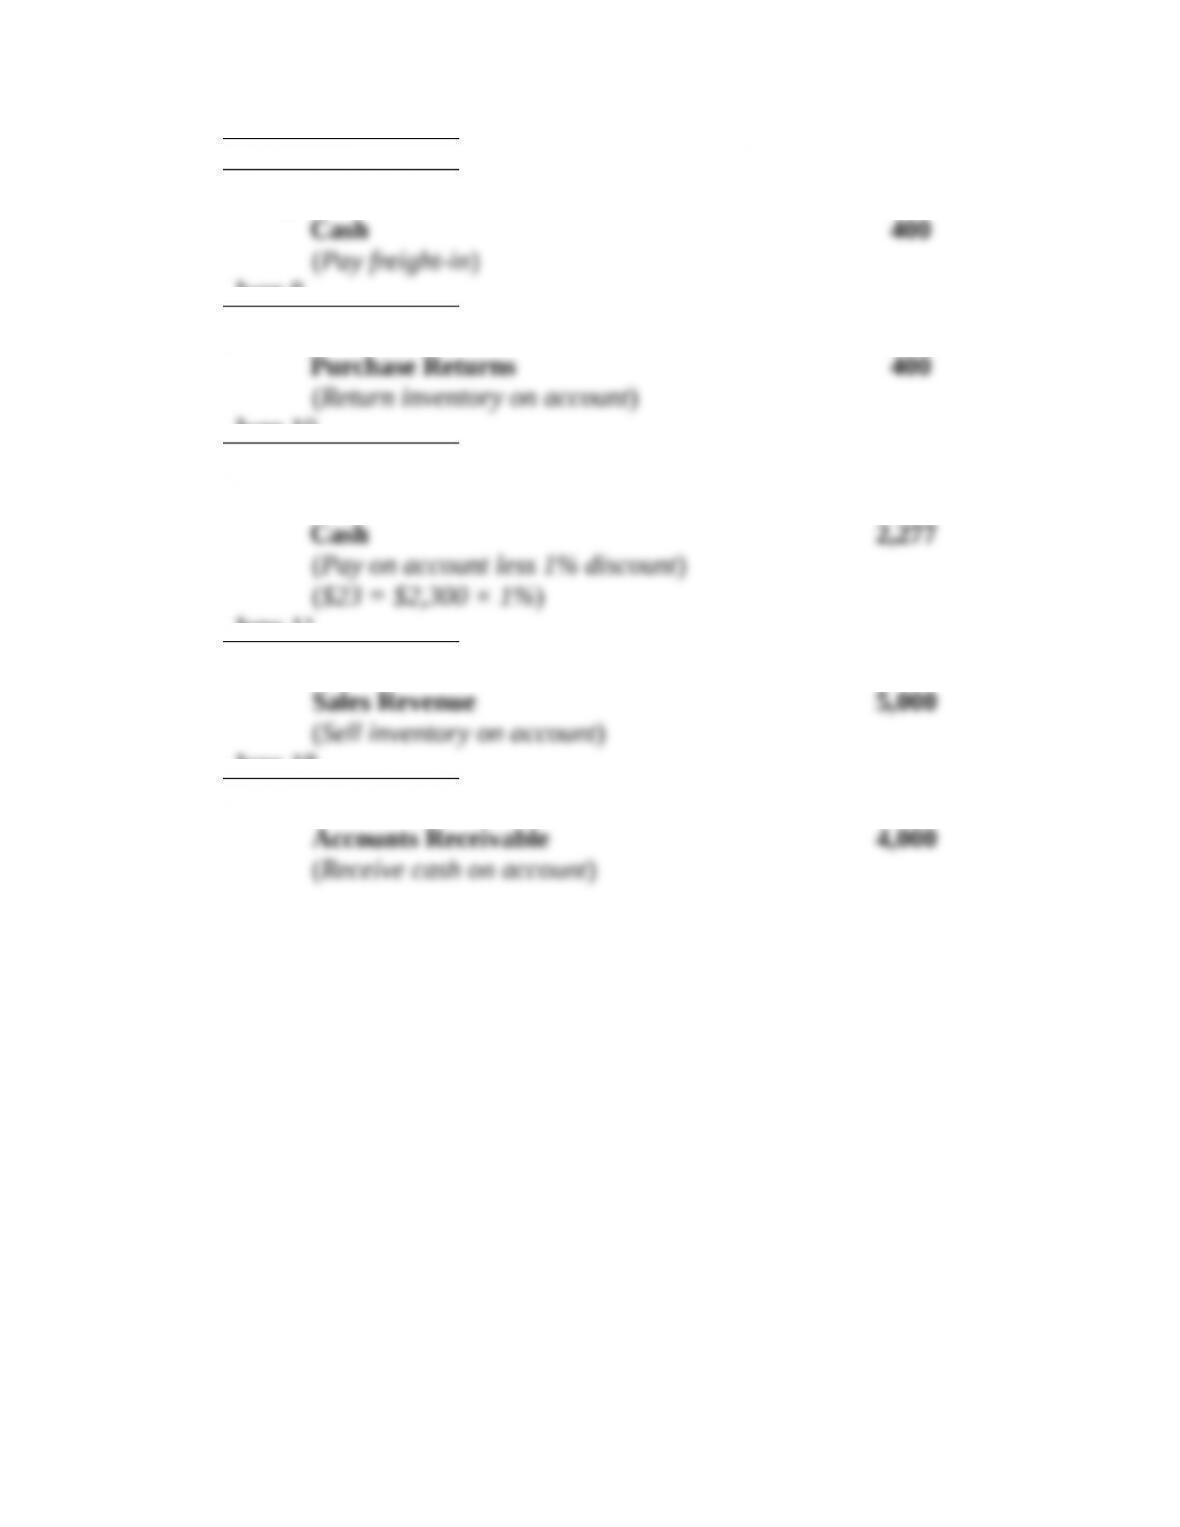
June 4
Freight-In 400
June 8
Accounts Payable 400
June 10
Accounts Payable 2,300
Purchase Discounts 23
June 11
Accounts Receivable 5,000
June 18
Cash 4,000
Problem 6-9B (concluded)
Requirement 1 (continued)
June 20 Debit Credit
Purchases 3,800
June 23
Cash 5,300
June 26
Accounts Payable 500
June 28
Accounts Payable 3,300
Cash 3,201
Requirement 2
July 31 Debit Credit
Inventory (ending) 2,078
Cost of Goods Sold 6,800
Purchase Returns 900
Purchase Discounts 122
Purchases 6,500
Freight-In 400
Problem 6-9B (concluded)
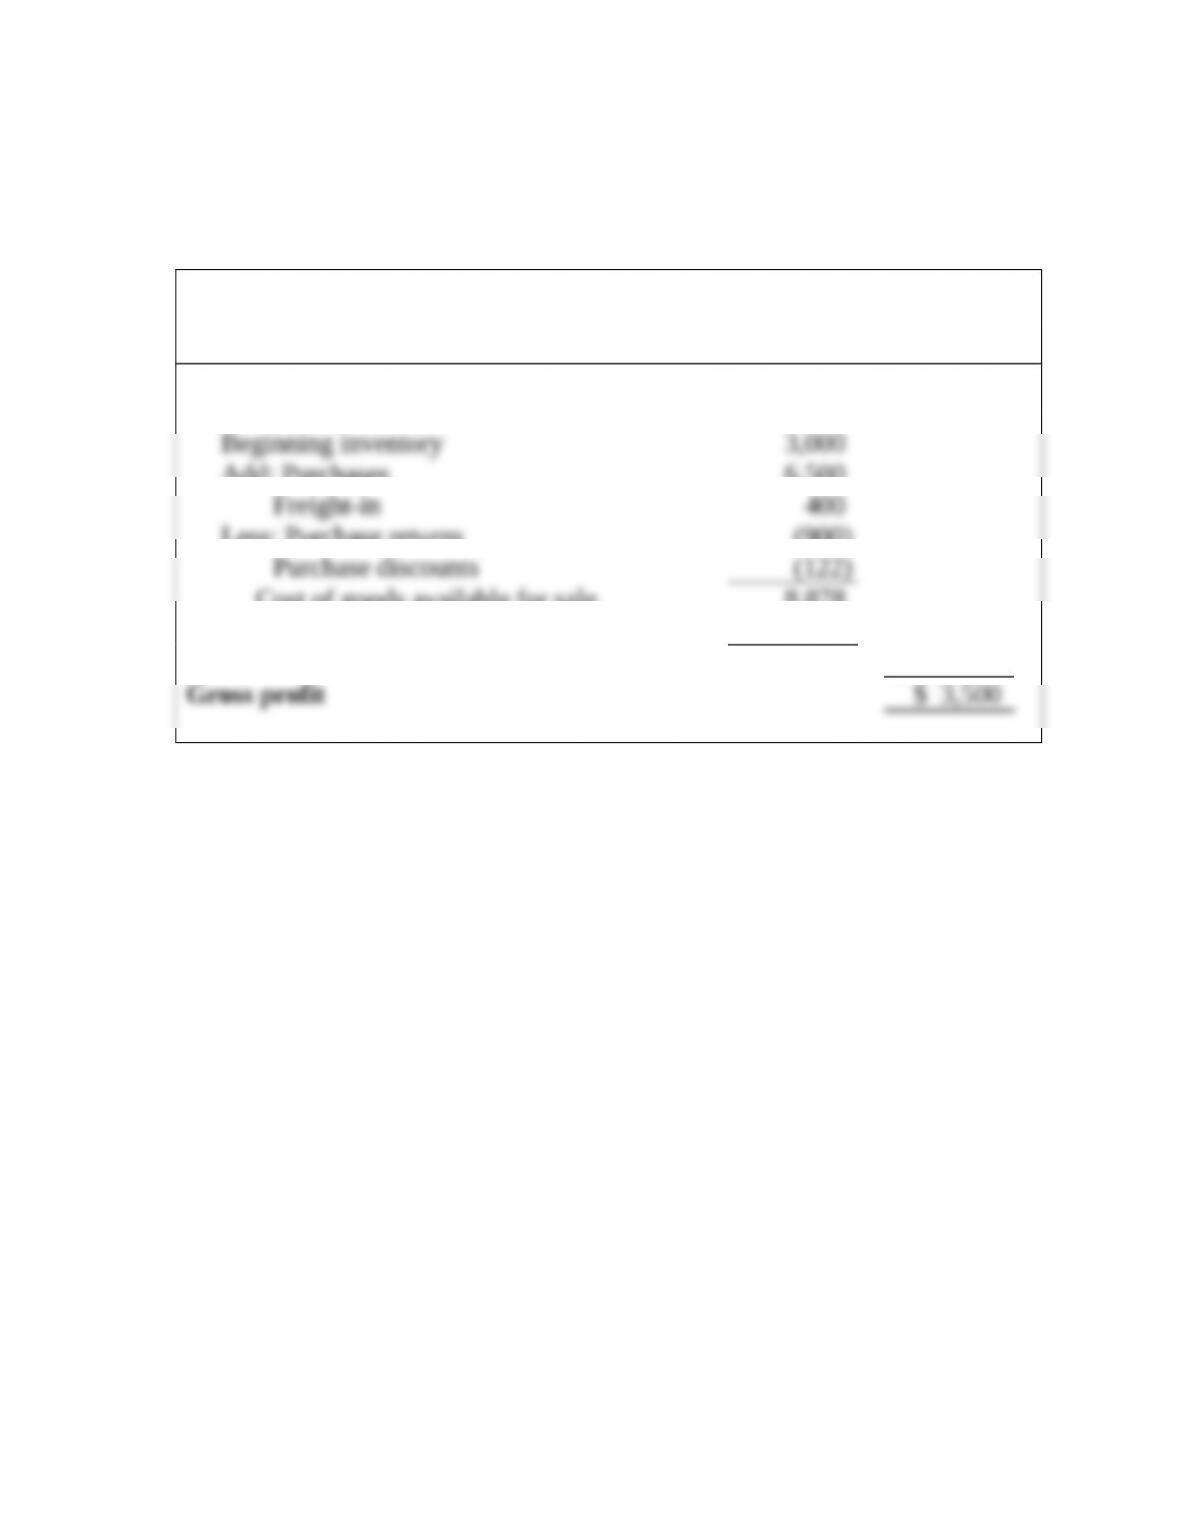
Requirement 3
Circuit Country
Multiple-step Income Statement (partial)
For the month of July
Net sales $10,300
Cost of goods sold:
Add: Purchases
6,500
Less: Purchase returns
(900)
Cost of goods available for sale 8,878
Less: Ending inventory (2,078)
Cost of goods sold 6,800
Problem 6-10B (LO 6-3, 6-9)
Requirement 1
Date Transaction
Number
of units
Unit
cost
Ending
Inventory
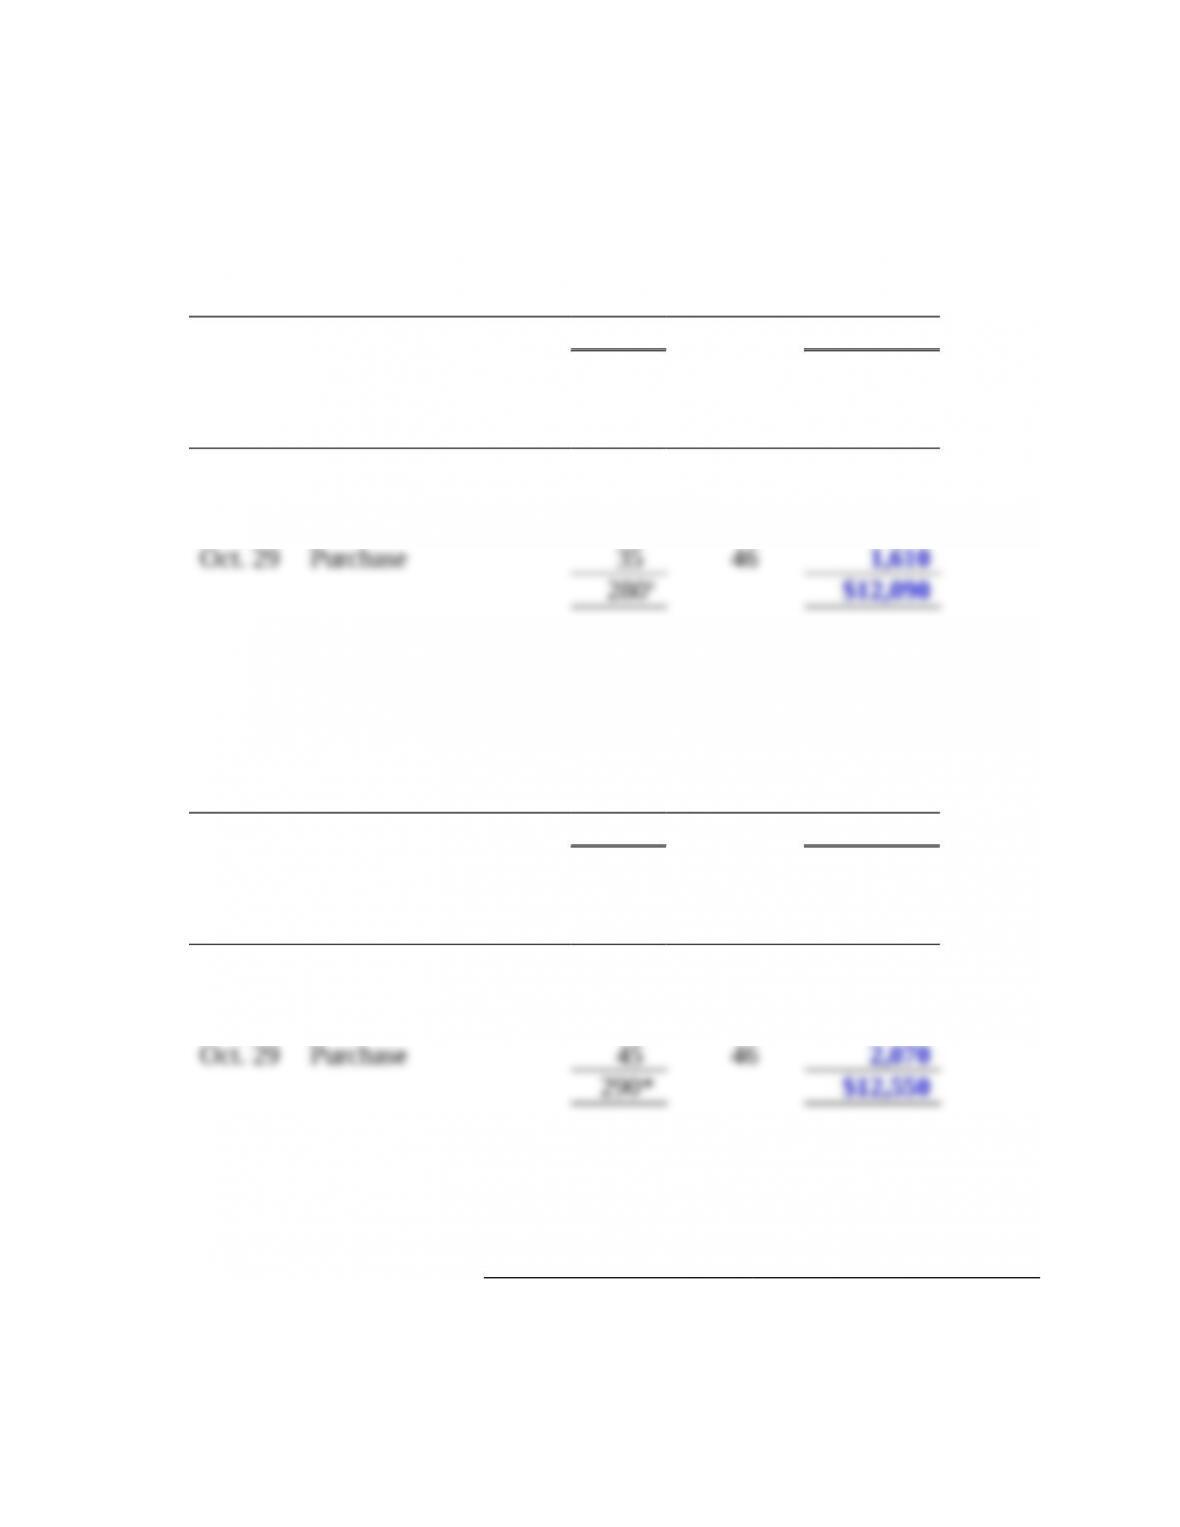
Oct. 29 Purchase 60 $46 $2,760
Date Transaction
Number
of units
Unit
cost
Cost of
Goods Sold
Jan. 1 Beginning inventory 35 $40 $ 1,400
Apr. 14 Purchase 80 42 3,360
Aug. 22 Purchase 130 44 5,720
a First 280 units purchased are assumed sold
Requirement 2
Date Transaction
Number
of units
Unit
cost
Ending
Inventory
Oct. 29 Purchase 50 $46 $2,300
Date Transaction
Number
of units
Unit
cost
Cost of
Goods Sold
Jan. 1 Beginning inventory 35 $40 $ 1,400
Apr. 14 Purchase 80 42 3,360
Aug. 22 Purchase 130 44 5,720
* First 290 units purchased are assumed sold (including the 10 lost units)
Requirements 3 and 4
2015 2016
(a) ending inventory Overstate No Effect
(b) retained earnings Overstate No Effect
(c) cost of goods sold Understate Overstate
(d) net income Overstate Understate
AP6-1
Requirement 1 (a)
Sales Revenue
Date Number of units Sale price Total sales
Jul. 31 40 $300 $12,000
Aug. 22 30 300 9,000
Nov. 20 90 300 27,000
Dec. 8 40 300 12,000
Cost of Goods Sold*
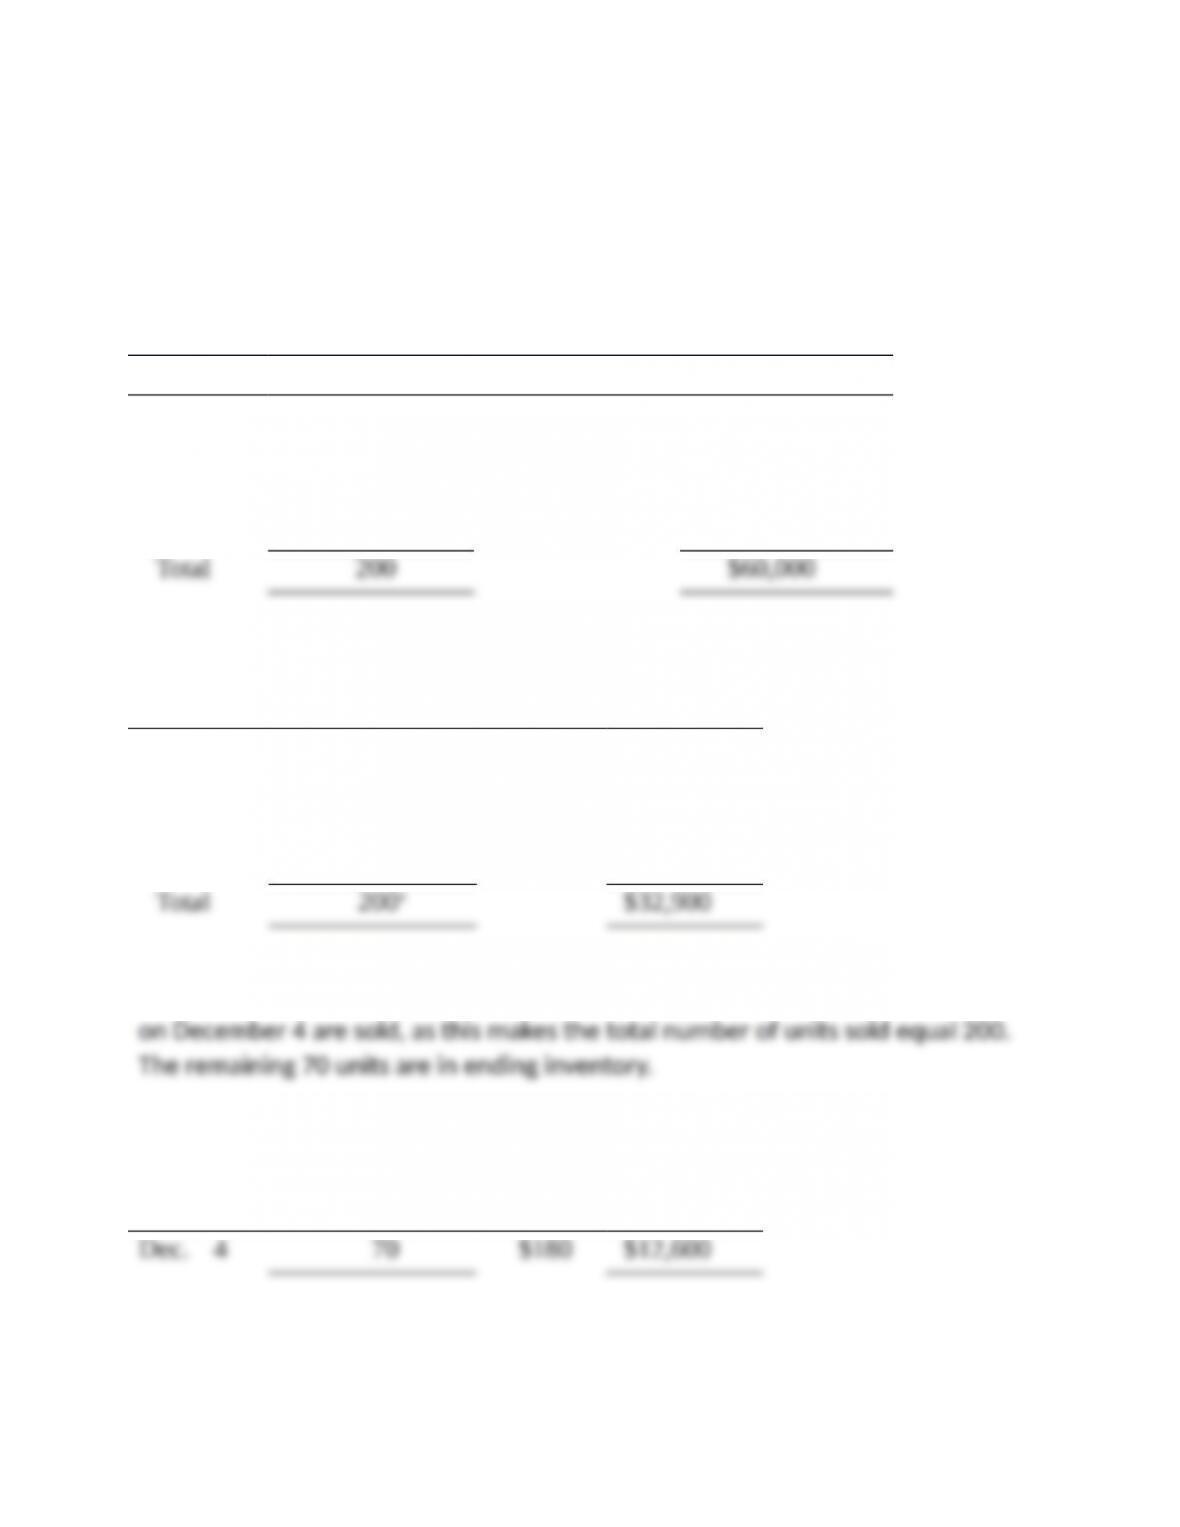
Date Number of units Unit cost Total cost
Jul. 17 50 $150 $ 7,500
Aug. 12 40 160 6,400
Oct. 27 80 170 13,600
Dec. 4 30** 180 5,400
a First 200 units purchased are assumed sold. Only 30 of the 100 units purchased
Ending Inventory
Date Number of units Unit cost Total cost
ADDITIONAL PerspectiveS