Exercise 12-5 (LO12.3)
Requirement 1
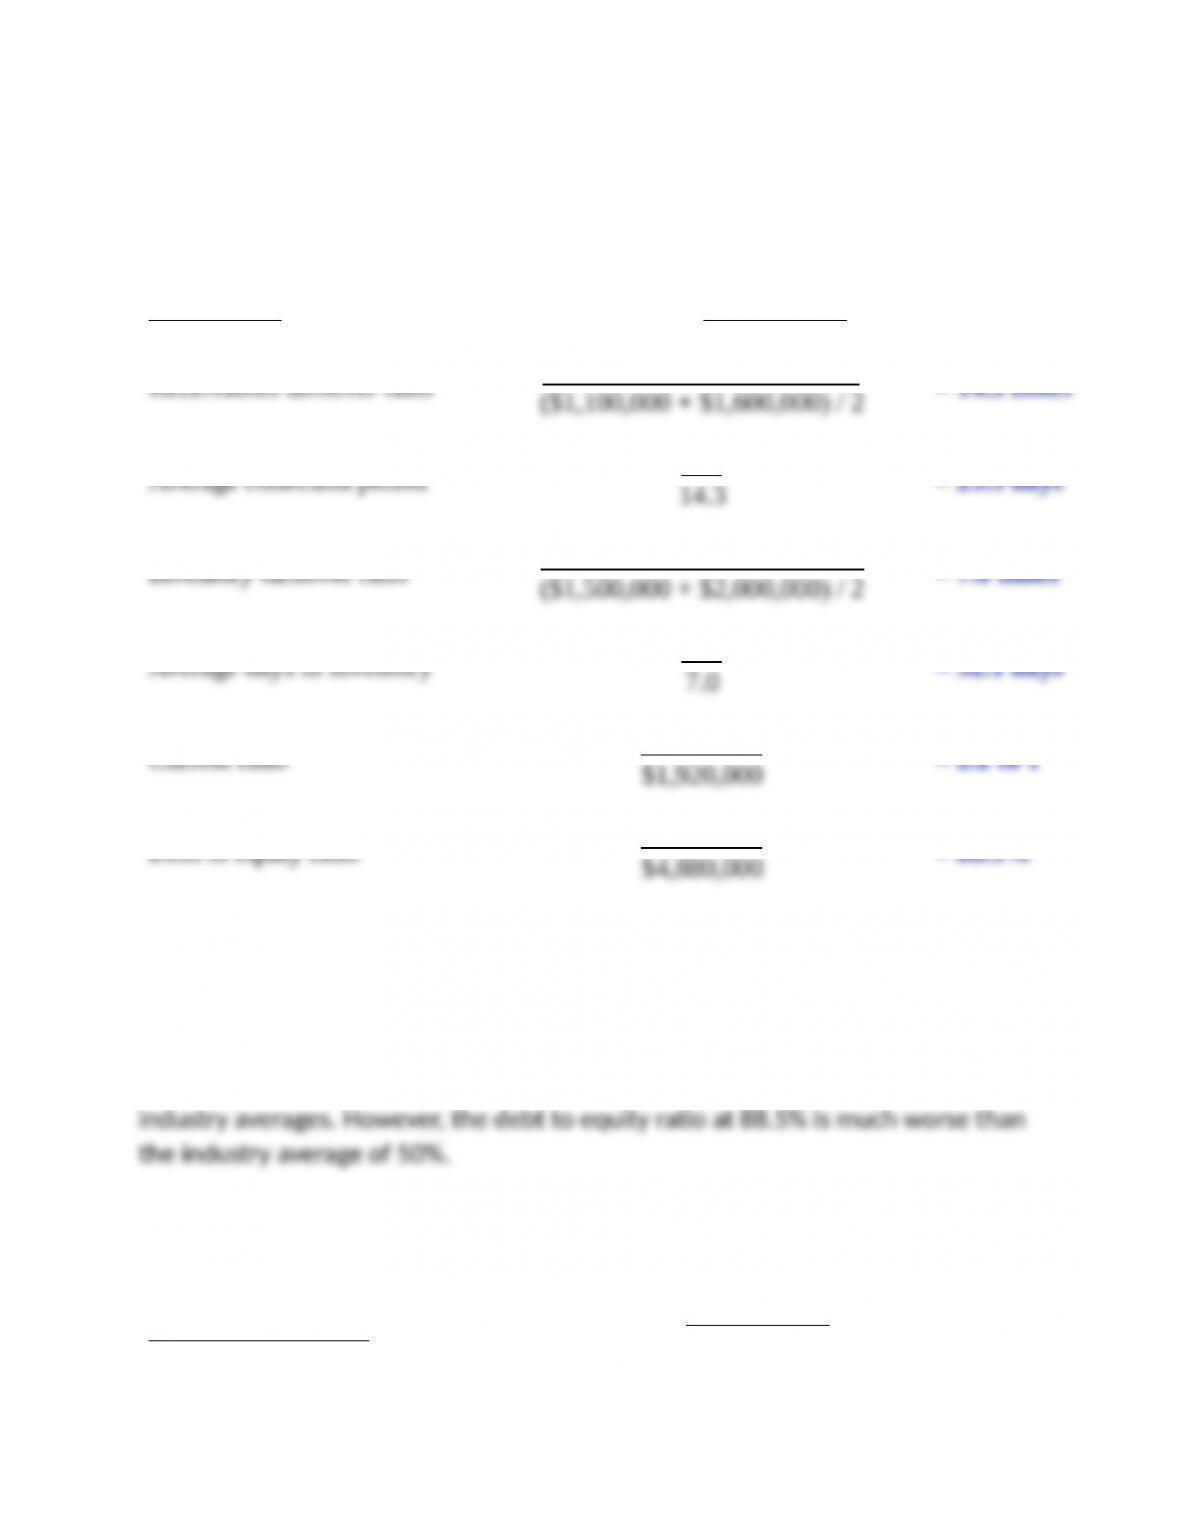
Risk Ratios Calculations
Receivables turnover ratio $19,310,000
Average collection period 365
Inventory turnover ratio $12,250,000
Average days in inventory 365
Current ratio $4,300,000
Debt to equity ratio $4,320,000
Requirement 2
Based on the above ratios, Adrian Express is more risky than the industry average.
The receivable turnover, inventory turnover, and current ratios are close to the
Exercise 12-6 (LO12.4)
Requirement 1
Profitability Ratios Calculations
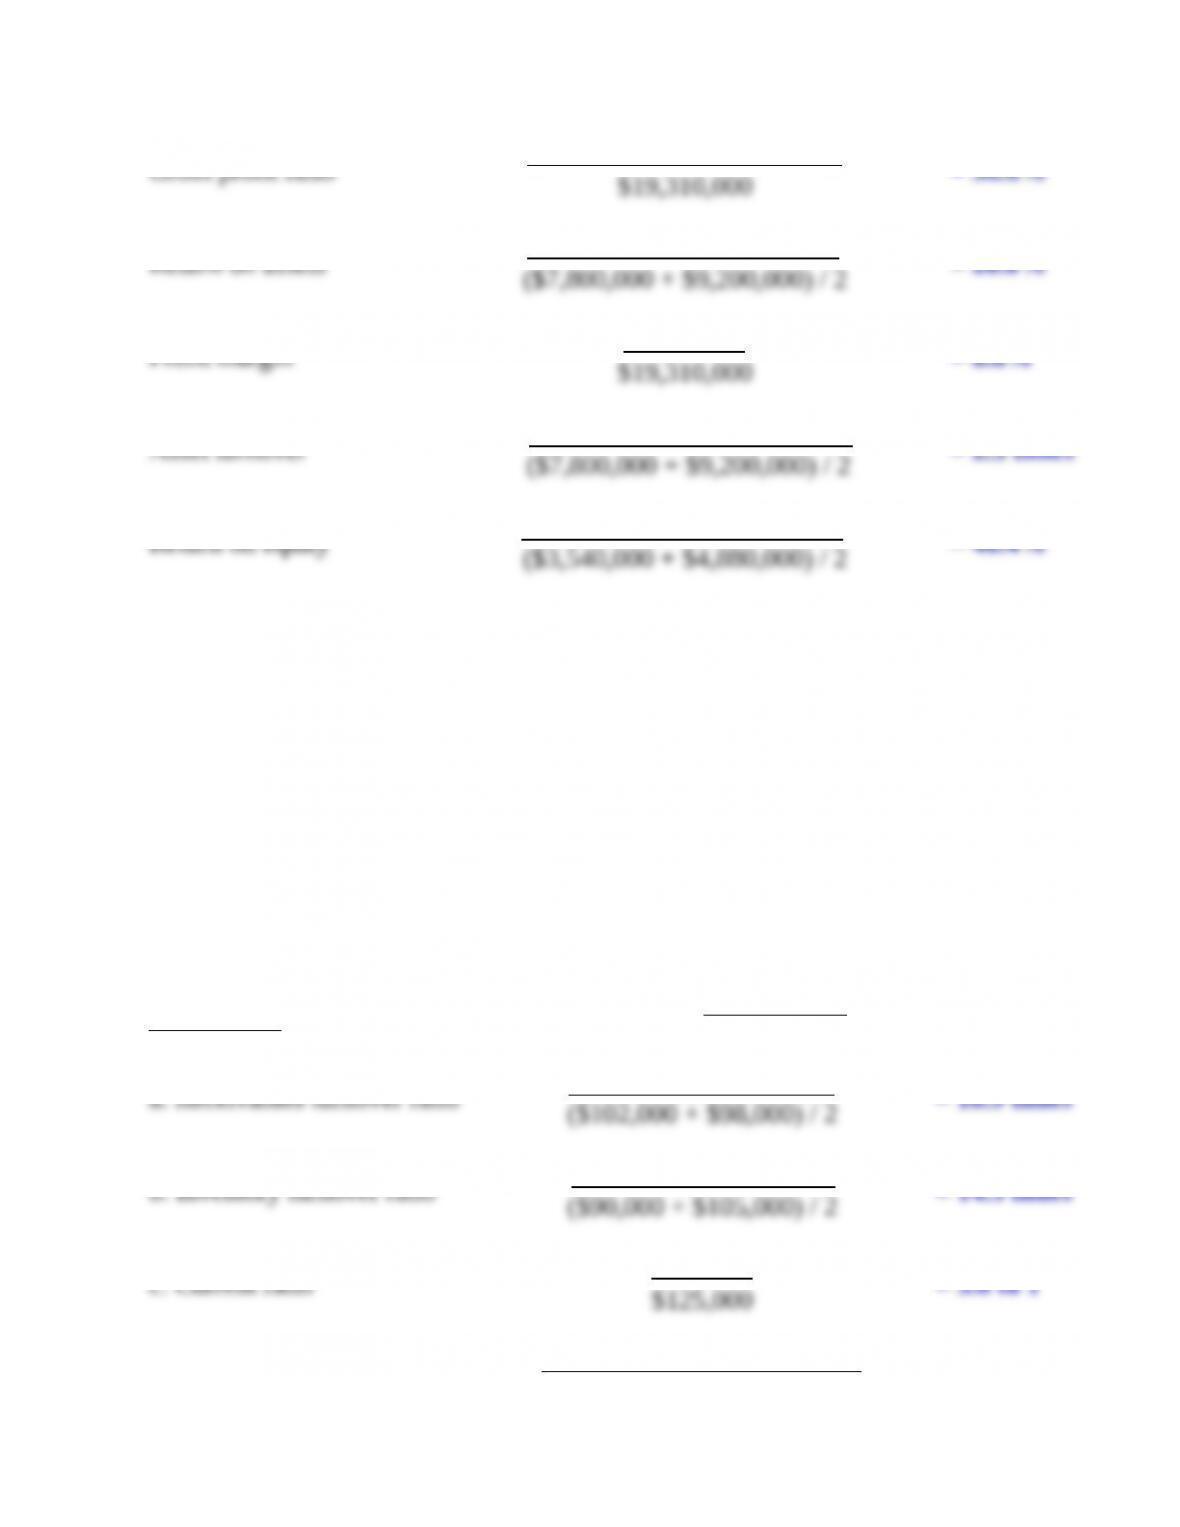
Gross profit ratio ($19,310,000 – $12,250,000)
Return on assets $1,700,000
Profit margin $1,700,000
Asset turnover $19,310,000
Return on equity $1,700,000
Requirement 2
Adrian Express is less pro/table than the industry average. The gross profit ratio,
return on assets, profit margin, and asset turnover are all below the industry
average. Return on equity of 40% is an exception, exceeding the industry average
of 35%.
Exercise 12-7 (LO12.3)
Requirement 1
Risk Ratios Calculations
a. Receivables turnover ratio $1,890,000
b. Inventory turnover ratio $1,394,250
c. Current ratio $450,000
d. Acid-test ratio $242,000 + $98,000 + $5,000 = 2.8 to 1
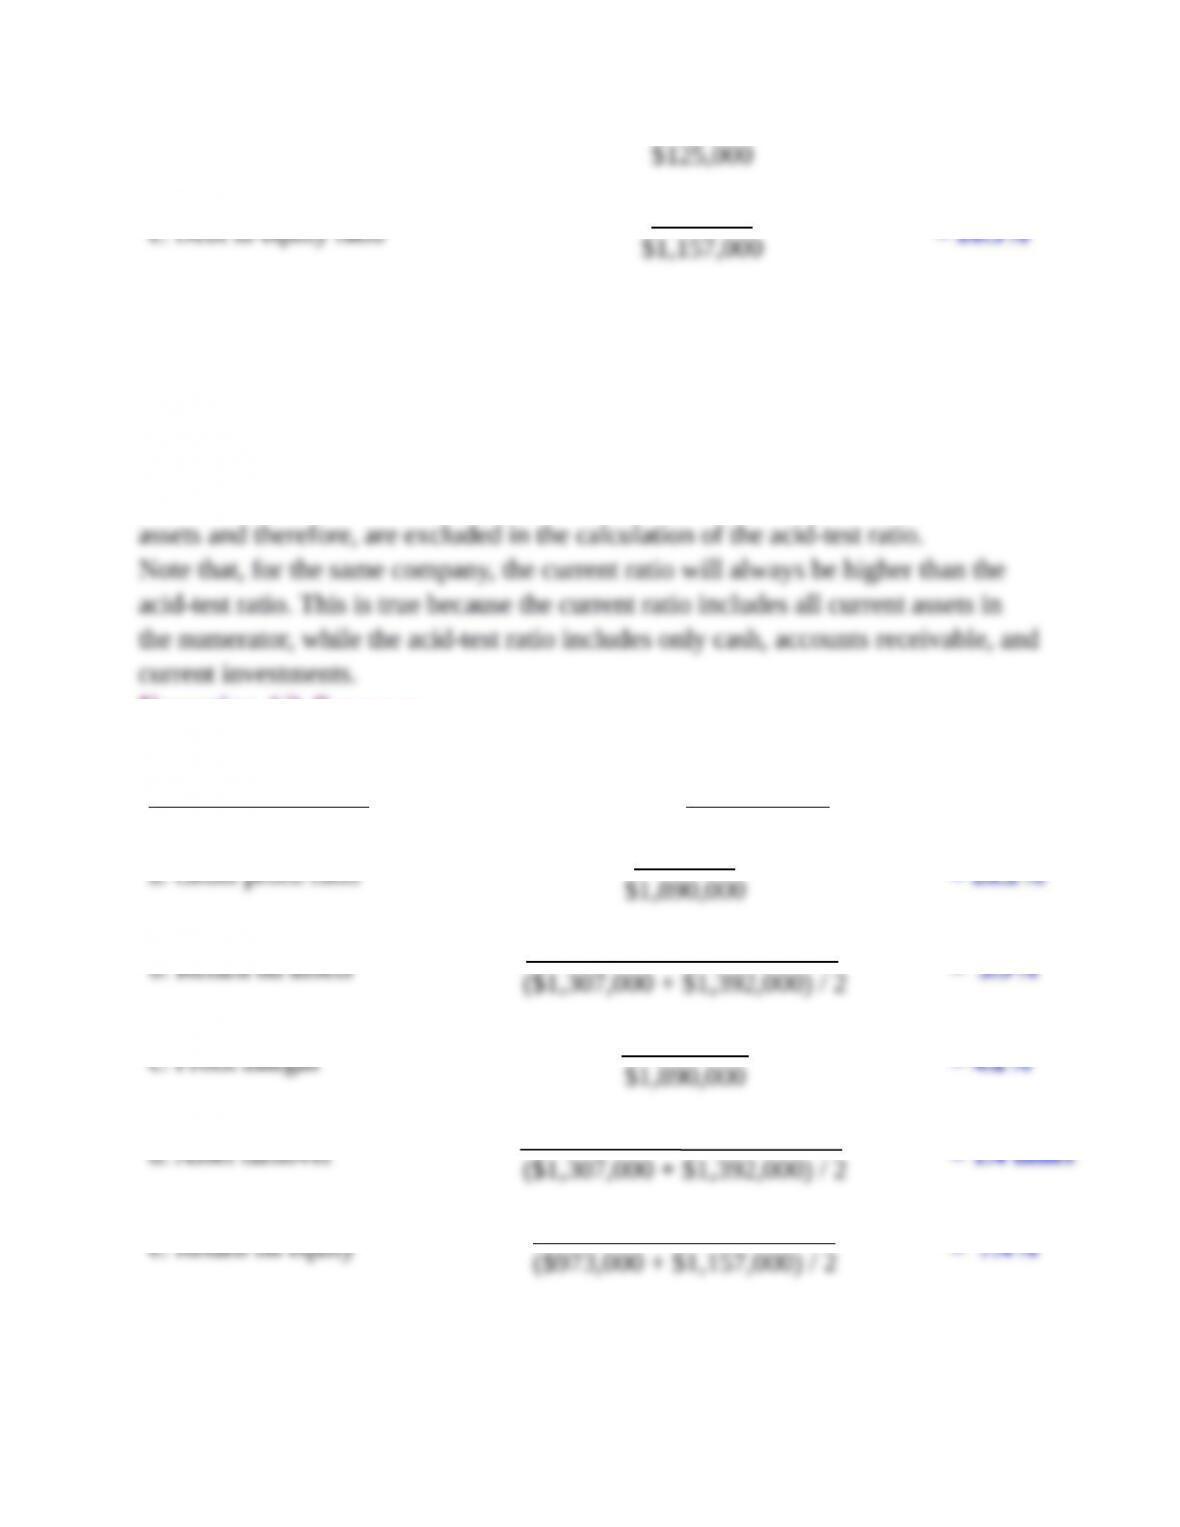
e. Debt to equity ratio $235,000
Requirement 2
One company can have a higher current ratio while the other has a higher acid-test
ratio. The company may have a higher current ratio due to higher inventory and
prepaid expenses. Inventory and prepaid expenses are less liquid than other current
Exercise 12-8 (LO12.4)
Requirement 1
<
Profitability Ratios Calculations
a. Gross profit ratio $495,750
b. Return on assets $79,000
c. Profit margin $79,000
d. Asset turnover $1,890,000
e. Return on equity $79,000

Requirement 2
One company can have a higher return on assets while the other company has a
higher return on equity. The return on equity takes into consideration leverage –
Exercise 12-9 (LO12.4)
Requirement 1
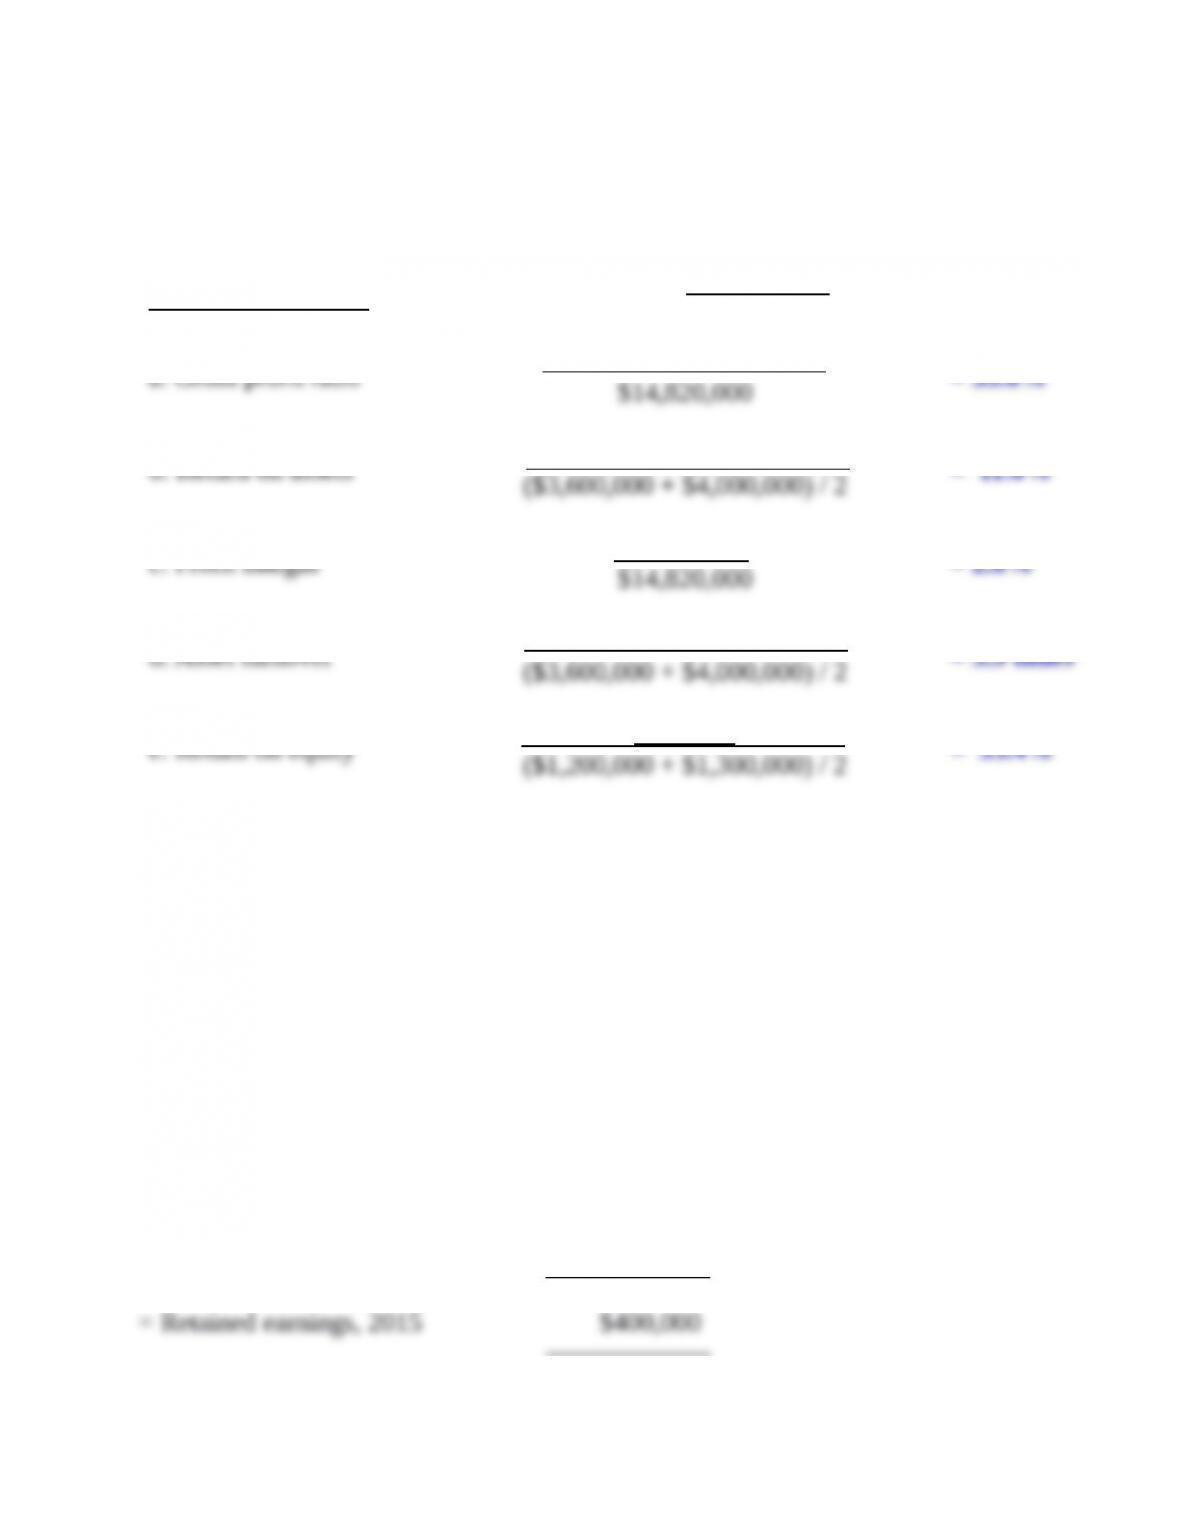
Profitability Ratios Calculations
a. Gross profit ratio $14,820,000 – $9,544,080
b. Return on assets $418,000
c. Profit margin $418,000
d. Asset turnover $14,820,000
e. Return on equity $418,000
Requirement 2
Dividends paid to shareholders in 2015 were $318,000. This amount can be
determined by analyzing the changes to retained earnings as follows:
Retained earnings, 2014 $300,000
+ Net income 418,000
– Dividends paid (318,000)

Exercise 12-10 (LO12.4)
Profitability Ratios Calculations
Return on assets $65,700
Profit margin $65,700
Asset turnover $540,000
Return on equity $65,700
Stockholders’ equity, beginning $600,000
+ Net income 65,700
– Dividends paid (30,000)
Exercise 12-11 (LO12.5)
Classification Brief Justification
a. Extraordinary items Unusual in nature and infrequent in occurrence.
b. Discontinued operations Sale of a major component of the business.
c. Other expenses Employee strikes are not considered extraordinary.
d. Other expenses Litigation is not considered extraordinary.
e. Other expenses One restaurant out of 40 restaurants is not considered to
be a major component of the business.
Exercise 12-12 (LO12.5)
LeBron’s Bookstores
Income Statement
For the Year Ended December 31, 2015
Revenues $ 11,000,000
Cost of goods sold 6,500,000
Gross profit 4,500,000
Operating expenses 3,000,000
Income before tax 1,500,000
Income tax expense 375,000
Income from continuing operations 1,125,000
Discontinued operation:
Loss from disposal of book division, net of tax (675,000)
Net income $ 450,000
Exercise 12-13 (LO12.5)
Shaquille Corporation
Income Statement
For the Year Ended December 31, 2015
Income before tax $ 1,700,000
Income tax expense 425,000
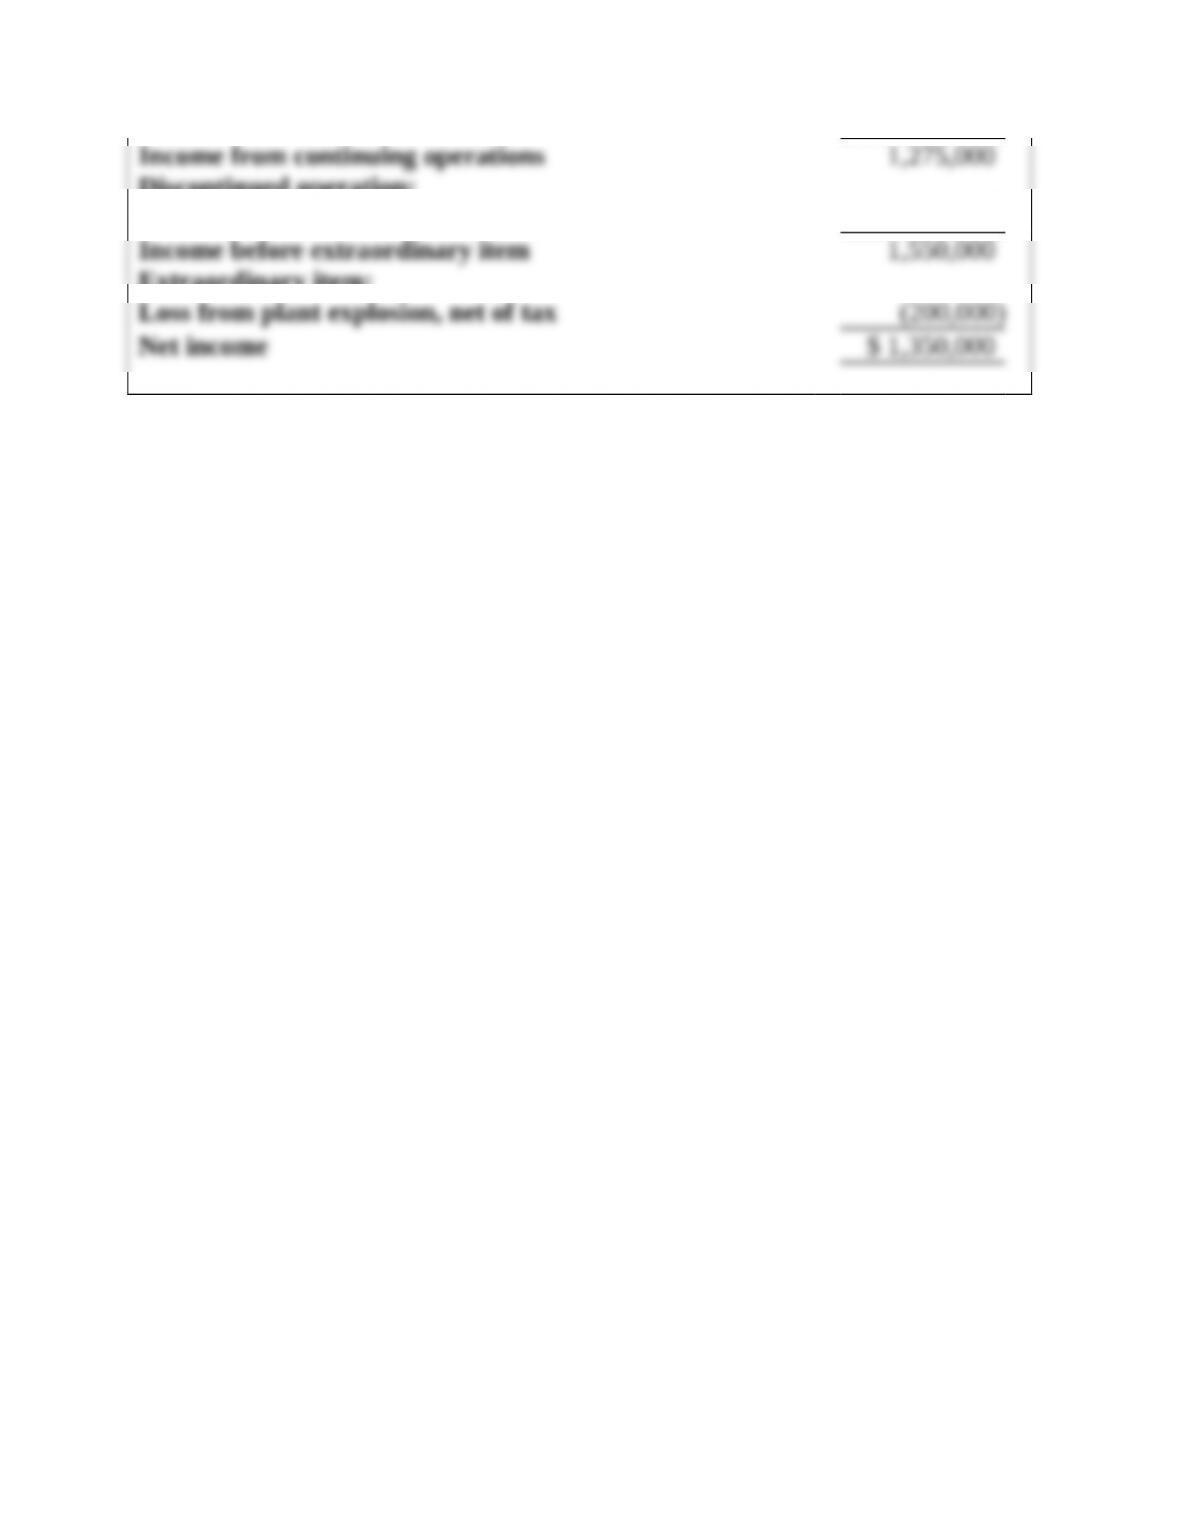
Discontinued operation:
Gain from disposal of operating segment, net of tax 275,000
Extraordinary item:
Exercise 12-14 (LO12.6)
a. Conservative (lower income, lower assets)
b. Aggressive (higher income, higher assets)
c. Conservative (lower income, lower assets)
d. Aggressive (higher income, lower liabilities)
Exercise 12-15 (LO12.6)
Requirement 1
(a) Aggressive
(b) Conservative
(c) Aggressive
(d) Aggressive
(e) Aggressive
Note: Changes resulting in higher revenues or lower expenses are considered
Requirement 2
The total e1ect is neutral because net income is the same before and a9er the
Problem 12-1A (LO12.1)
Requirement 1
Sports Emporium
Income Statements
For the Year Ended December 31, 2015
Sporting Goods Sports Apparel
Amount % Amount %
Net sales $1,800,000 100.0 $970,000 100.0
Cost of goods sold 1,040,000 57.8 440,000 45.4
Gross profit 760,000 42.2 530,000 54.6
Operating expenses 450,000 25.0 340,000 35.1
Requirement 2
Problems: Set A
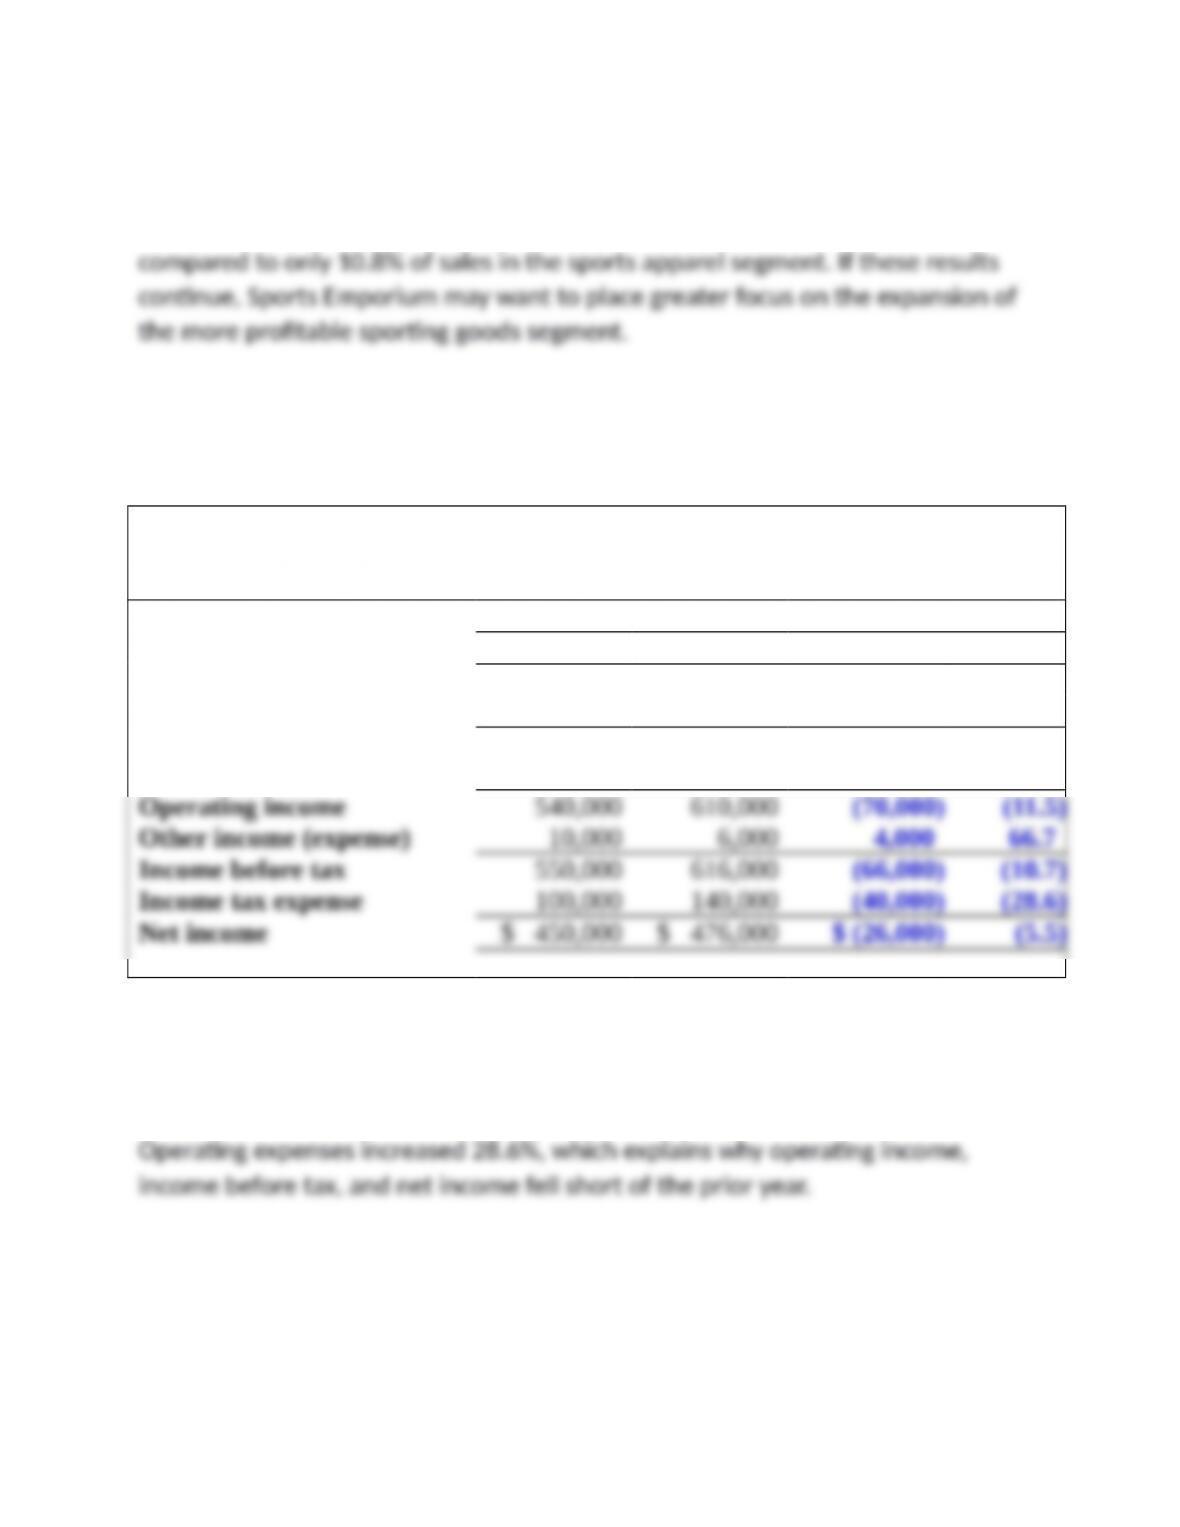
The sporting goods segment has a higher net income ($250,000) than the sports
apparel segment ($105,000). Vertical analysis further indicates the sporting goods
segment is more profitable since net income is 13.9% of sales in that segment
Problem 12-2A (LO12.2)
Requirement 1
Anything Tennis
Income Statements
For the Years Ended December 31
Increase (Decrease)
2015 2014 Amount %
Net sales $ 3,500,000 $ 2,620,000 $ 880,000 33.6
Cost of goods sold 2,150,000 1,380,000 770,000 55.8
Gross profit 1,350,000 1,240,000 110,000 8.9
Operating expenses 810,000 630,000 180,000 28.6
Requirement 2
Sales increased $880,000 (33.6%), but cost of goods sold increased $770,000
(55.8%), resulting in a gross profit just slightly higher than the prior year.
Problem 12-3A (LO12.1, 12.2)
Requirement 1
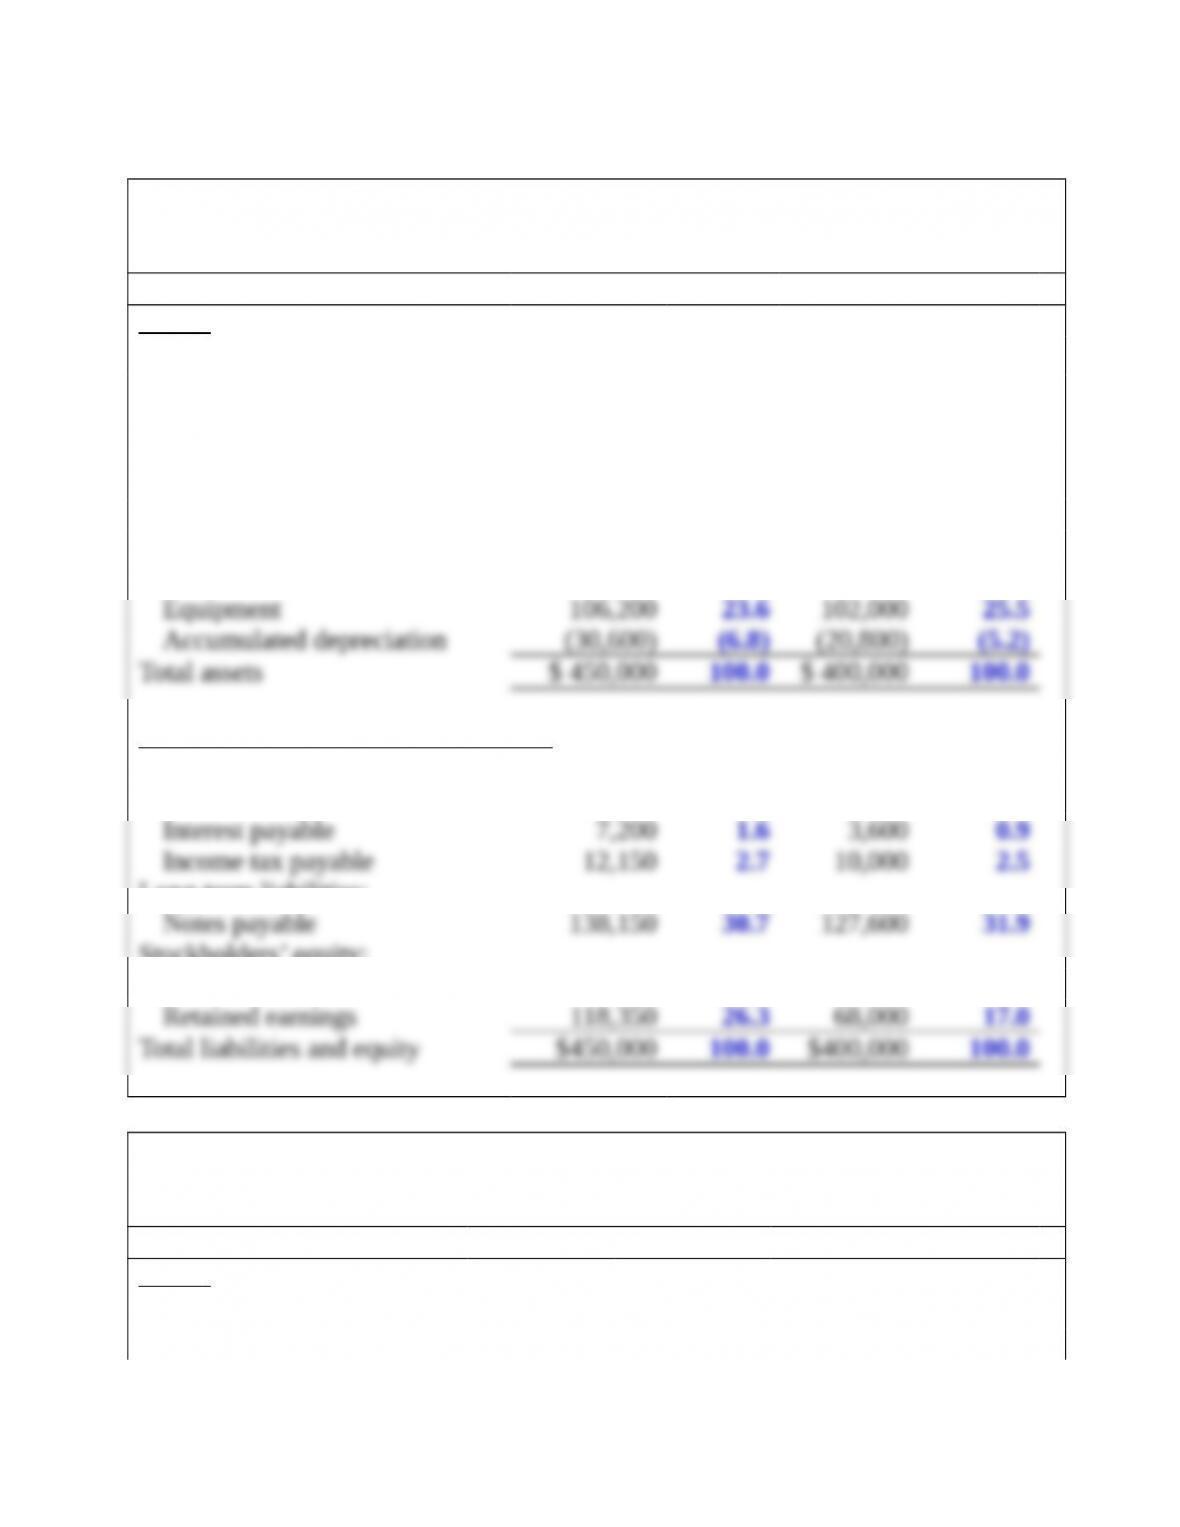
Sports Unlimited
Balance Sheet
December 31, 2015
2015 2014
Assets Amount % Amount %
Current assets:
Cash $ 103,500 23.0 $ 70,400 17.6
Accounts receivable 46,800 10.4 32,000 8.0
Inventory 44,550 9.9 71,200 17.8
Prepaid rent 7,200 1.6 3,600 0.9
Long-term assets:
Investment in bonds 54,900 12.2 00.0
Land 117,450 26.1 141,600 35.4
Liabilities and Stockholders’ Equity
Current liabilities:
Accounts payable $ 30,150 6.7 $ 46,800 11.7
Long-term liabilities:
Stockholders’ equity:
Common stock 144,000 32.0 144,000 36.0
Requirement 2
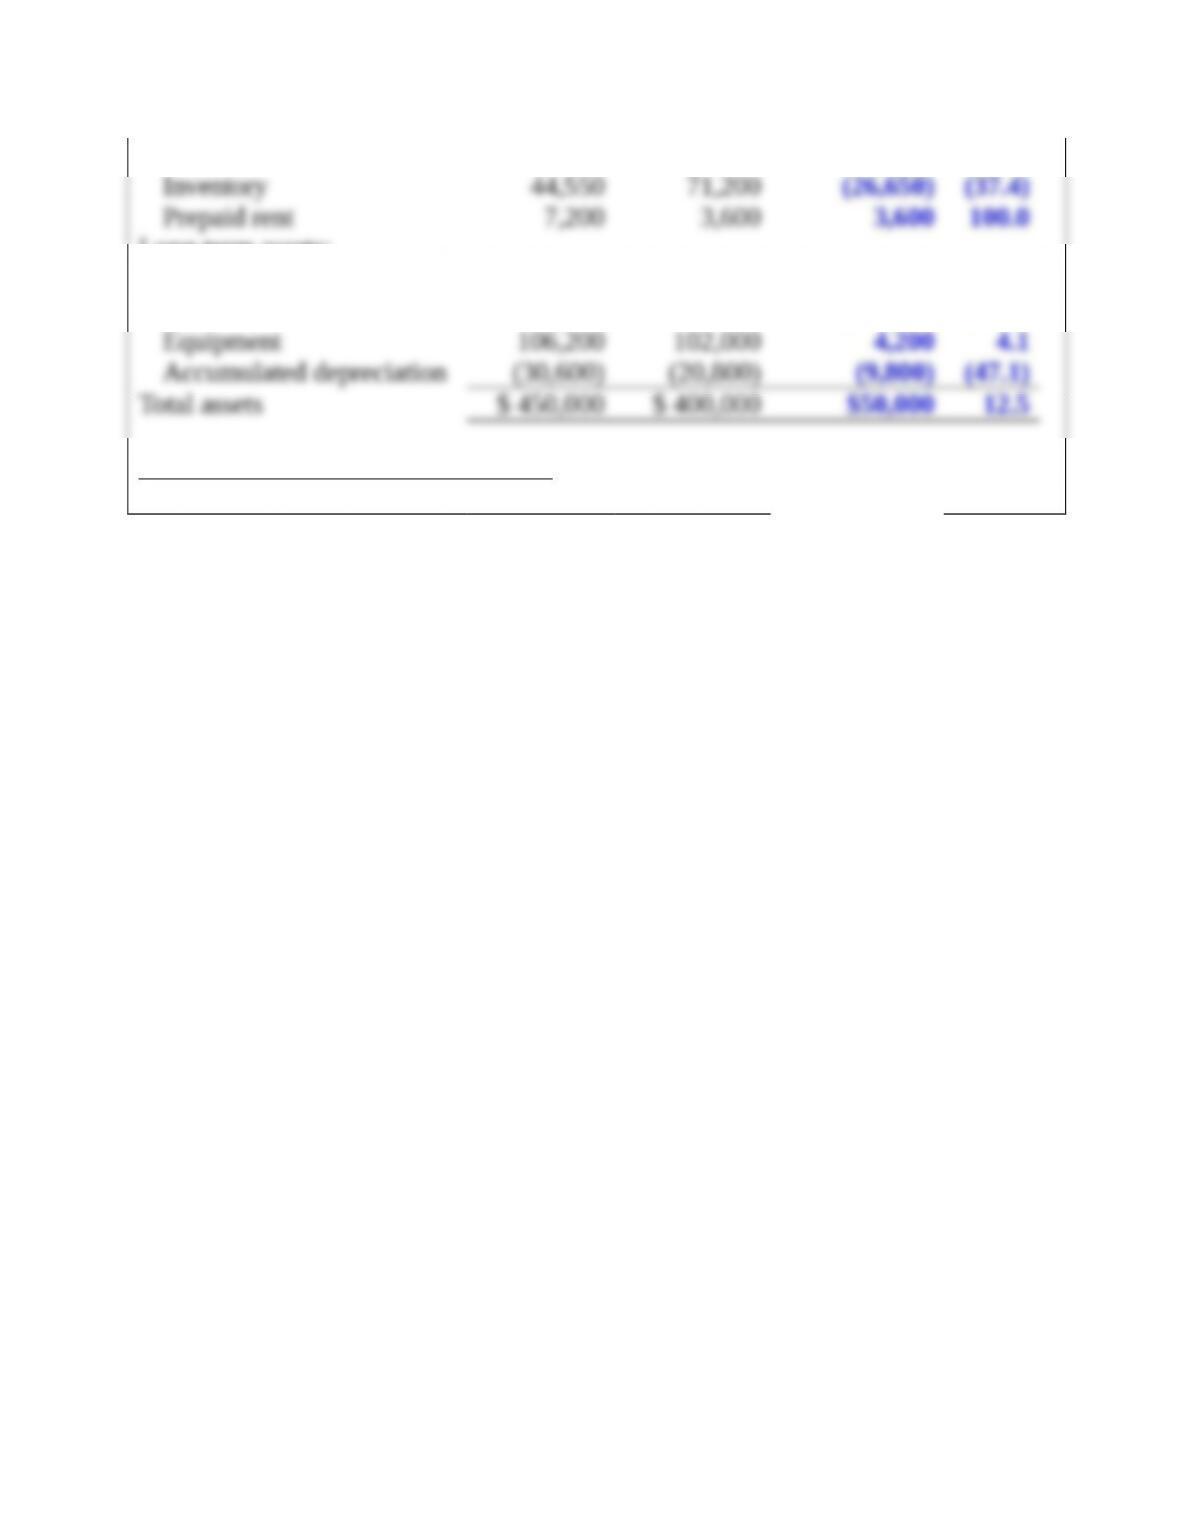
Sports Unlimited
Balance Sheet
December 31, 2015
Year Increase (Decrease)
Assets 2015 2014 Amount %
Current assets:
Cash $ 103,500 $ 70,400 $ 33,100 47.0
Accounts receivable 46,800 32,000 14,800 46.3
Long-term assets:
Investment in bonds 54,900 0 54,900 N/A
Land 117,450 141,600 (24,150) (17.1)
Liabilities and Stockholders’ Equity
Current liabilities: