Question 12-1 (LO 12.1, 12.2)
The three types of comparisons commonly used in financial statement analysis are
Question 12-2 (LO 12.1, 12.2)
For vertical analysis, we express each item as a percentage of the same base amount, such
as a percentage of sales in the income statement or as a percentage of total assets in the
Question 12-3 (LO 12.1)
Sales are commonly used as a base amount for income statement accounts. Total assets are
Question 12-4 (LO 12.1)
The company that has most of its equity balance in retained earnings is likely an older and
Question 12-5 (LO 12.2)
If the dollar amount of the change is small, it may not be all that important even if the
Question 12-6 (LO 12.3)
We measure income statement accounts over a period of time (like a video), while we
measure balance sheet accounts at a point in time (like a photograph). Therefore, ratios that
Question 12-7 (LO 12.3)
Liquidity refers to a company’s ability to pay its current liabilities. The accounts used to
Question 12-8 (LO 12.3)
Chapter 12
Financial Statement AnalysisREVIEW Questions
(a) Receivable turnover ratio and average collection period.
(b) Inventory turnover ratio and average days in inventory.
(c) Times interest earned ratio
Question 12-9 (LO 12.3)
(a) Good news.
(b) Bad news.
(c) Good news.
(d) Bad news.
Question 12-10 (LO 12.3)
A $100,000 purchase of inventory on account will increase current assets and current
Question 12-11 (LO 12.4)
(a) Return on assets.
(b) Profit margin.
(c) Asset turnover.
Question 12-12 (LO 12.4)
(a) Good news.
(b) Bad news.
(c) Bad news.
(d) Good news.
Question 12-13 (LO 12.4)
The return on assets and the return on equity differ due to financial leverage – the amount of
debt each company carries. If a company earns a return on investment above the interest cost of
Question 12-14 (LO 12.5)
Earnings persistence is the ability of current earnings to continue or persist into future years.
Certain items are part of net income in the current year but are not expected to persist. We refer
Question 12-15 (LO 12.6)
The trend in earnings per share is favorable. Companies report extraordinary items separately
near the bottom of the income statement to allow investors to see that these are one-time items
Question 12-16 (LO 12.6)
Conservative accounting practices are those that result in reporting lower income, lower
Question 12-17 (LO 12.6)
A larger estimation of the allowance for uncollectible accounts, the write-down of overvalued
inventory, the use of a shorter useful life for depreciation, and the recording of a contingent
Question 12-18 (LO 12.6)
A lower estimation of the allowance for uncollectible accounts, waiting to report an inventory
write-down, choosing a longer useful life for depreciation, and waiting to record a litigation loss
Question 12-19 (LO 12.6)
All of these adjustments are conservative resulting in a lower reported net income.
Question 12-20 (LO 12.6)
All of the changes proposed near the end of the chapter improve the income statement and
the balance sheet, but have no effect on cash flows. They include reducing the estimate of bad
BRIEF Exercises
Brief Exercise 12-1 (LO 12.1)
2015 2014
Amount % Amount %
Cash $ 420,000 7.0 $ 1,050,000 21.0
Accounts receivable 660,000 11.0 300,000 6.0
Inventory 1,020,000 17.0 925,000 18.5
Brief Exercise 12-2 (LO 12.2)
Year Increase (Decrease)
2015 2014 Amount %
Cash $ 420,000 $ 1,050,000 $ (630,000) (60.0)
Accounts receivable 660,000 300,000 360,000 120.0
Inventory 1,020,000 925,000 95,000 10.3
Brief Exercise 12-3 (LO 12.1)
Athletic World’s income before tax as a percentage of sales increased. Income
If net income as a percentage of sales increases, that does not mean that net income
also increases. For example, if sales decrease 10% and net income decreases 5%,
Brief Exercise 12-4 (LO 12.2)
Percentage change from 2014 to 2015 = 3.9% increase
Brief Exercise 12-5 (LO 12.2)
$1,150,000 = 1.15 x Sales in 2015
Brief Exercise 12-6 (LO 12.3)
Receivables turnover ratio $750,000
Brief Exercise 12-7 (LO12.3)
Inventory turnover ratio $500,000*
*$750,000 sales minus $250,000 gross profit = $500,000 COGS
Brief Exercise 12-8 (LO12.3)
COGS must equal $980,000 to complete the inventory turnover ratio.
Inventory turnover ratio COGS
Given sales of $1,140,000 and calculating COGS of $980,000, gross pro&t is
$160,000.
Sales $1,140,000
– Cost of goods sold 980,000
Brief Exercise 12-9 (LO12.3)
Current ratio before purchase of inventory
$3,430,000
Current ratio after $900,000 cash purchase of inventory
$3,430,000 + $900,000 inventory − $900,000 cash
Current ratio after $900,000 purchase of inventory on account
$3,430,000 + $900,000 inventory
Brief Exercise 12-10 (LO12.4)
Return on assets $15
Profit margin $15
Asset turnover $130
Brief Exercise 12-11 (LO12.4)
Return on assets $130,000
Return on equity $130,000
Brief Exercise 12-12 (LO12.5)
Income from continuing operations $32,000,000

Discontinued operation:
Loss from sale of the career counseling division, net of tax (7,500,000)
Brief Exercise 12-13 (LO12.5)
1. Other expenses
2. Extraordinary items
3. Discontinued operations
Brief Exercise 12-14 (LO12.6)
1. Conservative
2. Aggressive
3. Aggressive
Brief Exercise 12-15 (LO12.6)
1. Conservative
2. Conservative
3. Conservative
Exercise 12-1 (LO12.1, 12.2, 12.3, 12.4, 12.5, 12.6)
Items
g1. Vertical analysis
e2. Horizontal analysis
a3. Liquidity
h4. Solvency
f5. Discontinued operation
c6. Extraordinary item
d7. Quality of earnings
b8. Conservative accounting practices
Descriptions
a. A company’s ability to pay its current liabilities.
Exercises
b. Accounting choices that result in reporting lower income, lower assets, and
c. A profit or loss unusual in nature and infrequent in occurrence.
d. The ability of reported earnings to reflect the company’s true earnings as
e. A tool to analyze trends in financial statement data for a single company
f. The sale or disposal of a significant component of a company’s operations.
g. A means to express each item in a financial statement as a percentage of a
h. A company’s ability to pay its long-term liabilities.
Exercise 12-2 (LO12.1)
Federer Sports Apparel
Income Statement
For the Years Ended December 31
2016 2015
Amount % Amount %
Net sales $ 18,800,000 100.0 $ 15,500,000 100.0
Cost of goods sold 13,200,000 70.2 7,000,000 45.2
Gross profit 5,600,000 29.8 8,500,000 54.8
Operating expenses 1,600,000 8.5 1,200,000 7.7
Depreciation expense 1,000,000 5.3 1,000,000 6.5
Exercise 12-3 (LO12.2)
Federer Sports Apparel
Income Statement
For the Years Ended December 31
Year Increase (Decrease)
2016 2015 Amount %
Revenues $ 18,800,000 $ 15,500,000 $3,300,000 21.3
Cost of goods sold 13,200,000 7,000,000 6,200,000 88.6
Gross profit 5,600,000 8,500,000 (2,900,000) (34.1)
Operating expenses 1,600,000 1,200,000 400,000 33.3
Depreciation expense 1,000,000 1,000,000 0 0
Exercise 12-4 (LO12.1, 12.2)
Requirement 1
Federer Sports Apparel
Balance Sheet
December 31
2016 2015
Assets Amount % Amount %
Cash $ 2,300,000 14.7 $ 800,000 5.8
Accounts receivable 1,500,000 9.6 1,200,000 8.8
Inventory 2,800,000 18.0 1,700,000 12.4
Accounts payable $ 1,450,000 9.3 $ 1,700,000 12.4
Litigation liability 1,500,000 9.6 00.0
Requirement 2
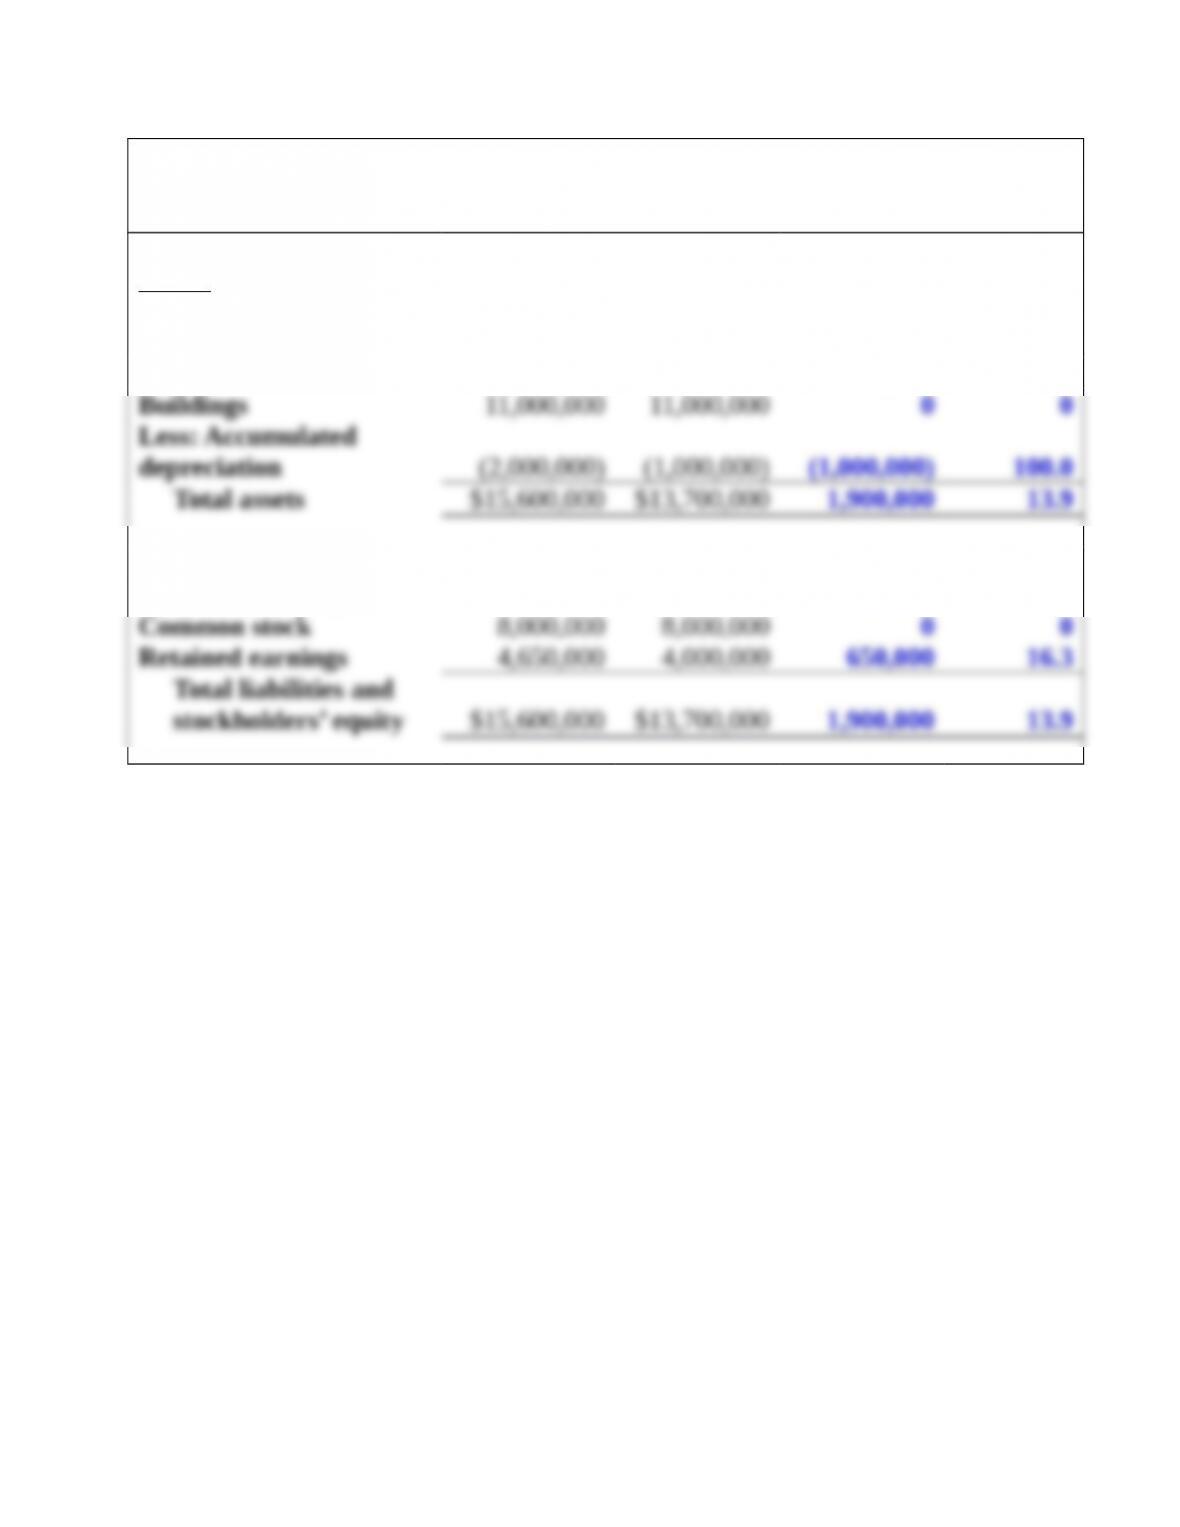
Federer Sports Apparel
Balance Sheet
December 31
Year Increase (Decrease)
Assets 2016 2015 Amount %
Cash $ 2,300,000 $ 800,000 $1,500,000 187.5
Accounts receivable 1,500,000 1,200,000 300,000 25.0
Inventory 2,800,000 1,700,000 1,100,000 64.7
Accounts payable $ 1,450,000 $ 1,700,000 (250,000) (14.7)
Litigation liability 1,500,000 0 1,500,000 N/A