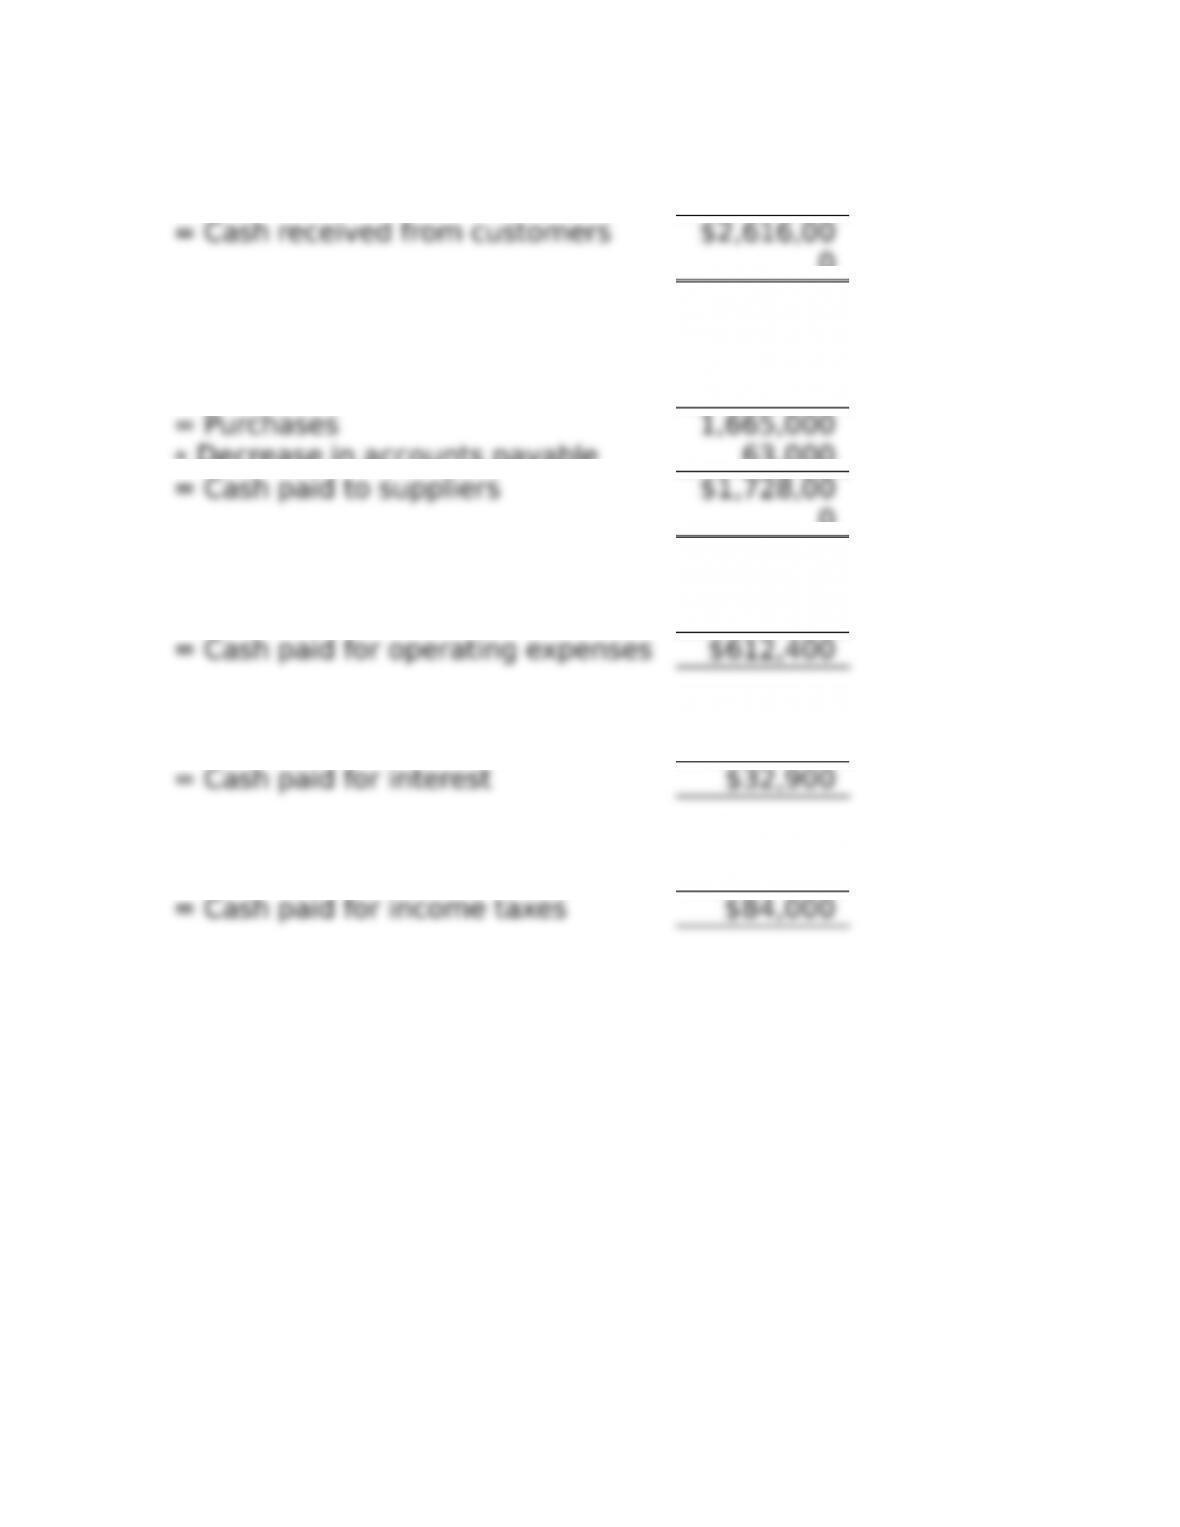
Net sales $2,600,00
0
+ Decrease in accounts receivable 16,000
0
Cost of goods sold $1,650,00
0
+ Increase in inventory 15,000
+ Decrease in accounts payable 63,000
0
Operating expenses $615,000
− Decrease in prepaid rent (2,600)
Interest expense $34,000
− Increase in interest payable (1,100)
Income tax expense $80,000
+ Decrease in income tax payable 4,000
*Problem 11-8B (LO 11-2, 11-5)
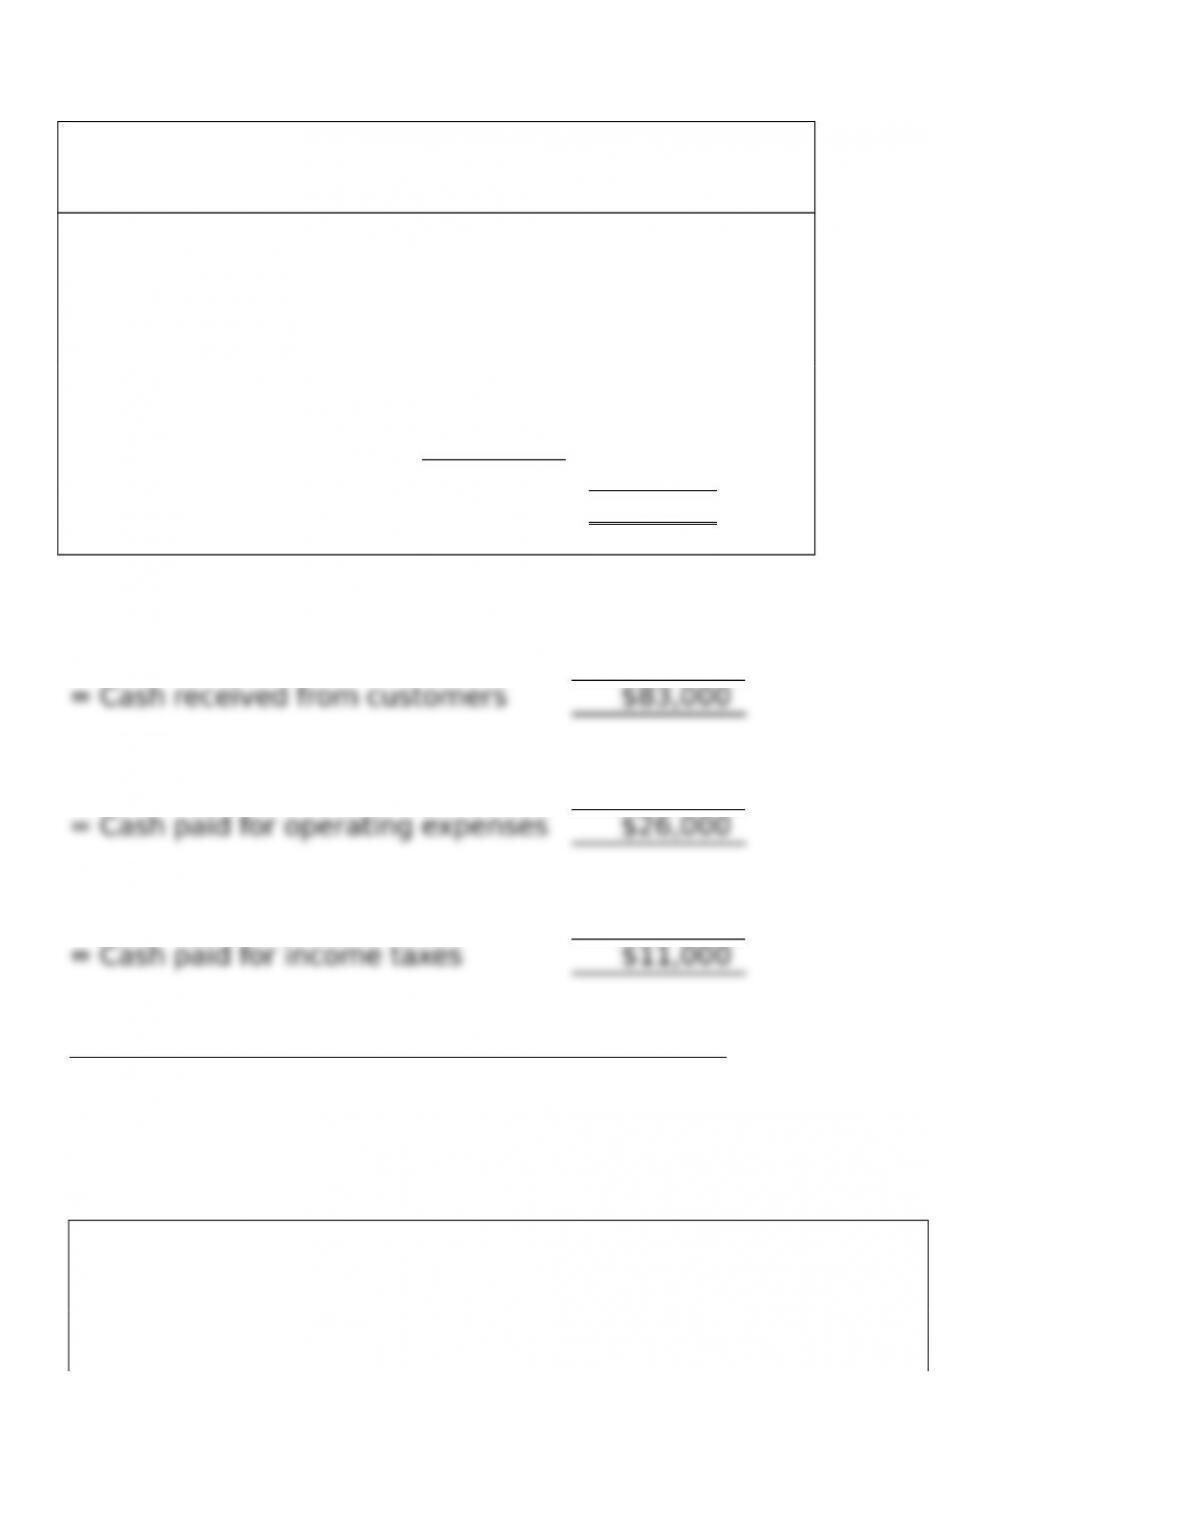
Electronic Transformations
Income Statement
For the Year Ended December 31, 2015
Net sales $96,00
0
Expenses:
Operating expenses $34,000
Depreciation expense 9,000
Income tax expense 17,000
Total expenses 60,000
Net Income $ 36,000
Net sales $96,000
− Increase in accounts receivable (13,000)
Operating expenses $34,000
− Increase in accounts payable (8,000)
Income tax expense $17,000
− Increase in income tax payable (6,000)
Great Adventures, Inc.
Statement of Cash Flows
For the Year Ended December 31, 2017
Cash Flows from Operating Activities
ADDITIONAL PERSPECTIVES
Continuing Problem: Great Adventures
AP11-1
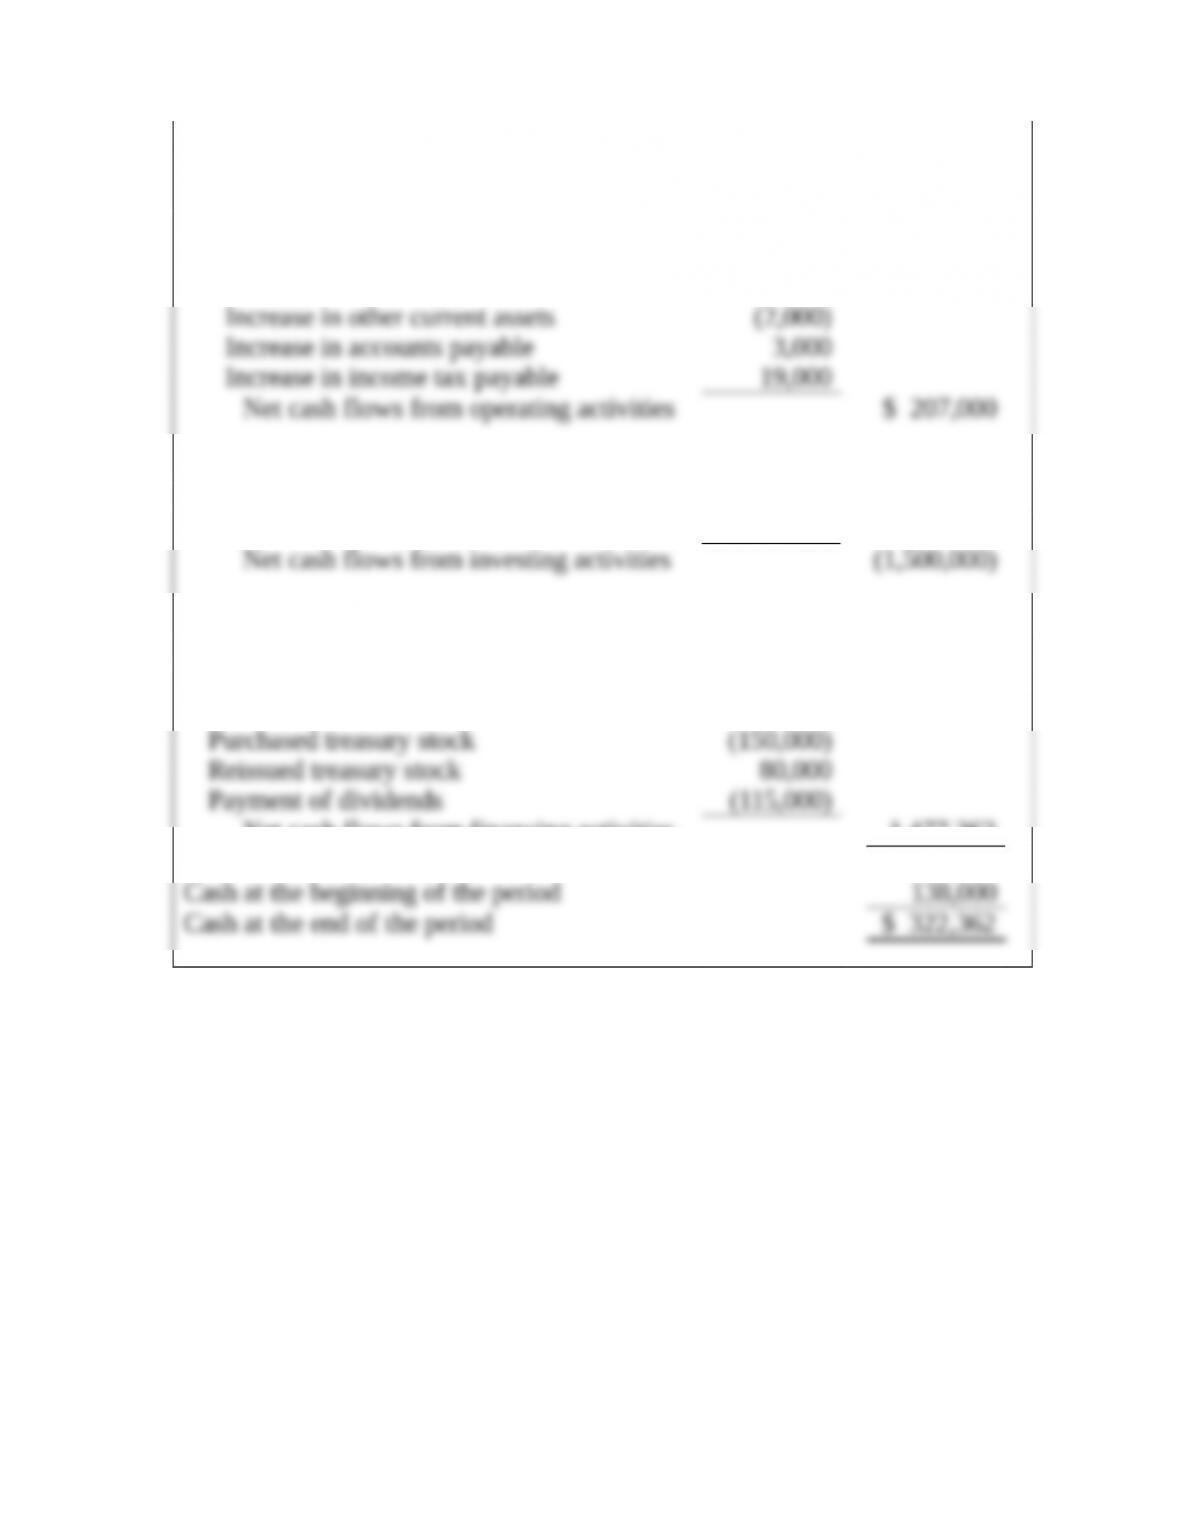
Net income $ 150,000
Adjustments to reconcile net income to net
cash flows from operating activities:
Depreciation expense 50,000
Increase in accounts receivable (10,000)
Increase in inventory (3,000)
Cash Flows from Investing Activities
Purchase of land (500,000)
Purchase of buildings (1,000,000)
Cash Flows from Financing Activities
Issued note payable 500,000
Repayment of notes payable (37,638)
Issued common stock 1,200,000
Net cash flows from financing activities 1,477,362
Net increase (decrease) in cash 184,362
Financial Analysis: American Eagle
AP11-2
1. $210,426,000 decrease ($210,426 in thousands).
2. $499,671,000 ($499,671 in thousands). Net cash from operating activities increased
from 2012 to 2013, but decreased from 2011 and 2012. The largest reconciling item
3. $190,650,000 ($190,650 in thousands). Net cash from investing activities is
negative for the years ended February 3, 2013 and January 28, 2012, but positive
4. $494,555,000 ($494,555 in thousands). While negative operating activities is a bad
sign, negative financing activities can be a positive sign. The largest financing
Financial Analysis: Buckle
AP11-3
1. $48,903,000 decrease ($48,903 in thousands).
2. $220,941,000 ($220,941 in thousands). Net cash from operating activities is
increasing each year from $179,935,000 in 2011 to $209,273,000 in 2012 to
3. $21,666,000 ($21,666 in thousands). Net cash from investing activities is negative
4. $248,178,000 ($248,178 in thousands). While negative operating activities is a bad
sign, negative financing activities can be a positive sign. The largest financing
Comparative Analysis: American Eagle vs. Buckle
AP11-4
1.
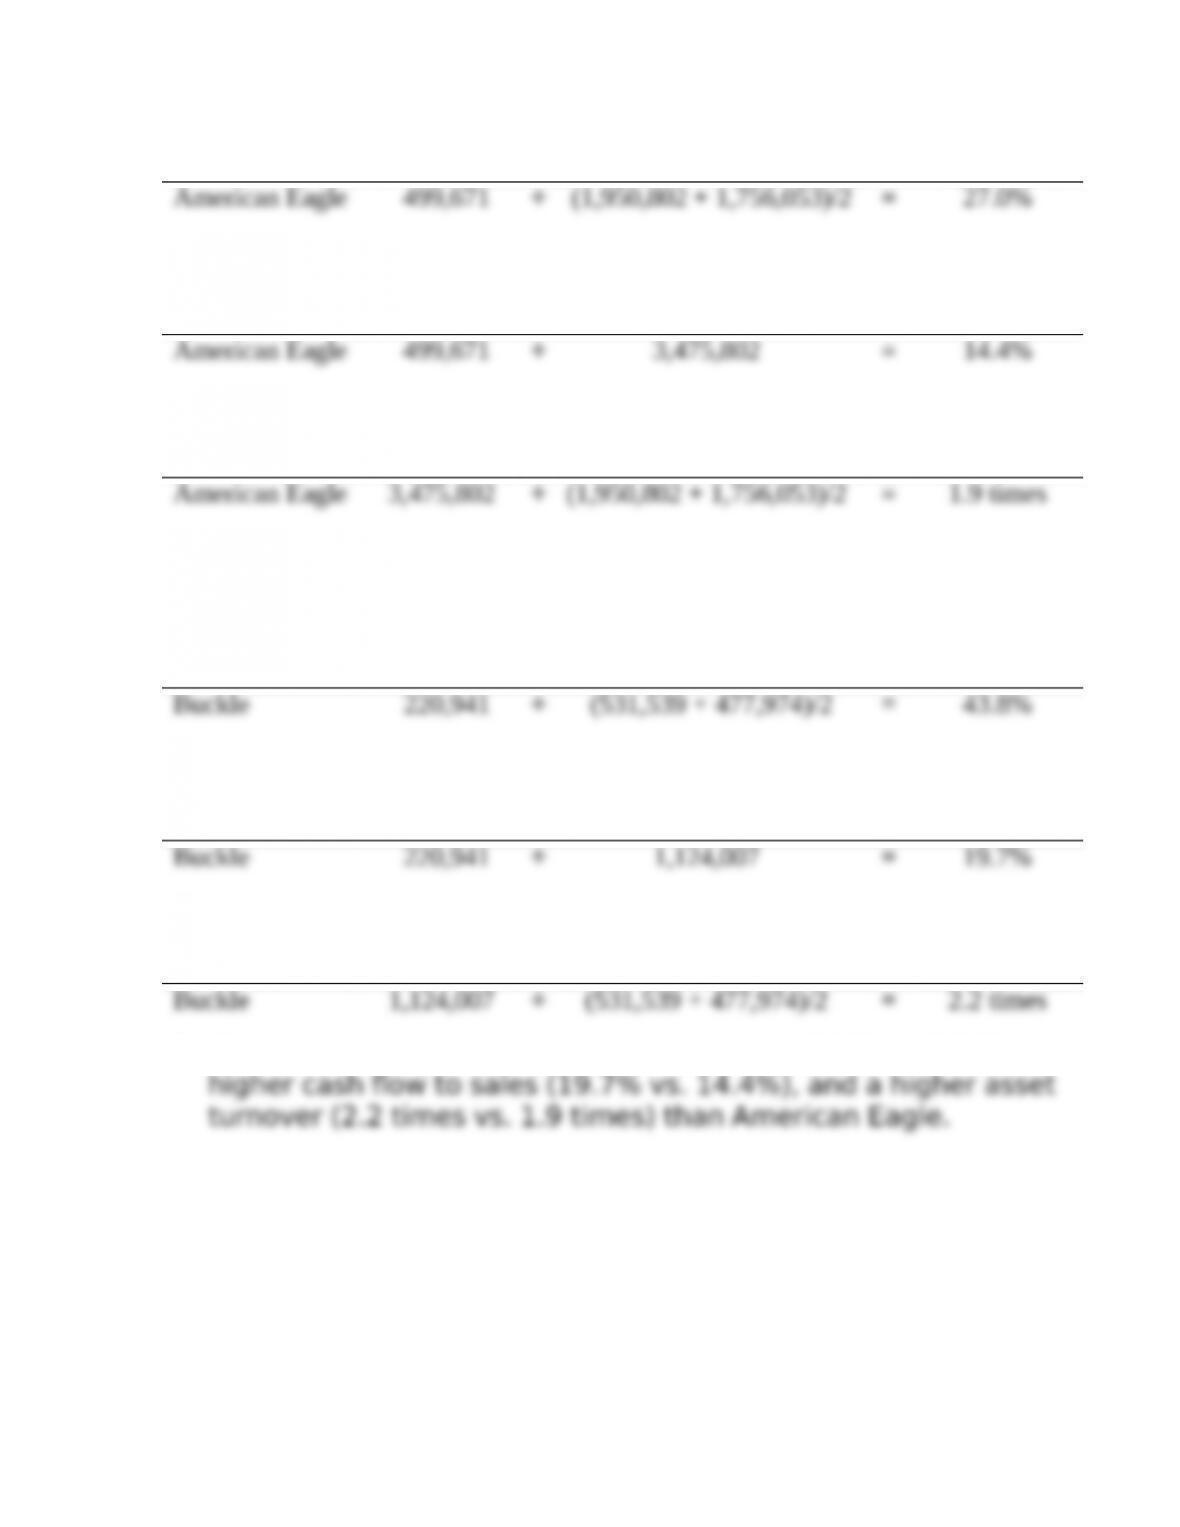
($ in thousands)
Operating
Cash Flow ÷
Average
Total Assets =
Cash Return
on Assets
($ in thousands)
Operating
Cash Flow ÷ Sales =
Cash Flow
to Sales
($ in thousands) Sales ÷
Average
Total Assets =
Asset
Turnover
($ in thousands)
Operating
Cash Flow ÷
Average
Total Assets =
Cash Return
on Assets
($ in thousands)
Operating
Cash Flow ÷ Sales =
Cash Flow
to Sales
($ in thousands) Sales ÷
Average
Total Assets =
Asset
Turnover
2.
3. Buckle has a higher cash return on assets (43.8% vs. 27.0%), a
Ethics
AP11-5
Requirement 1
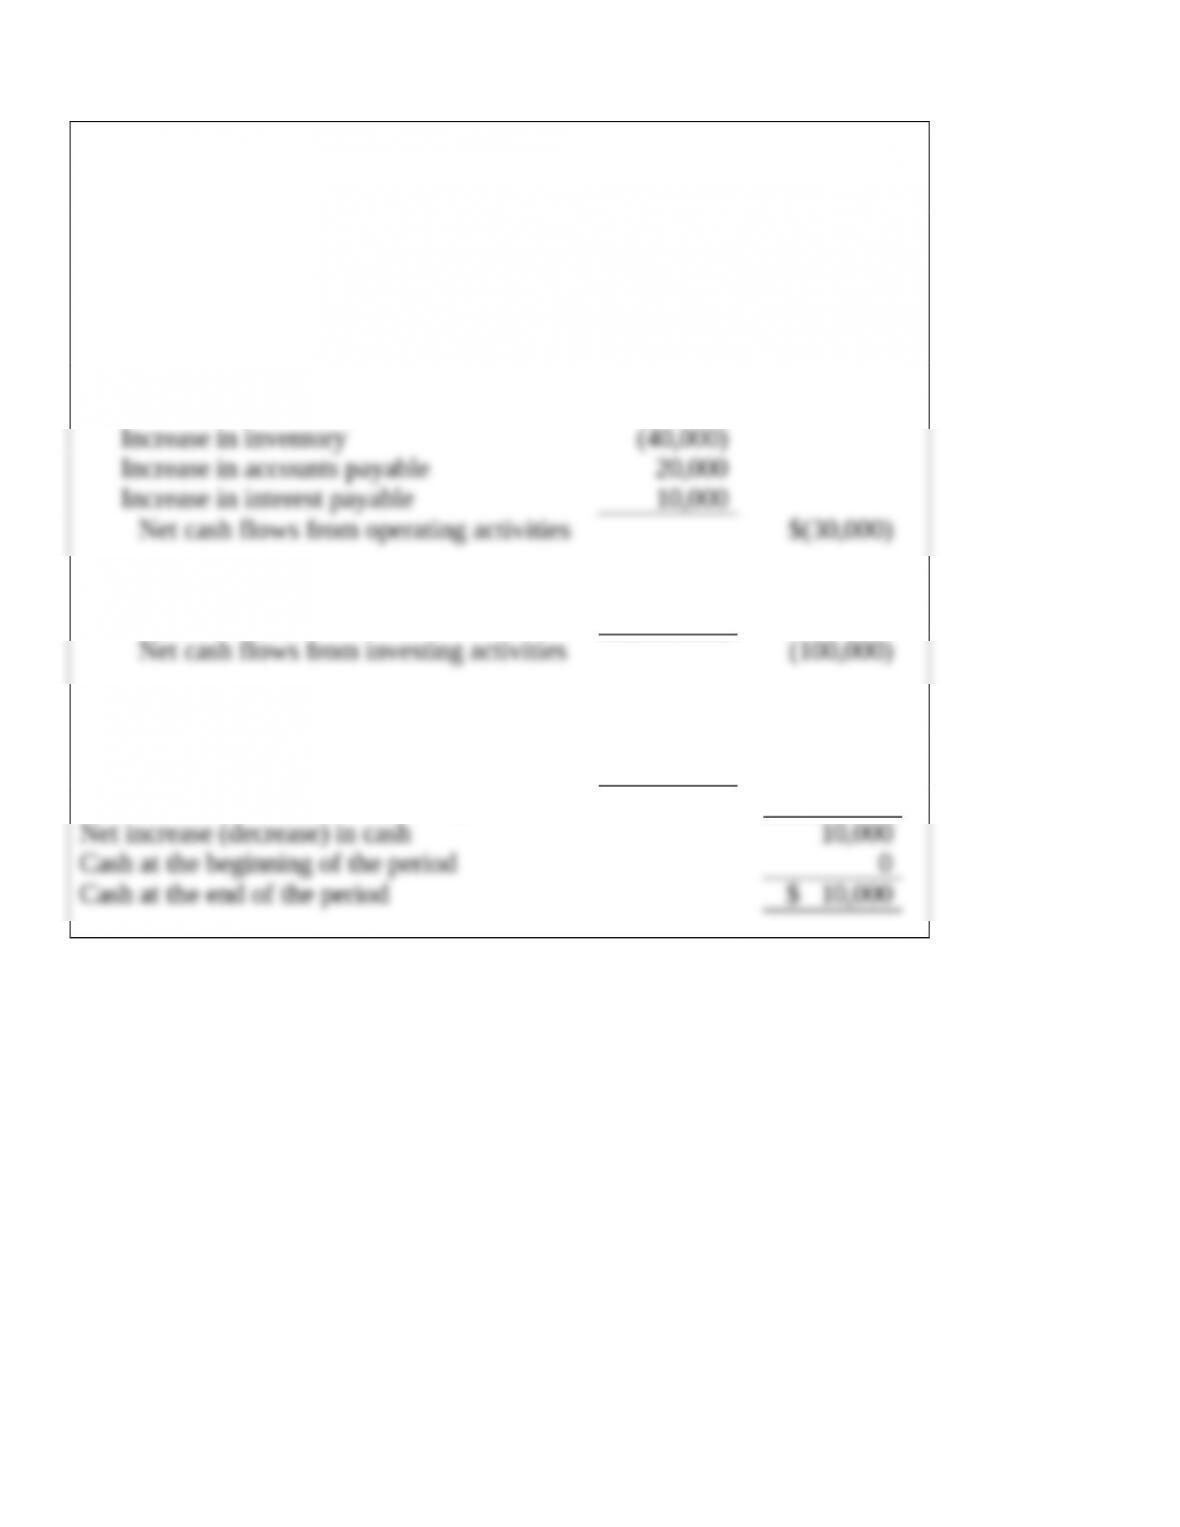
Aggressive Corporation
Statement of Cash Flows
For the Year Ended December 31, 2015
Cash Flows from Operating Activities
Net income $ 30,000
Adjustments to reconcile net income to net
cash flows from operating activities:
Depreciation expense 10,000
Increase in accounts receivable (60,000)
Cash Flows from Investing Activities
Purchase of equipment (100,000)
Cash Flows from Financing Activities
Issuance of note payable 100,000
Issuance of common stock 40,000
Net cash flows from financing activities 140,000
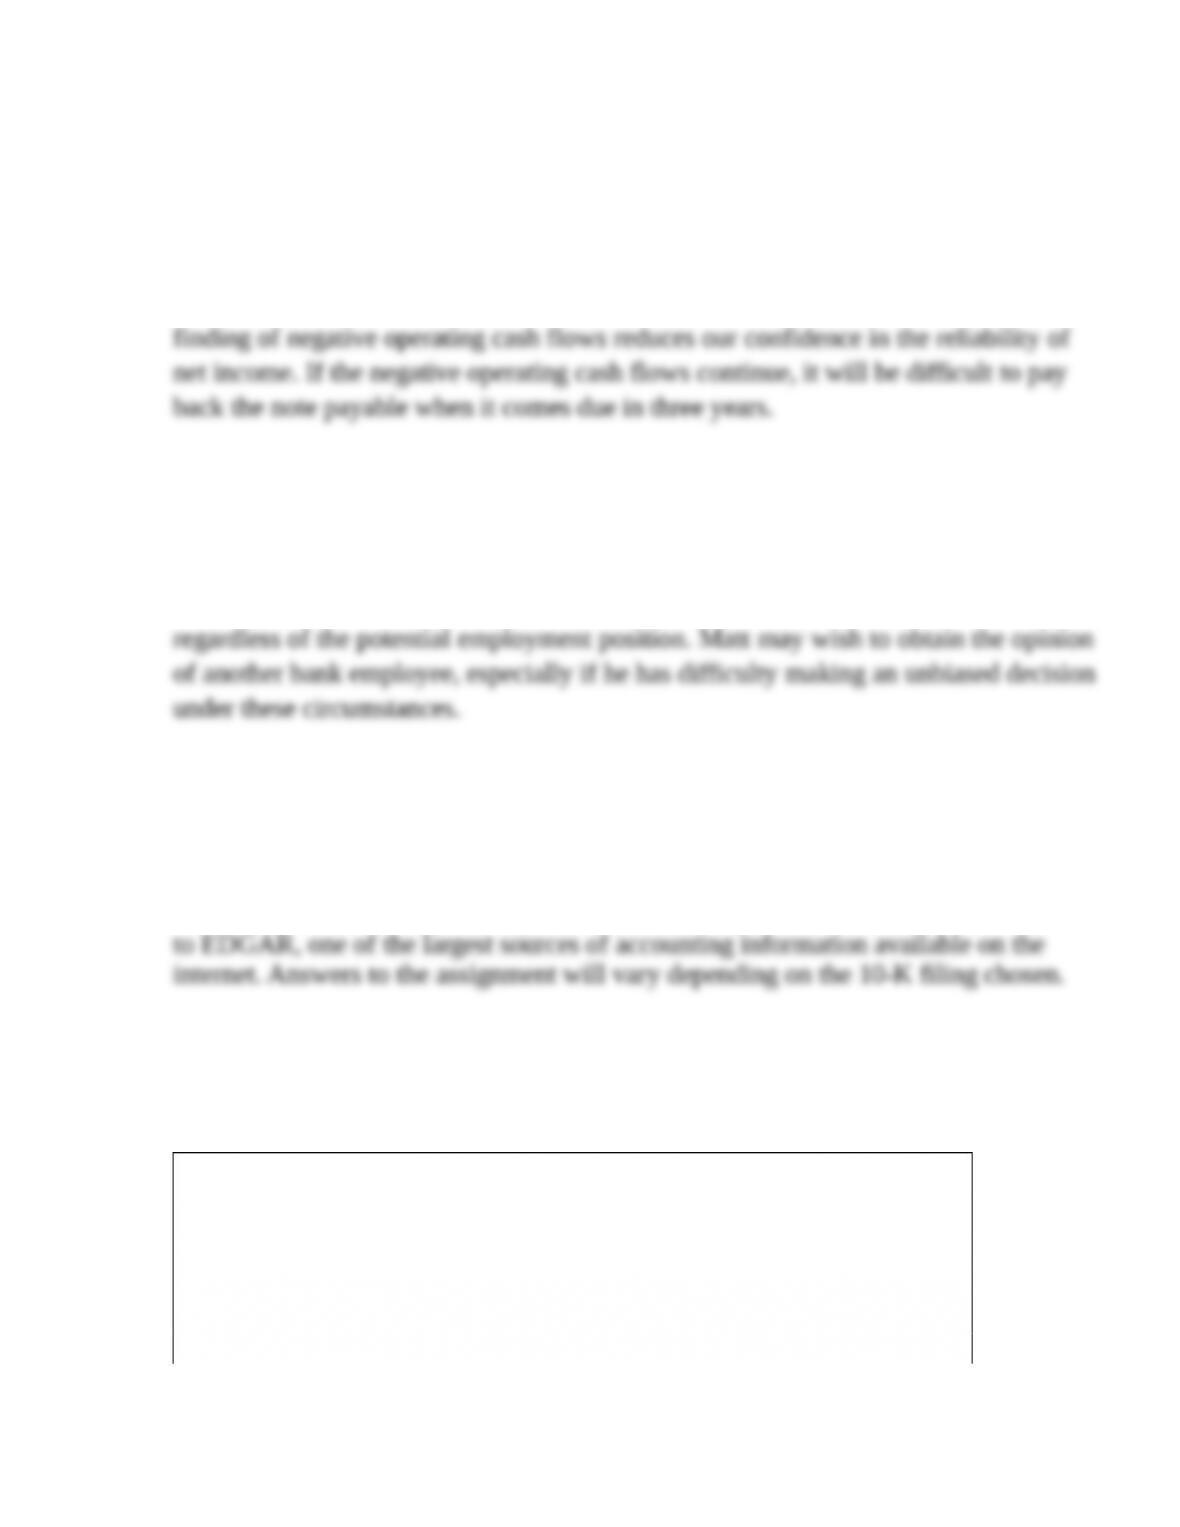
Polar Opposites
Statement of Cash Flows
For the Year Ended December 31, 2015
($ in millions)
Cash Flows from Operating Activities
Net income $ 5
Adjustments to reconcile net income to net cash
Requirement 2
While the company is reporting a positive net income of $30,000, the company has
negative operating cash flows of $30,000 this year. This is largely due to the large
increases in accounts receivable and inventory that reduce operating cash flows. The
Requirement 3
Larry likely mentioned the potential employment position as it could influence Matt’s
decision regarding the approval of the $50,000 loan increase. It is important that Matt
consider the loan application from the perspective of what is best for the bank,
Internet Research
AP11-6
This case provides an opportunity for students to learn more about Form 10-K,
containing the annual report for publicly traded companies. It also introduces students
Written Communication
AP11-7
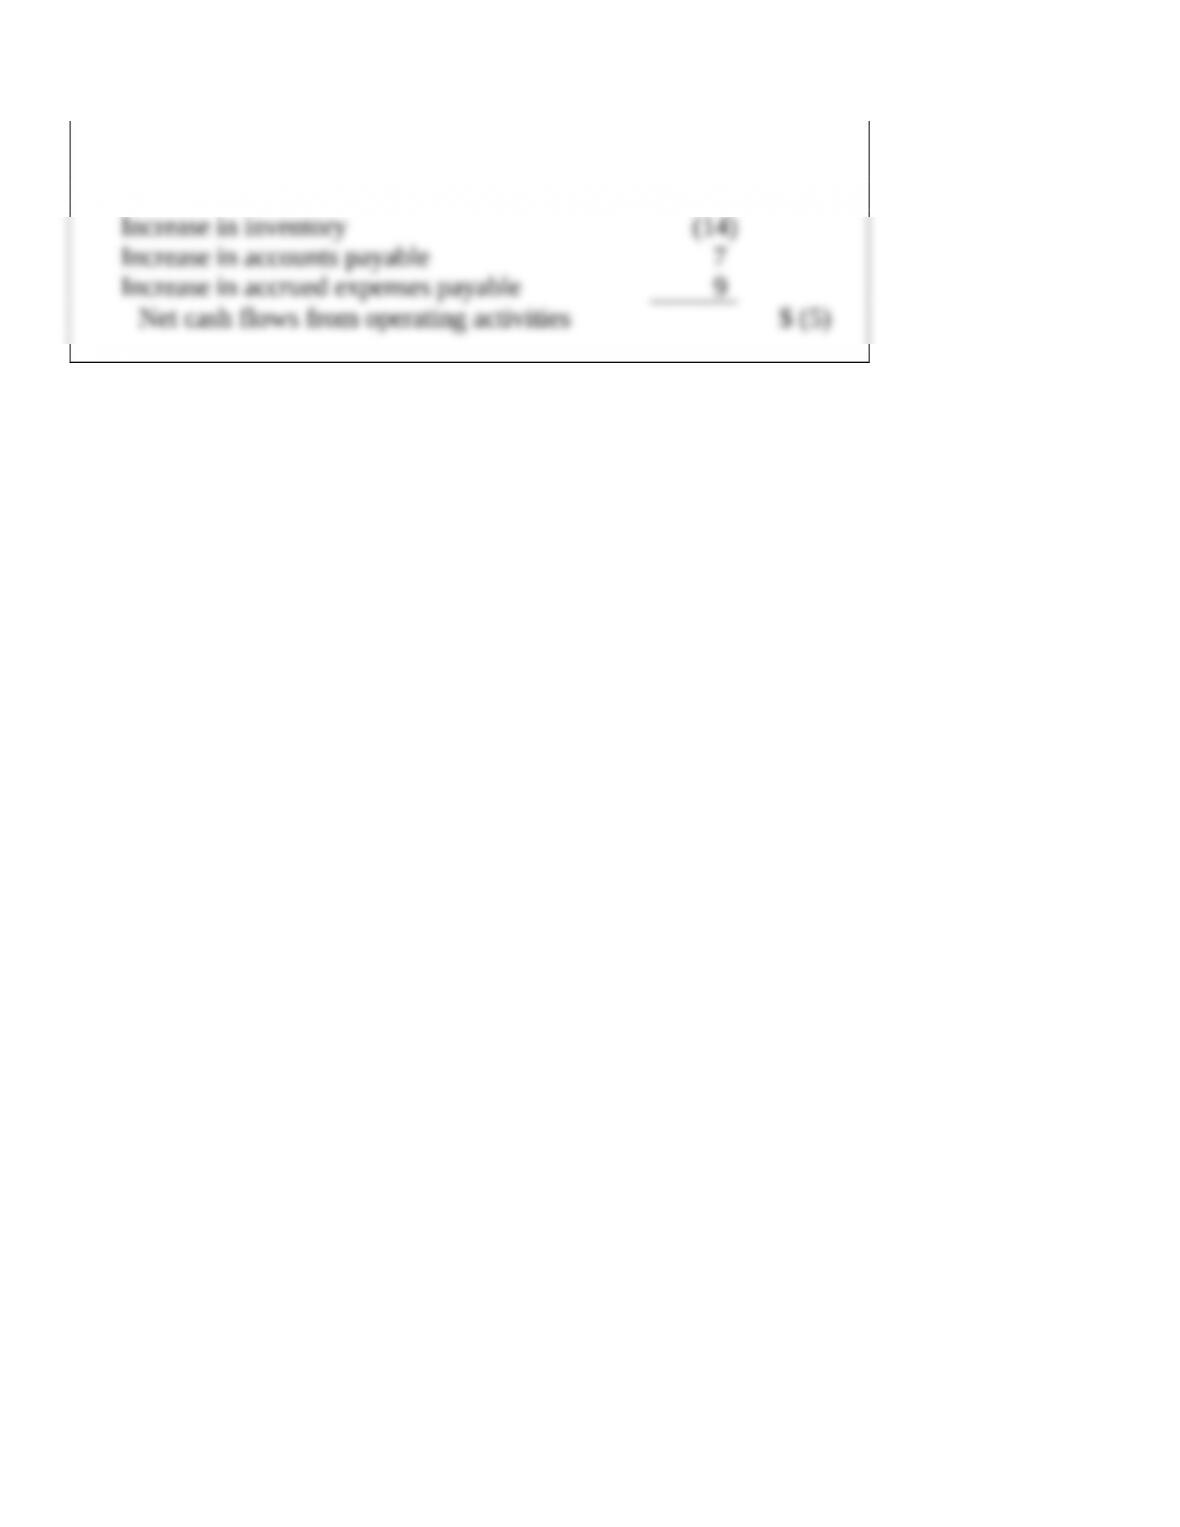
flows from operating activities:
Depreciation expense 4
Increase in accounts receivable (16)
As the operating activities section under the indirect method indicates, net income is
$5 million, yet cash flow from operating activities is a negative $5 million. This is
Earnings Management
AP11-8
Requirement 1
The increase in accounts receivable is likely caused by the company’s more relaxed
An increase in accounts receivable affects net income differently than operating cash
flows. An increase in accounts receivable is related to an increase in sales revenue
which increases net income. However, an increase in accounts receivable has a
Requirement 2
Salary arrangements for officers that are tied to reported net income might increase the
risk of earnings management. For instance, the CEO and CFO may have an incentive
Requirement 3
The positive trend in operating income, the negative trend in cash flows from
First, the large increase in accounts receivable can help explain the difference in trends
between operating income and cash flows from operations. An increase in credit sales
The second event provides the motive. Several of the company’s salary arrangements,
Requirement 4At the minimum, Bryan needs to be alert to the increased risk of
accounting fraud. He should carefully examine accounts receivable. Is the allowance