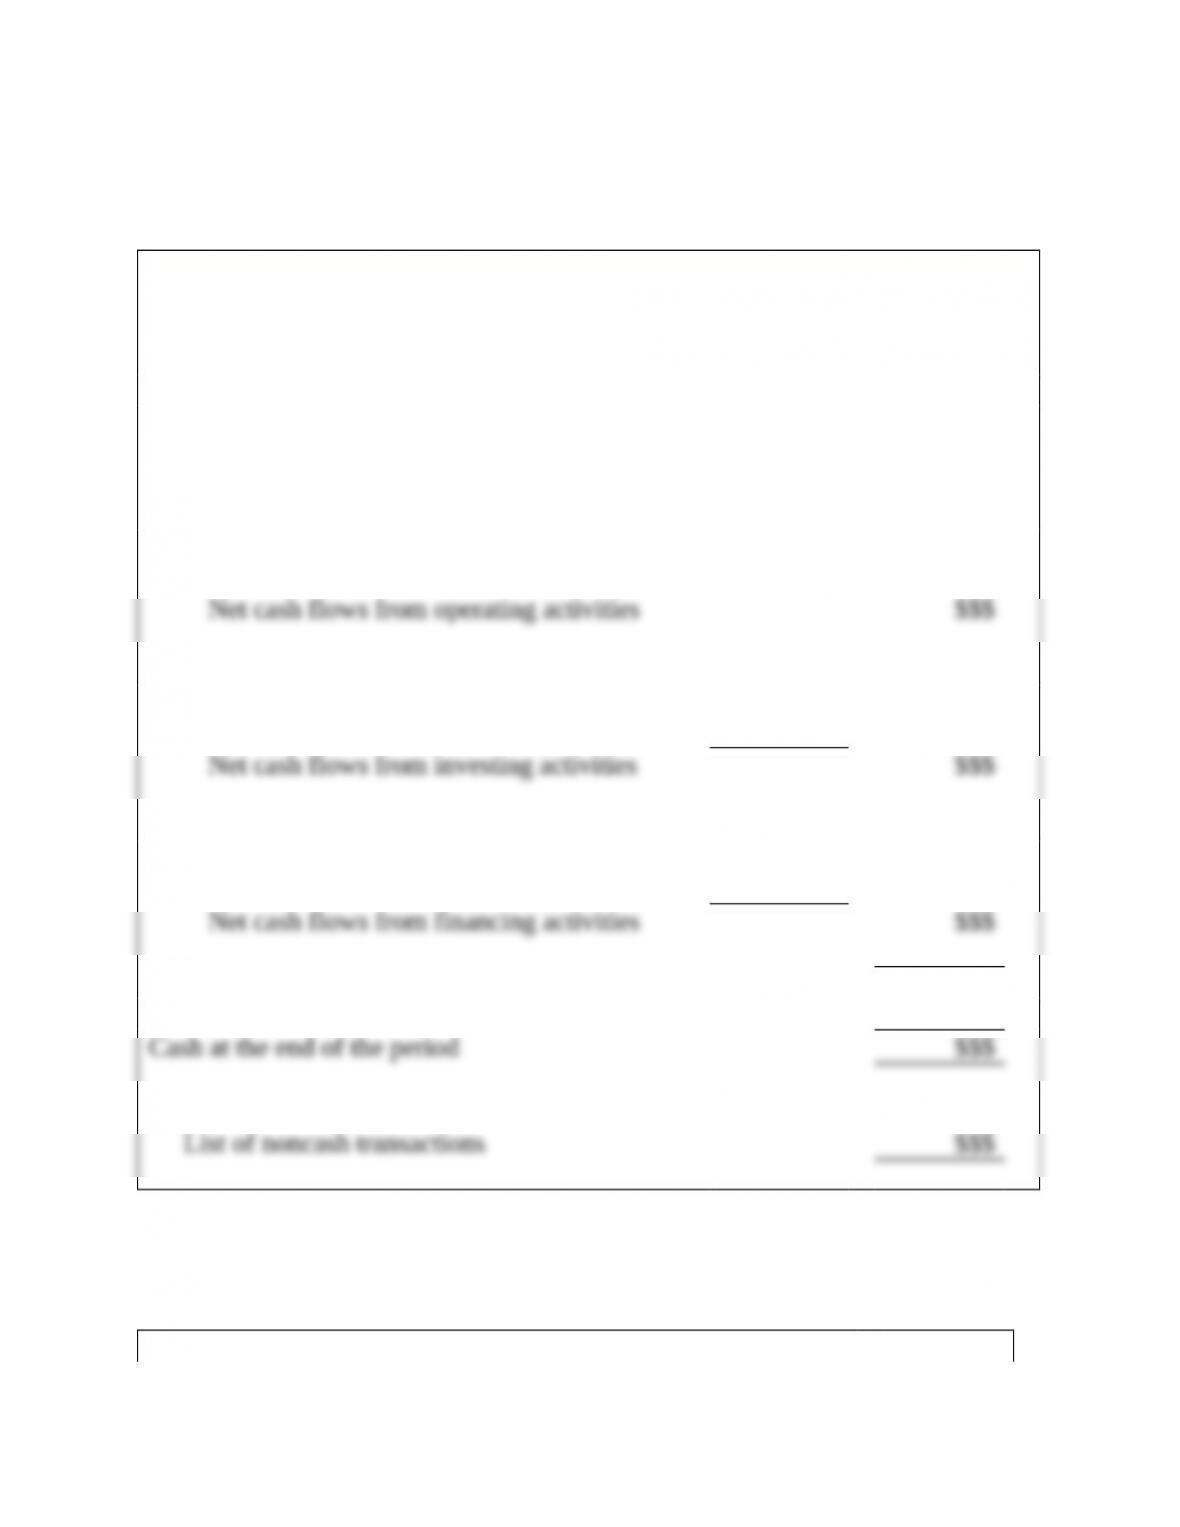
Exercise 11-7 (LO 11-2, 11-3)
Technology Solutions
Statement of Cash Flows
For the Year Ended December 31, 2015
Cash Flows from Operating Activities
Net income
Adjustments to reconcile net income to net cash
flows from operating activities:
List of items adjusting net income to operating
cash flows
Cash Flows from Investing Activities
List of cash inflows and outflows from investing
activities
Cash Flows from Financing Activities
List of cash inflows and outflows from
financing activities
Net increase (decrease) in cash $$$
Cash at the beginning of the period $$$
Note: Noncash Activities
Exercise 11-8 (LO 11-2)
Cash Flows from Operating Activities
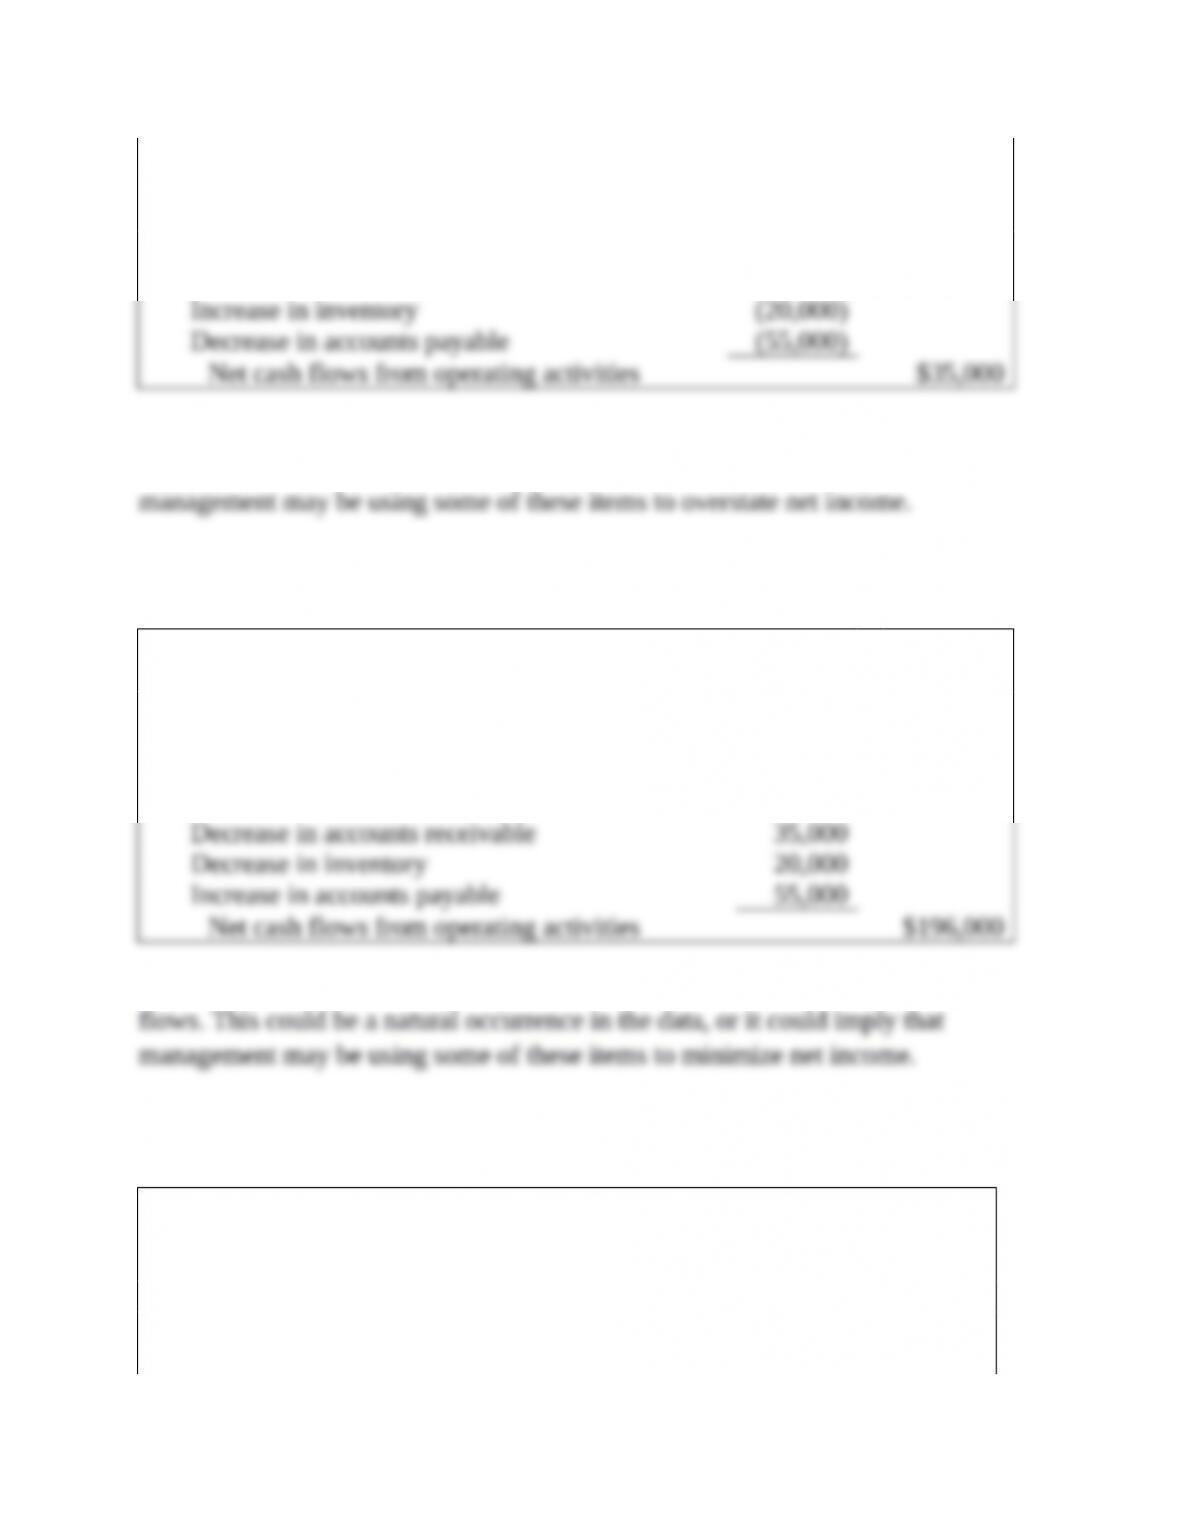
Net income $165,000
Adjustments to reconcile net income to net cash
flows from operating activities:
Gain (on sale of land) (20,000)
Increase in accounts receivable (35,000)
All of the adjustments are subtracted from net income in arriving at net operating
cash flows. This could be a natural occurrence in the data, or it could imply that
Exercise 11-9 (LO 11-2)
Cash Flows from Operating Activities
Net income $65,000
Adjustments to reconcile net income to net cash
flows from operating activities:
Depreciation expense 15,000
Loss (on sale of land) 6,000
All of the adjustments are added to net income in arriving at net operating cash
Exercise 11-10 (LO 11-2, 11-3)
Plasma Screens Corporation
Statement of Cash Flows
For the Year Ended December 31, 2015
Cash Flows from Operating Activities
Net income $ 79,000
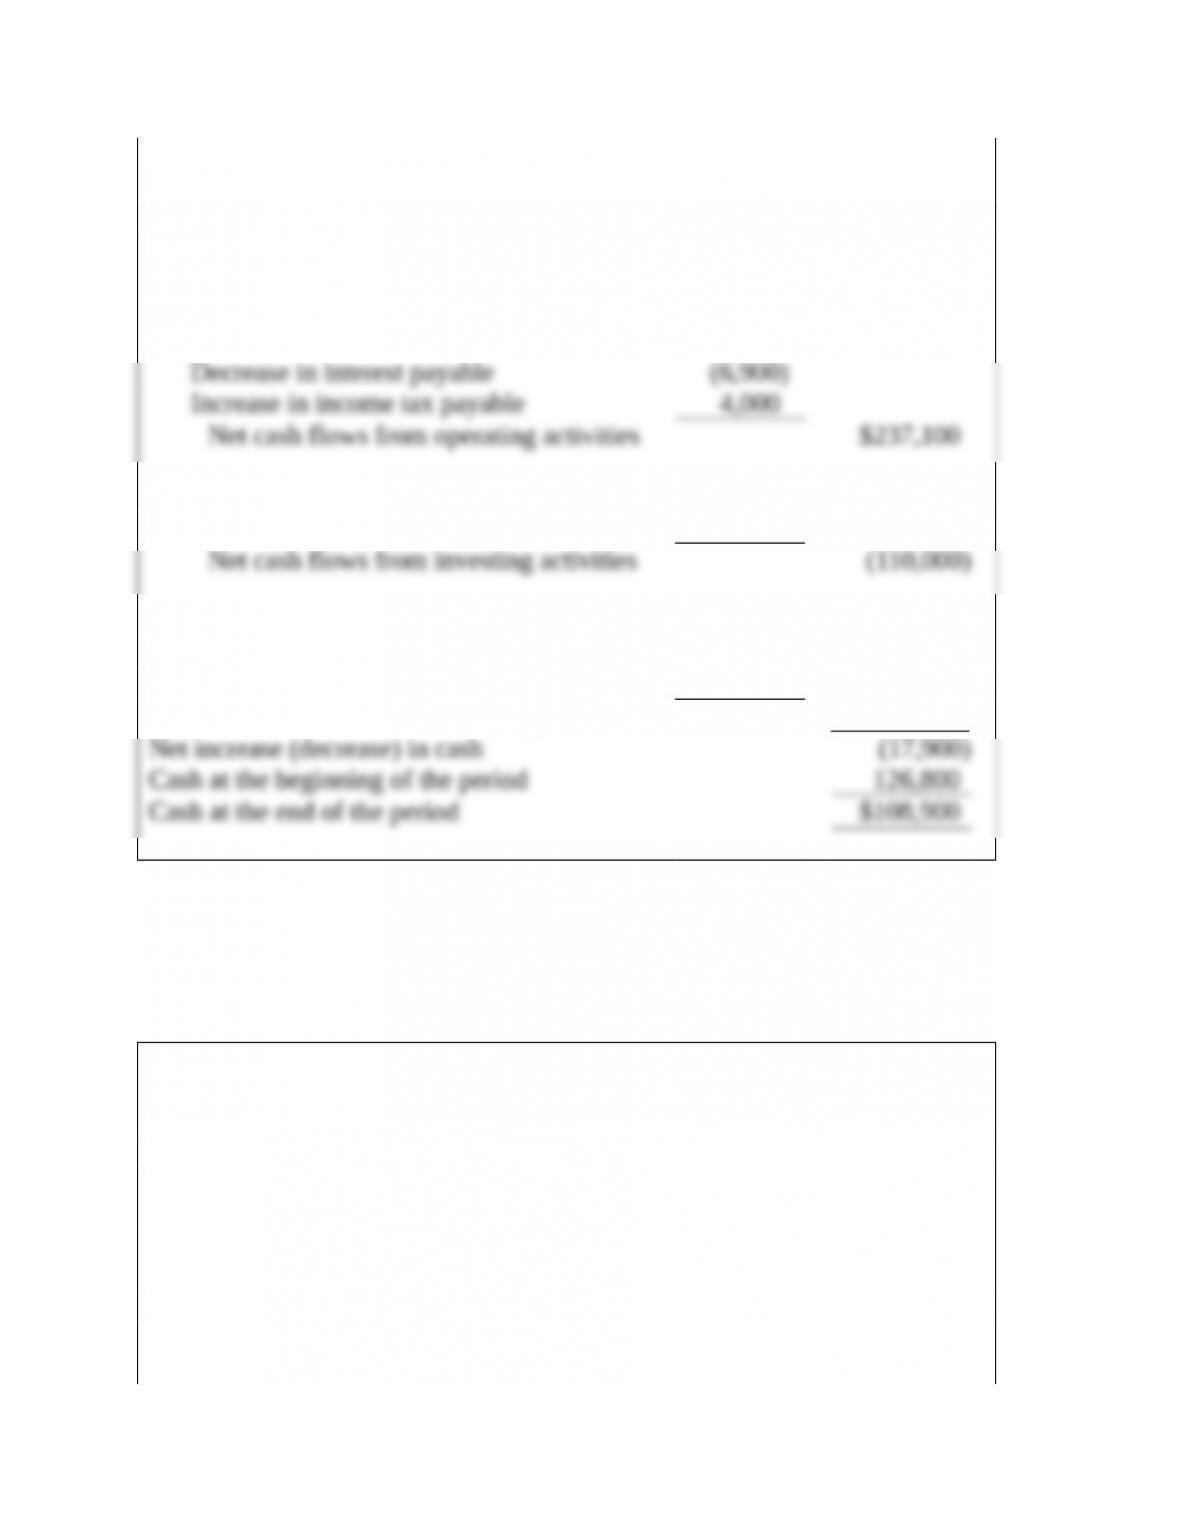
Adjustments to reconcile net income to net
cash flows from operating activities:
Depreciation expense 150,000
Decrease in accounts receivable 15,000
Increase in inventory (16,000)
Increase in prepaid rent (3,000)
Increase in accounts payable 15,000
Cash Flows from Investing Activities
Purchase of equipment (110,000)
Cash Flows from Financing Activities
Payment of notes payable (115,000)
Payment of cash dividends (30,000)
Net cash flows from financing activities (145,000)
Exercise 11-11 (LO 11-2)
Peach Computer
Statement of Cash Flows
For the Year Ended December 31, 2015
Cash Flows from Operating Activities
Net income $130,000
Adjustments to reconcile net income to net
cash flows from operating activities:
Depreciation expense 60,000
Decrease in accounts receivable 8,000
Increase in inventory (25,000)
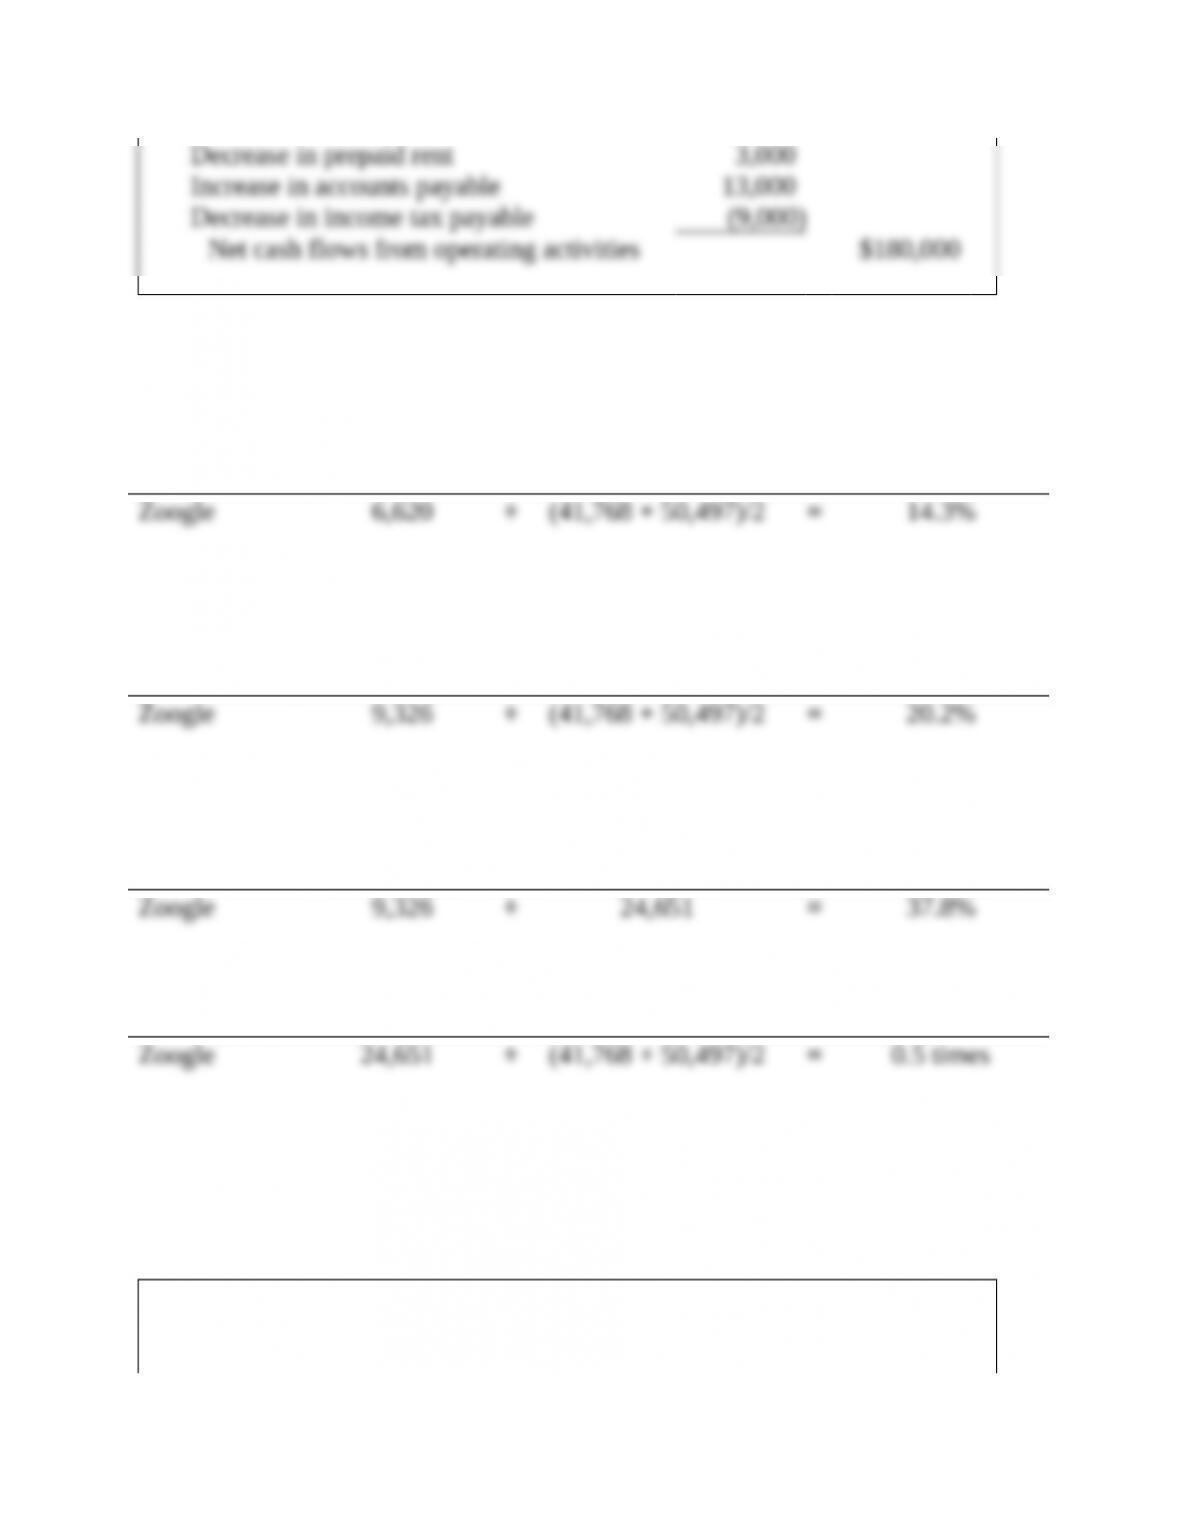
Exercise 11-12 (LO 11-4)
1.
($ in millions) Net Income ÷
Average
Total Assets =
Return
on Assets
2.
($ in millions)
Operating
Cash Flows ÷
Average
Total Assets =
Cash Return
on Assets
3.
($ in millions)
Operating
Cash Flows ÷ Net Sales =
Cash Flow
to Sales
($ in millions) Net Sales ÷
Average
Total Assets =
Asset
Turnover
Zoogle’s business strategy is closer to Apple’s high cash flow to sales margins and
low asset turnover.
*Exercise 11-13 (LO 11-5)
Peach Computer
Statement of Cash Flows
For the Year Ended December 31, 2015
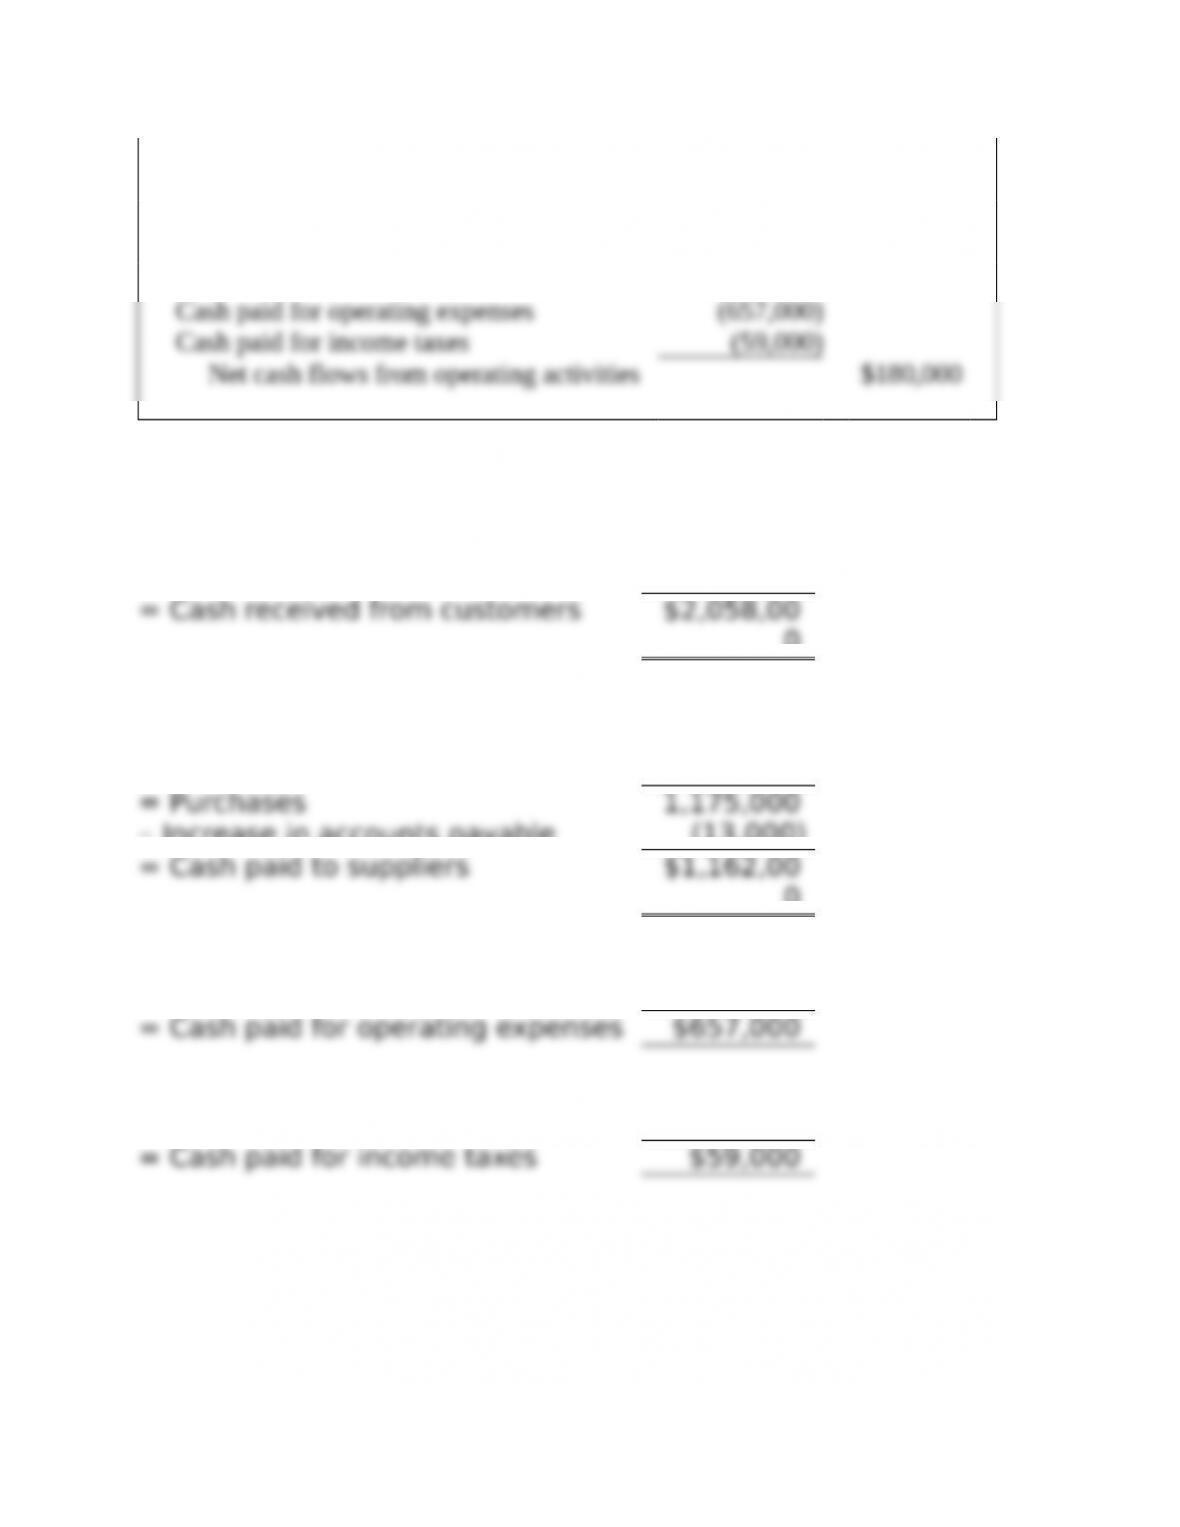
Cash Flows from Operating Activities
Cash received from customers $2,058,00
0
Cash paid to suppliers (1,162,000)
Net sales $2,050,00
0
+ Decrease in accounts receivable 8,000
0
Cost of goods sold $1,150,00
0
+ Increase in inventory 25,000
− Increase in accounts payable (13,000)
0
Operating expenses $660,000
− Decrease in prepaid rent (3,000)
Income tax expense $50,000
+ Decrease in income tax payable 9,000
*Exercise 11-14 (LO 11-5)
Net sales $3,200,00
0
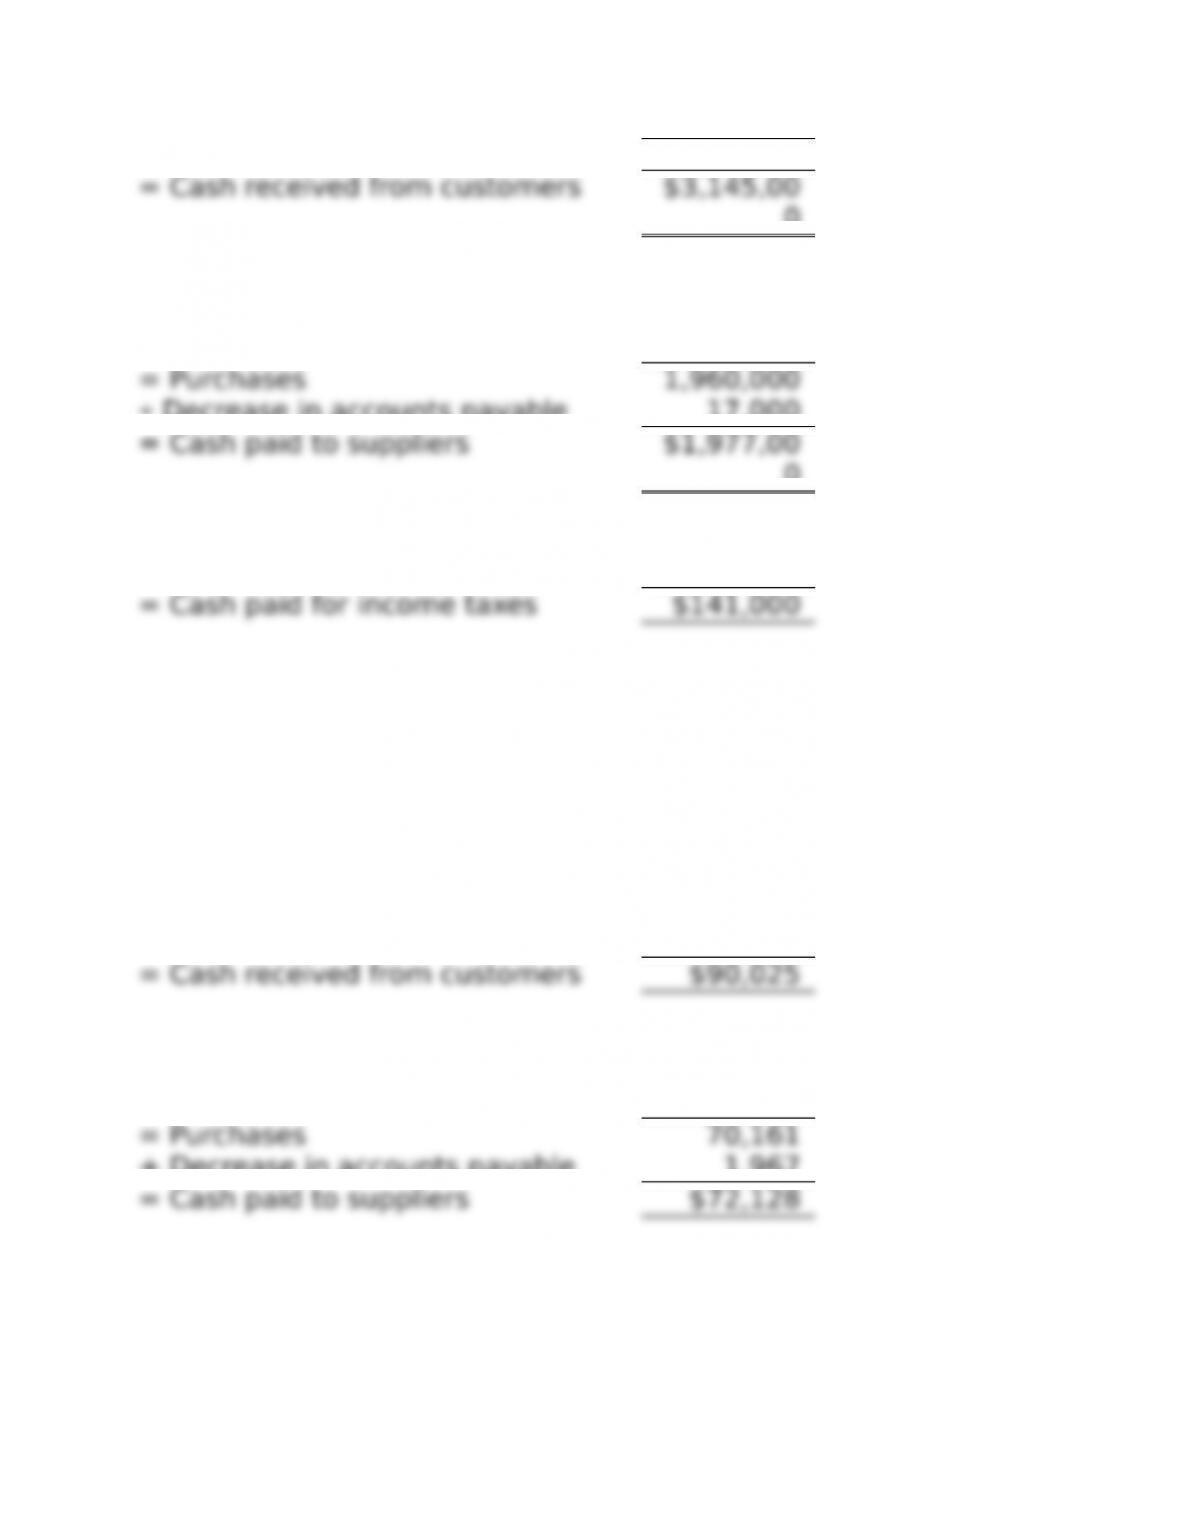
− Increase in accounts receivable (55,000)
0
Cost of goods sold $2,000,00
0
− Decrease in inventory (40,000)
+ Decrease in accounts payable 17,000
0
Income tax expense $150,000
− Increase in income tax payable (9,000)
*Exercise 11-15 (LO 11-5)
1.
($ in millions)
Net sales $91,758
− Increase in accounts receivable (1,733)
2.
Cost of goods sold $69,278
+ Increase in inventory 883
+ Decrease in accounts payable 1,967
Problem 11-1A (LO 11-1)
Problems: Set A
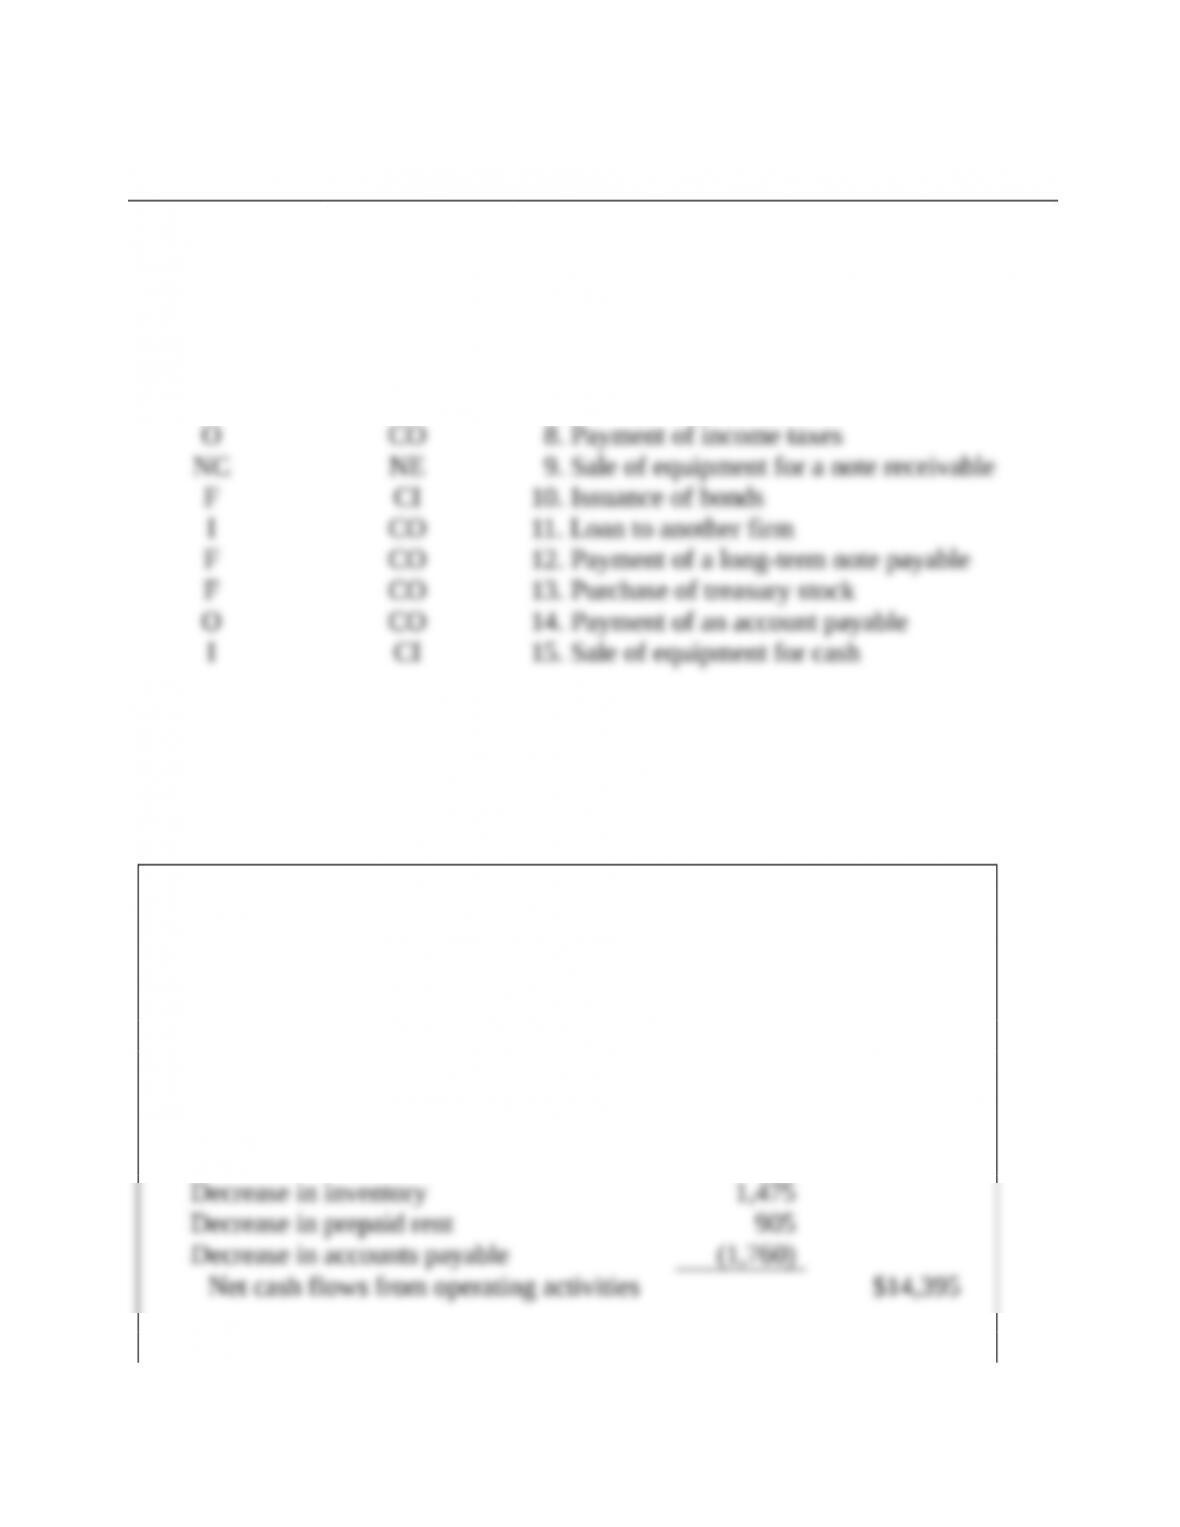
Type of
Activity
Cash Inflow
or Outflow Transaction
O CO 1. Payment of employee salaries
I CI 2. Sale of land for cash
O CO 3. Purchase of rent in advance
O CI 4. Collection of an account receivable
F CI 5. Issuance of common stock
O CO 6. Purchase of inventory
I CI 7. Collection of notes receivable
Problem 11-2A (LO 11-2, 11-3)
ATM Software Developers
Statement of Cash Flows
For the Year Ended December 31, 2015
Cash Flows from Operating Activities
Net income $12,400
Adjustments to reconcile net income to net
cash flows from operating activities:
Depreciation expense 5,465
Increase in accounts receivable (4,090)
Cash Flows from Investing Activities
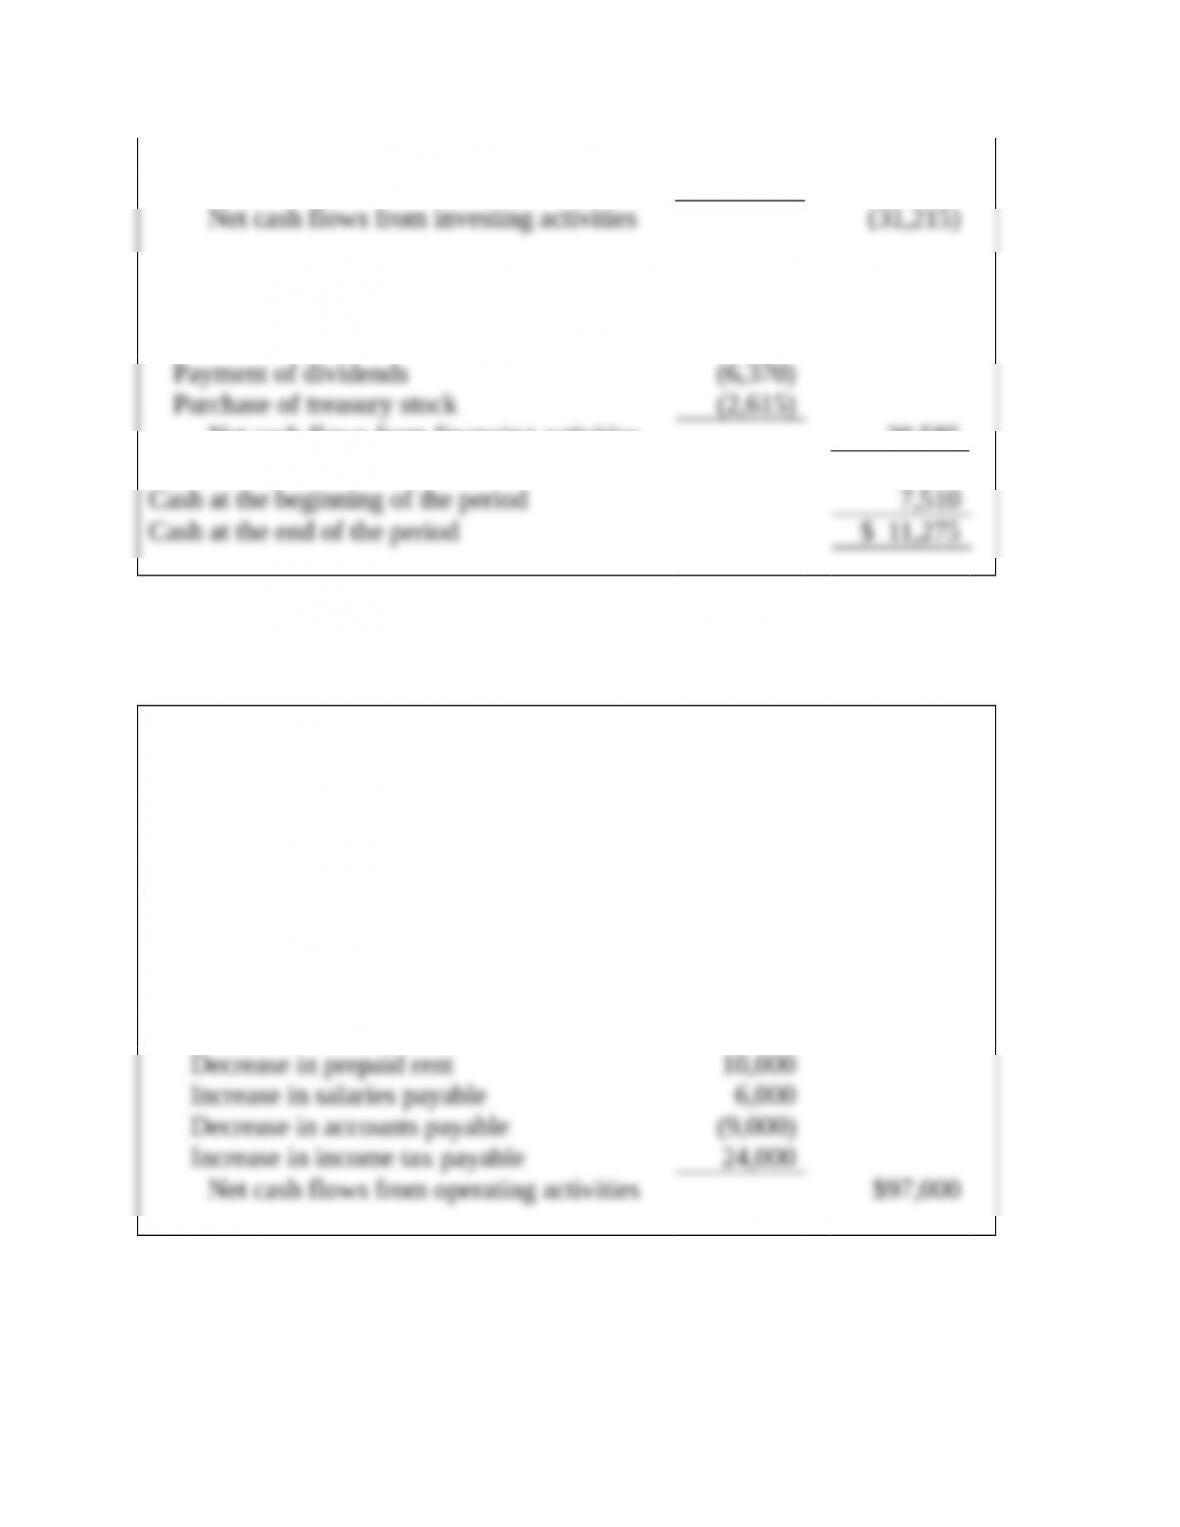
Cash received from sale of land 8,650
Purchase of equipment (39,865)
Cash Flows from Financing Activities
Issuance of common stock 13,075
Issuance of long-term notes payable 16,495
Net cash flows from financing activities 20,585
Net increase (decrease) in cash 3,765
Problem 11-3A (LO 11-2)
Alliance Technologies
Statement of Cash Flows
For the Year Ended December 31, 2015
Cash Flows from Operating Activities
Net income $56,000
Adjustments to reconcile net income to net
cash flows from operating activities:
Depreciation expense 17,000
Decrease in accounts receivable 7,000
Increase in inventory (14,000)
Problem 11-4A (LO 11-2, 11-3)
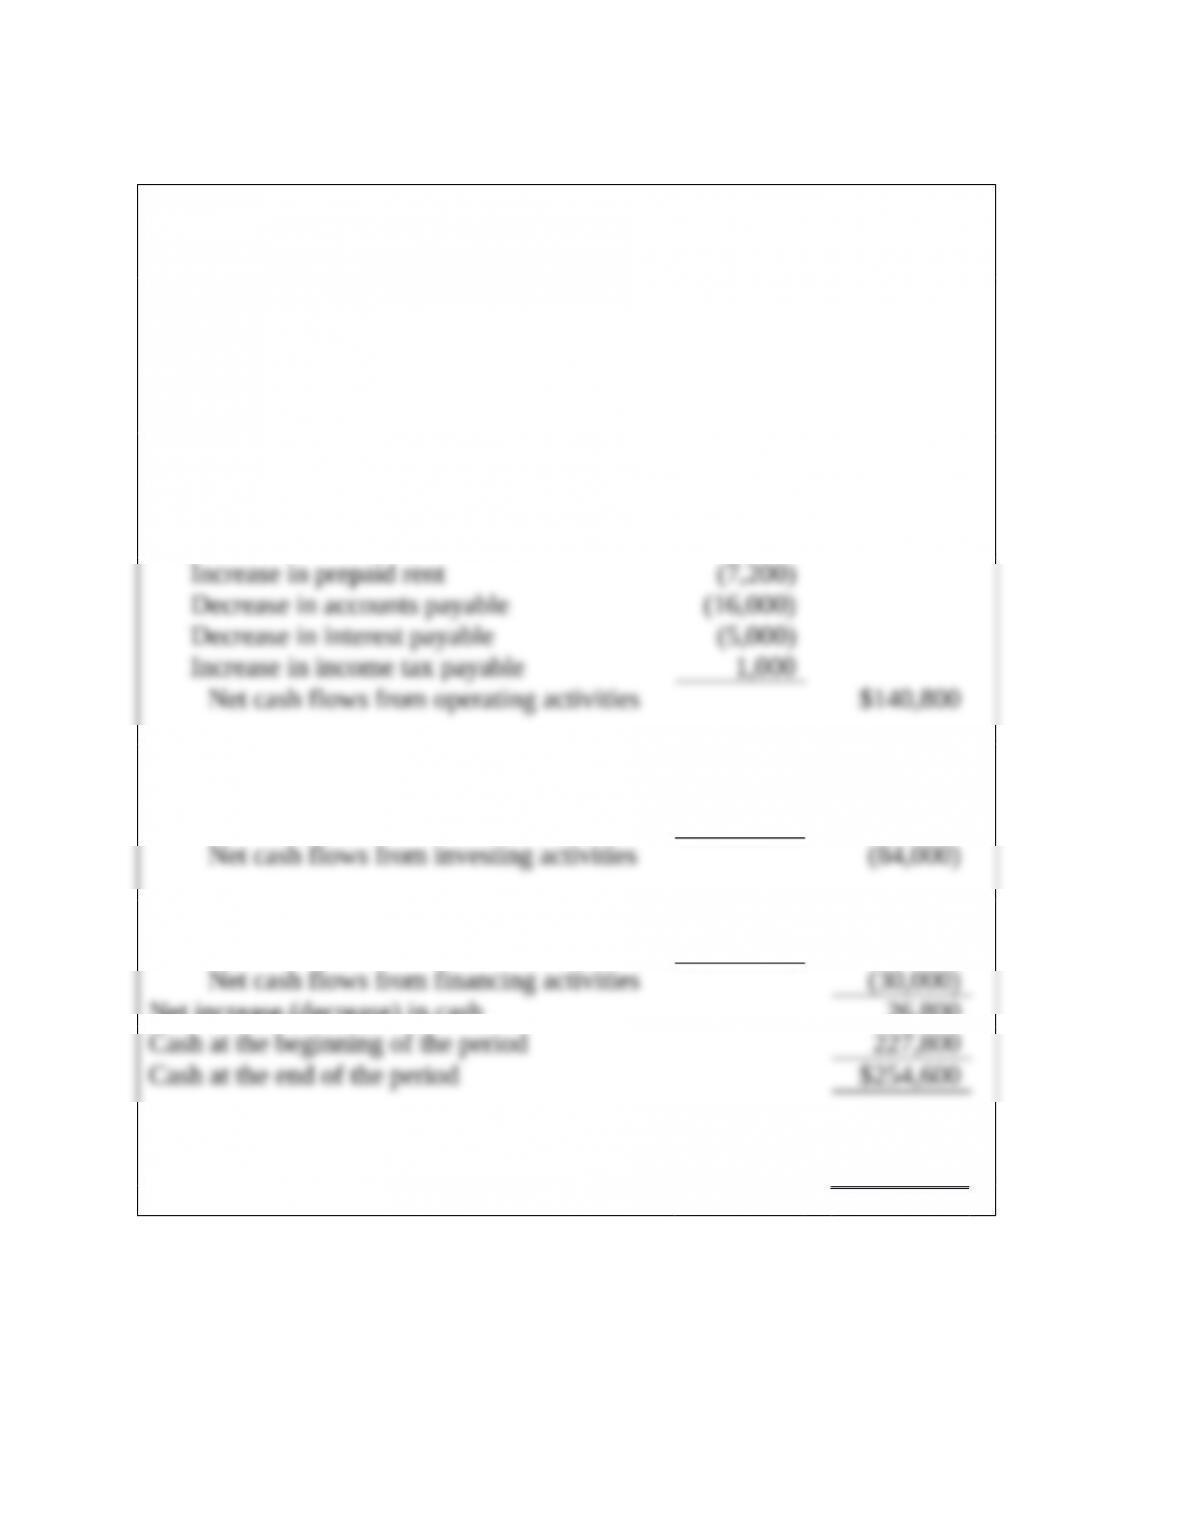
Video Phones, Inc.
Statement of Cash Flows
For the Year Ended December 31, 2015
Cash Flows from Operating Activities
Net income $104,000
Adjustments to reconcile net income to net
cash flows from operating activities:
Depreciation expense 37,000
Loss (on sale of land) 9,000
Increase in accounts receivable (22,000)
Decrease in inventory 40,000
Cash Flows from Investing Activities
Purchase investment in bonds (115,000)
Sale of land 31,000
Cash Flows from Financing Activities
Payment of cash dividends (30,000)
Net increase (decrease) in cash 26,800
Note: Noncash Activities
Purchase equipment issuing a note payable $70,000
Problem 11-5A (LO 11-4)
1.
($ in millions) Net Income ÷
Average
Total Assets =
Return
on Assets
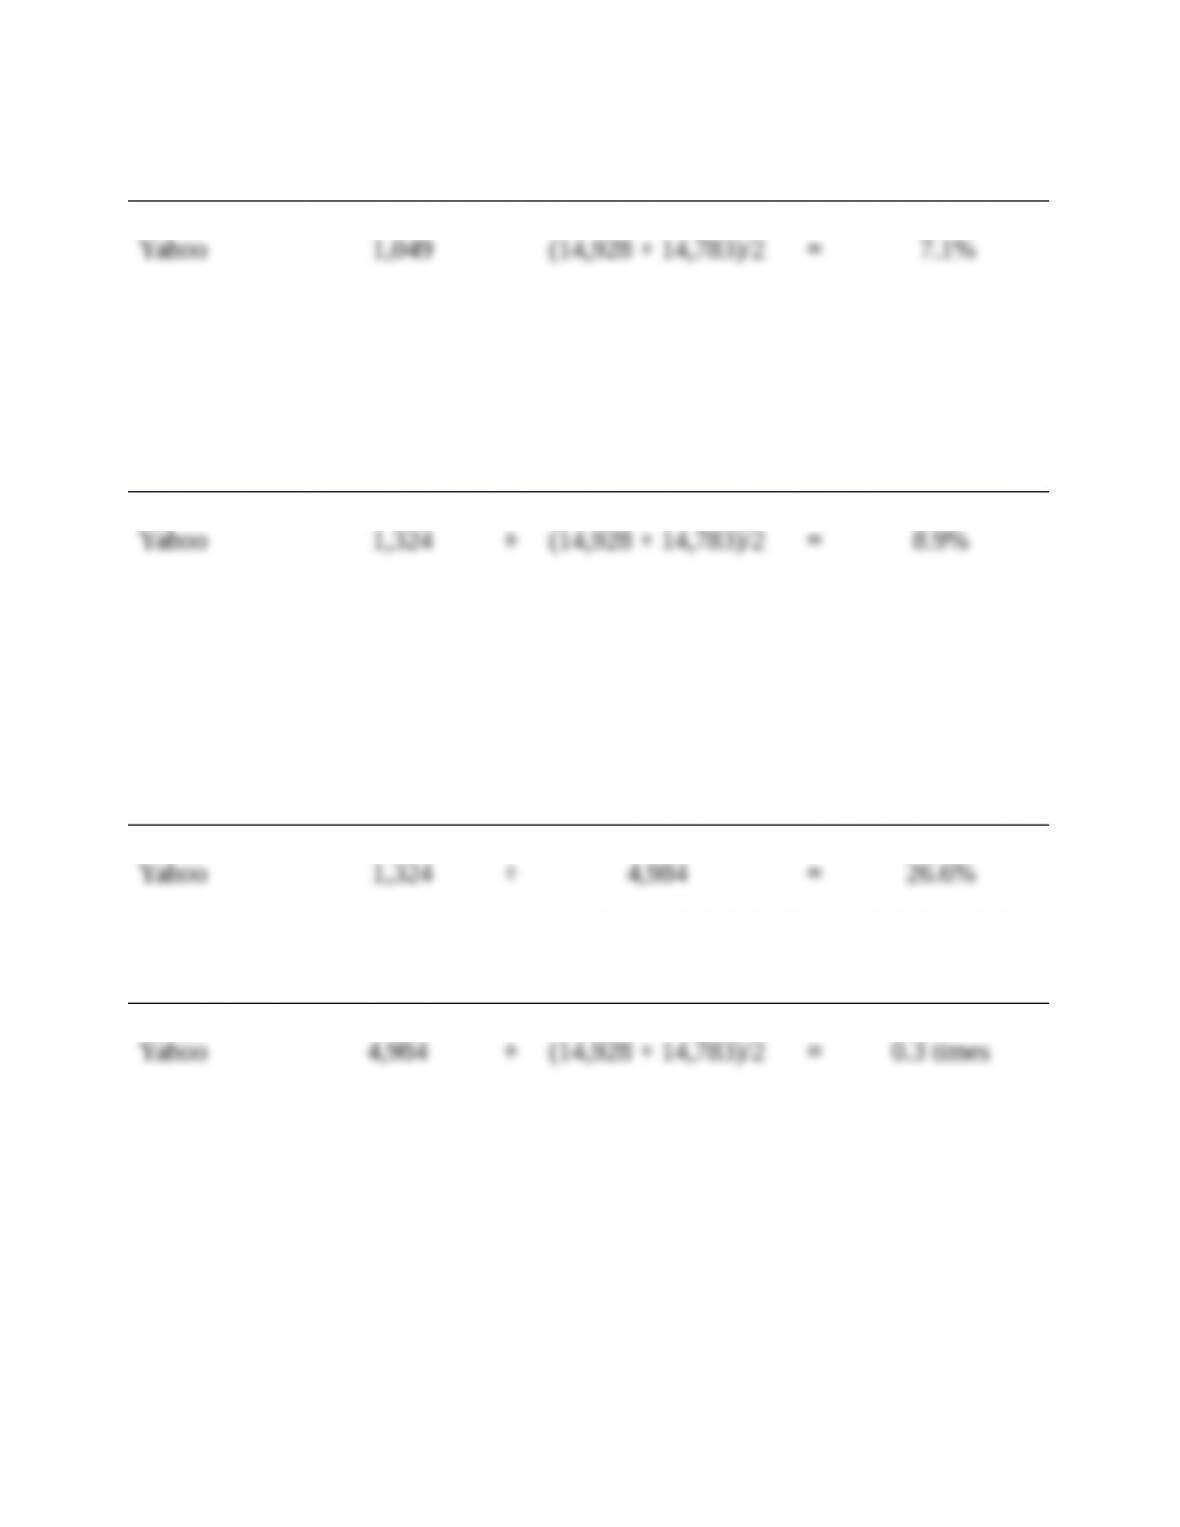
Google 9,737 ÷(57,851 + 72,574)/2 =14.9%
Google’s return on assets at 14.9% is lower than Apple, but higher than Dell.
Yahoo’s at 7.1% is lower than either Apple or Dell.
2.
($ in millions)
Operating
Cash Flows ÷
Average
Total Assets =
Cash Return
on Assets
Google 14,565 ÷(57,851 + 72,574)/2 =22.3%
Google’s cash return on assets at 22.3% is also lower than Apple, but higher than
Dell. Yahoo’s is lower than either Apple or Dell.
3.
($ in millions)
Operating
Cash Flows ÷ Net Sales =
Cash Flow
to Sales
Google 14,565 ÷37,905 =38.4%
($ in millions) Net Sales ÷
Average
Total Assets =
Asset
Turnover
Google 37,905 ÷(57,851 + 72,574)/2 =0.6 times