Chapter 14 – Business Unit Performance Measurement
14–11
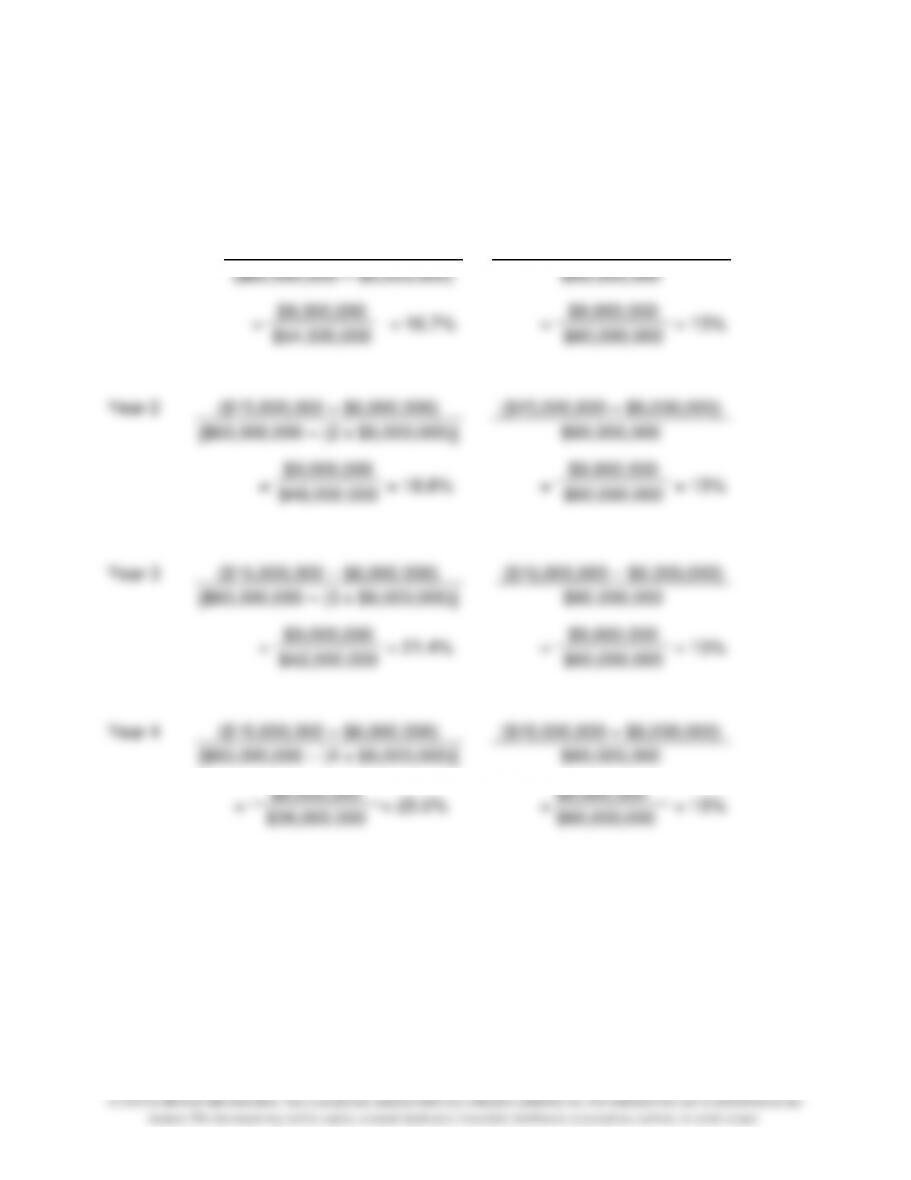
14–30. (25 min.) Compare Historical Cost, Net Book Value To Gross Book Value:
Caribbean Division.
a. Net Book Value
b. Gross Book Value
Year 1
($15,000,000 – $6,000,000)
($15,000,000 – $6,000,000)
($60,000,000 – $6,000,000)
$60,000,000
=
$9,000,000
= 16.7%
=
$9,000,000
= 15%
$54,000,000
$60,000,000
Year 2
($15,000,000 – $6,000,000)
($15,000,000 – $6,000,000)
[$60,000,000 – (2 x $6,000,000)]
$60,000,000
=
$9,000,000
= 18.8%
=
$9,000,000
= 15%
$48,000,000
$60,000,000
Year 3
($15,000,000 – $6,000,000)
($15,000,000 – $6,000,000)
[$60,000,000 – (3 x $6,000,000)]
$60,000,000
=
$9,000,000
= 21.4%
=
$9,000,000
= 15%
$42,000,000
$60,000,000
Year 4
($15,000,000 – $6,000,000)
($15,000,000 – $6,000,000)
[$60,000,000 – (4 x $6,000,000)]
$60,000,000
=
$9,000,000
= 25.0%
=
$9,000,000
= 15%
$36,000,000
$60,000,000
Chapter 14 – Business Unit Performance Measurement
14–12
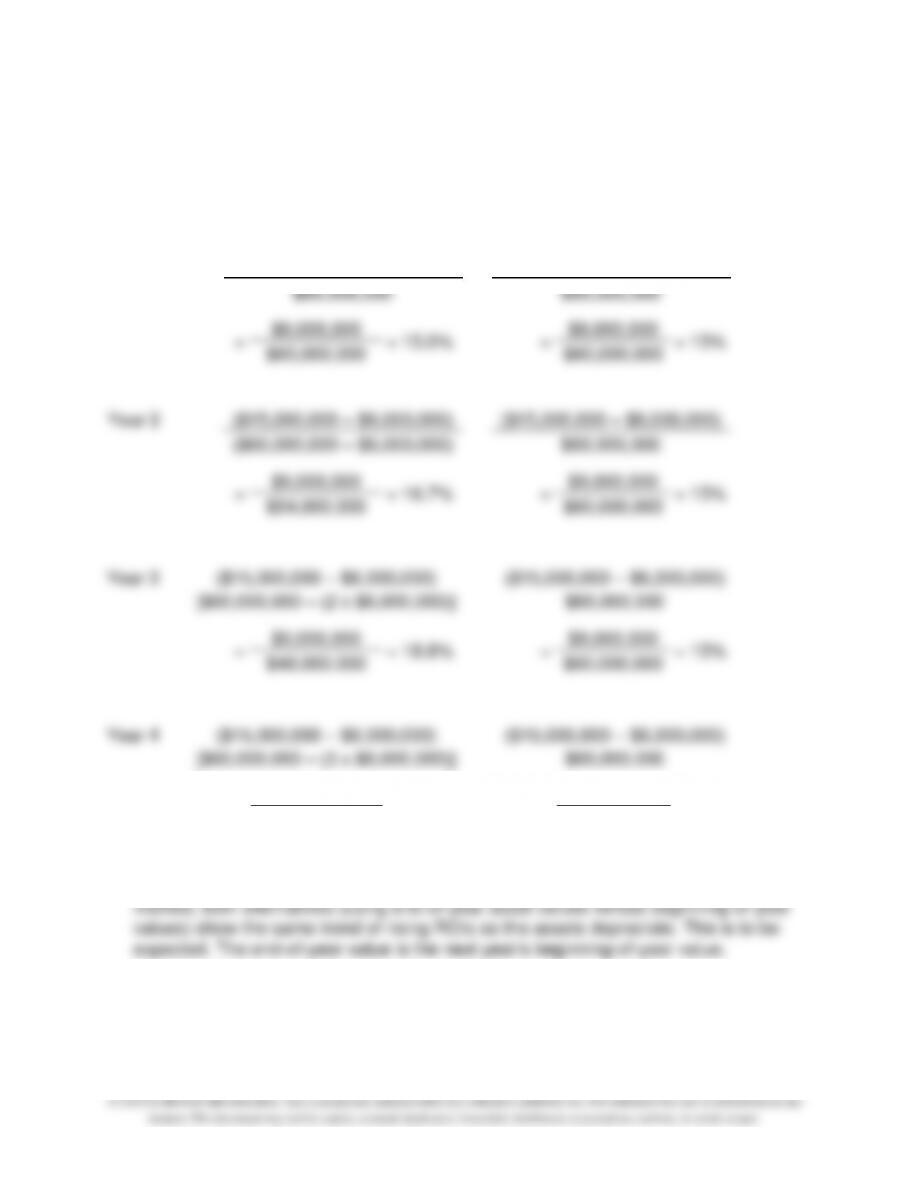
14–31. (25 min.) Compare ROI Using Net Book And Gross Book Values:
Caribbean Division.
a. Net Book Value
b. Gross Book Value
Year 1
($15,000,000 – $6,000,000)
($15,000,000 – $6,000,000)
$60,000,000
$60,000,000
=
$9,000,000
= 15.0%
=
$9,000,000
= 15%
$60,000,000
$60,000,000
Year 2
($15,000,000 – $6,000,000)
($15,000,000 – $6,000,000)
($60,000,000 – $6,000,000)
$60,000,000
=
$9,000,000
= 16.7%
=
$9,000,000
= 15%
$54,000,000
$60,000,000
Year 3
($15,000,000 – $6,000,000)
($15,000,000 – $6,000,000)
[$60,000,000 – (2 x $6,000,000)]
$60,000,000
=
$9,000,000
= 18.8%
=
$9,000,000
= 15%
$48,000,000
$60,000,000
Year 4
($15,000,000 – $6,000,000)
($15,000,000 – $6,000,000)
[$60,000,000 – (3 x $6,000,000)]
$60,000,000
=
$9,000,000
= 21.4%
=
$9,000,000
= 15%
$42,000,000
$60,000,000
c. Of course, there is no change under the gross book value method. With the net
Chapter 14 – Business Unit Performance Measurement
14–13
14–32.
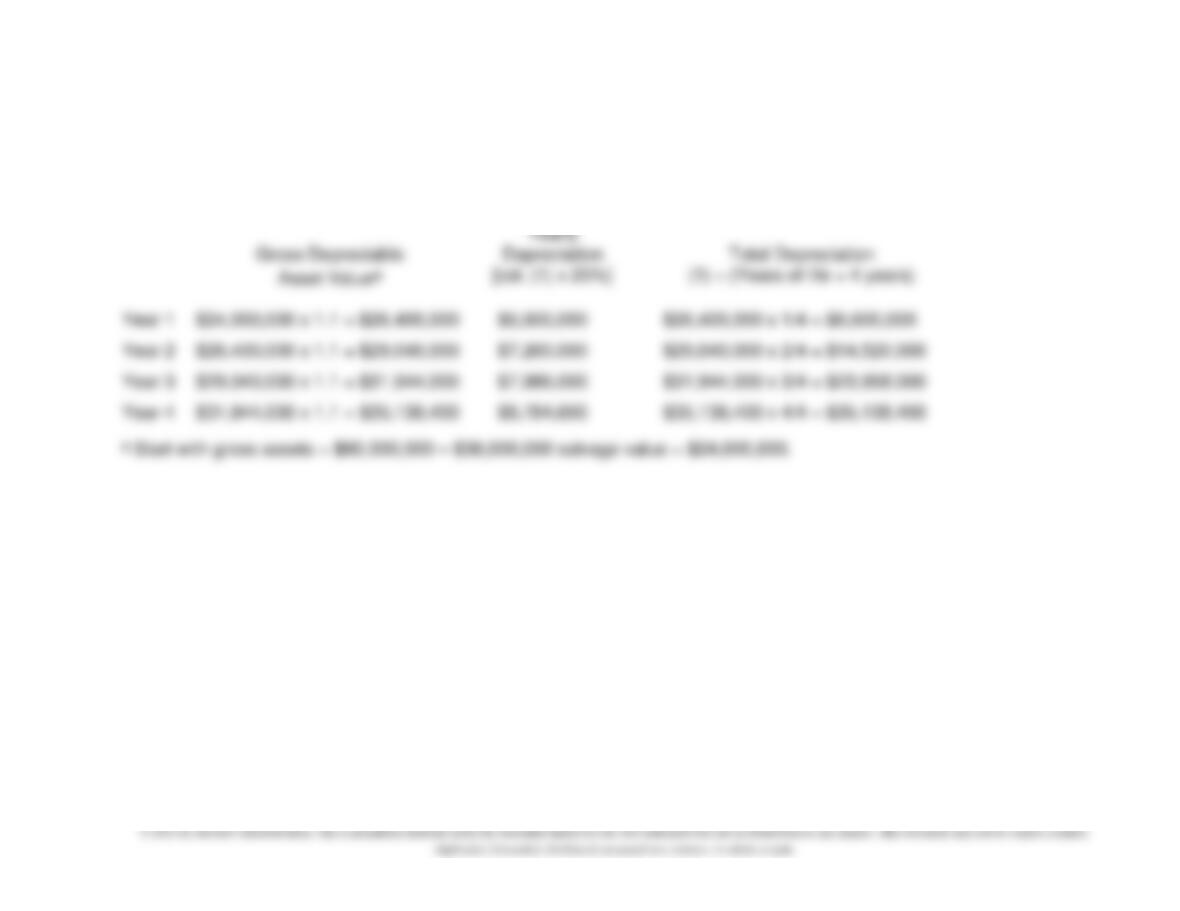
(30 min.) Compare Current Cost To Historical Cost: Caribbean Division.
Parts c and d can be solved easier if one first sets up a table showing the change in value of the depreciable assets.
(1)
Gross Depreciable
Asset Valuea
(2)
Yearly
Depreciation
[col. (1) x 25%]
(3)
Total Depreciation
(1) (Years of life ÷ 4 years)
Chapter 14 – Business Unit Performance Measurement
14–14
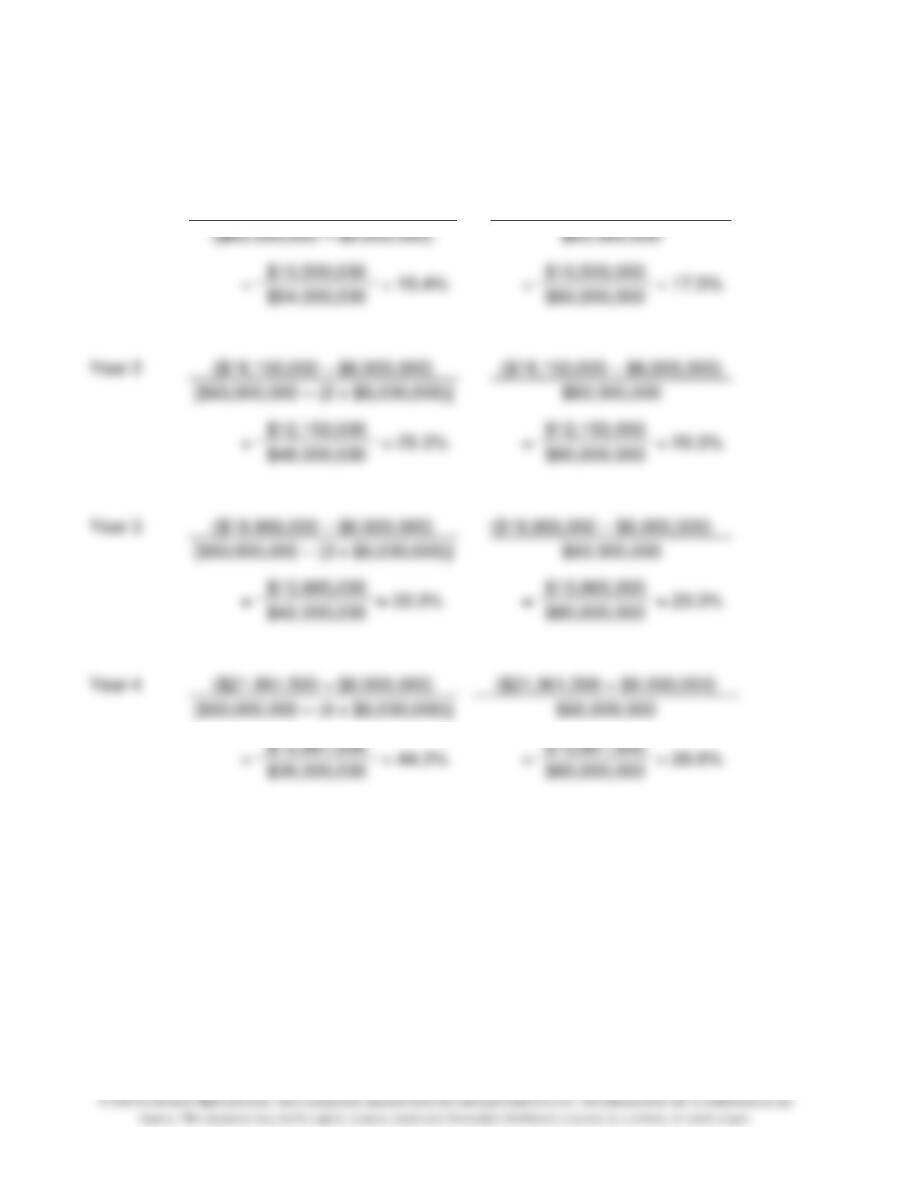
14–32. (continued)
a.
Historical Cost
Net Book Value
b.
Historical Cost
Gross Book Value
Year 1
($16,500,000 – $6,000,000)
($16,500,000 – $6,000,000)
($60,000,000 – $6,000,000)
$60,000,000
=
$10,500,000
= 19.4%
=
$10,500,000
= 17.5%
$54,000,000
$60,000,000
Year 2
($18,150,000 – $6,000,000)
($18,150,000 – $6,000,000)
[$60,000,000 – (2 x $6,000,000)]
$60,000,000
=
$12,150,000
= 25.3%
=
$12,150,000
= 20.3%
$48,000,000
$60,000,000
Year 3
($19,965,000 – $6,000,000)
($19,965,000 – $6,000,000)
[$60,000,000 – (3 x $6,000,000)]
$60,000,000
=
$13,965,000
= 33.3%
=
$13,965,000
= 23.3%
$42,000,000
$60,000,000
Year 4
($21,961,500 – $6,000,000)
($21,961,500 – $6,000,000)
[$60,000,000 – (4 x $6,000,000)]
$60,000,000
=
$15,961,500
= 44.3%
=
$15,961,500
= 26.6%
$36,000,000
$60,000,000
Chapter 14 – Business Unit Performance Measurement
14–32. (continued)
c.
Current Cost
Net Book Value
d.
Current Cost
Gross Book Value
Year 1
($16,500,000 – $6,600,000)
($16,500,000 – $6,600,000)
($66,000,000 – $6,600,000)
$66,000,000
=
$9,900,000
= 16.7%
=
$9,900,000
= 15.0%
$59,400,000
$66,000,000
[$72,600,000 – $14,520,000]
$72,600,000
Year 3
[$79,860,000 – $23,958,000]
$79,860,000
$79,860,000
Year 4
[$87,846,000 – $35,138,400]
$87,846,000
= 25%
=
= 15.0%
$87,846,000
Chapter 14 – Business Unit Performance Measurement
14–16
14–33. (25 min.) Effects Of Current Cost On Performance Measurements: Upper
Division.
a.
ROI
Year 1:
$225,000 – (.25 x $600,000)
=
$75,000
= 12.5%
$600,000
$600,000
Year 2:
$255,000 – (.25 x $600,000)
=
$105,000
= 17.5%
$600,000
$600,000
Year 3:
$285,000 – (.25 x $600,000)
=
$135,000
= 22.5%
$600,000
$600,000
Year 4:
$300,000 – (.25 x $600,000)
=
$150,000
= 25.0%
$600,000
$600,000
b.
ROI
Year 1:
$225,000 – (.25 x $600,000)
=
$75,000
= 12.5%
$600,000
$600,000
Year 2:
$255,000 – (.25 x $660,000)
=
$90,000
= 13.6%
$660,000
$660,000
Year 3:
$285,000 – (.25 x $726,000)
=
$103,500
= 14.3%
$726,000
$726,000
Year 4:
$300,000 – (.25 x $798,600)
=
$100,350
= 12.6%
$798,600
$798,600
Chapter 14 – Business Unit Performance Measurement
14–17
14–34. (10 min.) Comparing Business Units Using ROI: BMI.
East
West
Income
Investment
$200
$2,000
$390
$3,000
= 10%
= 13%
Based on ROI, West performed better than East.
14–35. (10 min.) Comparing Business Units Using Residual Income: BMI.
East
West
Income
– Investment x Cost of Capital
$200
$390
– $2,000 x 15%
– $3,000 x 15%
= $(100)
= $(60)
Based on RI, West performed better than East.
Chapter 14 – Business Unit Performance Measurement
14–18
14–36. (10 min.) Comparing Business Units Using Economic Value Added: BMI.
In computing EVAs, we need to adjust both income and investment (assets). The
income adjustment is for R&D and the investment adjustment is for R&D and
Chapter 14 – Business Unit Performance Measurement
14–19
Solutions to Problems
14–37. (30 min.) Equipment Replacement And Performance Measures: Pitt, Inc.
ROI
a.
$3,750,000
= 60%
$4,000,000 + $5,000,000 – $1,500,000 – $1,250,000
b.
$3,750,000 – $3,500,000a
= 2.7%
$4,000,000 – $1,250,000 + $6,500,000
a Loss on old equipment equal to its $5 million cost less $1,500,000 depreciation.
c.
$5,025,000b
= 83.8%
$4,000,000 – (2 x $1,250,000) + $6,500,000 – $2,000,000
b Net income:
Sales revenue …………………………..
$17,600,000
(up 10%)
Costs:
Variable …………………………..
2,200,000
(up 10%)
Fixed ……………….………….
7,125,000
(down 5%)
Depreciation:
Equipment …….…………………….
2,000,000c
Other …………………………..
1,250,000
$5,025,000
c $2,000,000 = [($6,500,000 – $500,000) ÷ 3 years]
Chapter 14 – Business Unit Performance Measurement
14–38. (20 min.) Evaluate Trade-Offs In Return Measurement: Pitt, Inc.
a. The machine is going to result in a positive net benefit, so he would want to acquire it
as early in the year as possible so he could obtain a full year’s benefits.
b. For the manager, the relevant cost is the lost bonus this year if the machine is