Chapter 10 – Fundamentals of Cost Management
10–55. (30 min.) Assigning Capacity Costs: Cathy and Tom’s Specialty Ice Cream
Company.
Cathy and Tom’s Specialty Ice Cream Company illustrates in a very simple way the
issues of cost system design when costing excess capacity. Although the problem
1. Cost at capacity:
Overhead rate =
($27,000 ÷ 18,000 gallons) =
$1.50/gallon
Product cost =
$1.00 + $1.50 =
$2.50/gallon
2. Cost at demand:
Overhead rate =
($27,000 ÷ 13,500 gallons) =
$2.00/gallon
Product cost =
$1.00 + $2.00 =
$3.00/gallon
How do you choose between the two? Why did Cathy and Tom buy a plant with a
capacity of 18,000 gallons? Possible reasons include:
(1) They hope to grow the market, i.e., for future expansion.
(2) Because capacity is “lumpy” and they can only buy in increments of, perhaps,
9,000 gallons.
(3) Because daily demand fluctuates and they need the surge capacity.
If it is reason (1), then the excess capacity is for Cathy and Tom and should not be
Chapter 10 – Fundamentals of Cost Management
10–56. (30 min.) Assigning Capacity Costs—Seasonality: Cathy and Tom’s
Specialty Ice Cream.
1. Excess capacity costs assigned to season in which it is incurred, then to products
in that season. Thus,
Winter:
Overhead rate =
($13,500 ÷ 4,500 gallons) =
$3.00/gallon
Product cost =
$1.00 + $3.00 =
$4.00/gallon
Summer
Overhead rate =
($13,500 ÷ 9,000 gallons) =
$1.50/gallon
Product cost =
$1.00 + $1.50 =
$2.50/gallon
2. Excess capacity costs assigned to the season requiring it, then to products
produced in that season. Thus,
Winter:
Overhead rate =
($13,500 50%) ÷ 4,500
gallons) =
$1.50/gallon
Product cost =
$1.00 + $1.50 =
$2.50/gallon
Summer
Overhead rate =
[$13,500 + ($13,500 50%)] ÷
9,000 gallons) =
$2.25/gallon
Product cost =
$1.00 + $2.25 =
$3.25/gallon
Chapter 10 – Fundamentals of Cost Management
10–57. (30 min.) Assigning Capacity Costs—Seasonality: Cathy and Tom’s
Specialty Ice Cream.
With seasonal demand fluctuations, the reason for the excess capacity is for the benefit
of the two customers (Cathy and Tom need all the capacity in the summer). The issue is
how to treat the excess capacity costs. The capacity costs in each season are $9,000 (=
$9,000. Thus, there is $4,500 (3,000 gallons) of unused capacity cost in the winter. Of
this, 50 percent (1,500 gallons) or $2,250 is needed in both the fall/spring and summer
seasons. Thus, we can split that cost between those two seasons ($1,125 each
season). The remaining $2,250 of unused capacity cost in the winter is required to
serve summer demand. Therefore, a total of $3,375 of unused winter capacity cost is
Capacity Costs
Winter
Fall/Spring
Summer
Total …………………………………….………………..
$9,000
$9,000
$9,000
Unused ………………………………..………………..
(4,500)
(2,250)
–0–
Used ……………………………………………………..
$4,500
$6,750
$9,000
Charge for unused…………………………..
–0–
1,125a
5,625b
Total capacity costs …………………………..
$4,500
$7,875
$14,625
Production (gallons) …………………..………
3,000
4,500
6,000
Rate……………………………………………………….
$1.50c
$1.75
$2.44
Variable cost …………………………….………………..
1.00
1.00
1.00
Total cost ………………………………….………………..
$2.50
$2.75
$3.44
a $1,125 = 25% of the unused capacity cost from winter. (Cathy and Tom would only
Chapter 10 – Fundamentals of Cost Management
10–58. (30 min.) Quality Improvement: IPort Products.
a. There are two alternatives: continue with the current material or use the new
material. To determine the best alternative (considering only the financial
consequenses), compute profit under each alternative:
Current Material
New Material
Number of units sold ……………………………………………..
127,500
142,500
Price per unit ……………………………………………………….
$20
$20
Sales revenue ……………………………………………………...
$2,550,000
$2,850,000
Variable cutting manufacturing costs (150,000 units):
Materials (@$5 for current; $7.25 for new) ……………..
750,000
1,087,500
Other variable (@$2) ………………………………………….
300,000
300,000
Fixed manufacturing costs (cutting) ………………………….
900,000
900,000
Variable sewing costs (@$3) …………………………………..
382,500
427,500
Fixed sewing costs ………………………………………………..
75,000
75,000
Inspection and testing …………………………………………...
90,000
60,000
Profit
$ 52,500
$ 0
Alternatively, we can do a differential analysis:
Additional revenue ……………………………………...
($20 x 15,000 units)
$300,000
Inspection savings ……………………………………….
30,000
$330,000
Less additional material cost in cutting …………...
($2.25 x 150,000)
337,500
Less additional variable cost in sewing …………..
($3 x 15,000)
45,000
Net change in profit …………………………………..
$(52,500)
b. Based on the financial analysis, it appears to be more profitable to continue with
the current material. Other considerations include the cost of dealing with scrap.
Chapter 10 – Fundamentals of Cost Management
10–59. (30 min.) Quality Improvement: Metallic, Inc.
a. There are two alternatives: continue with the current material or use the new
material. To determine the best alternative (considering only the financial
consequenses), compute profit under each alternative:
Current Material
New Material
Number of units sold ……………………………………………..
8,500
9,500
Price per unit ……………………………………………………….
$500
$500
Sales revenue ……………………………………………………...
$4,250,000
$4,750,000
Variable bending manufacturing costs (10,000 units):
Materials (@$125 for current; $180 for new) …………..
1,250,000
1,800,000
Other variable (@$50) ………………………………………..
500,000
500,000
Fixed manufacturing costs (cutting) ………………………….
750,000
750,000
Variable welding costs (@$75) ………………………………..
637,500
712,500
Fixed welding costs ……………………………………………….
500,000
500,000
Inspection and testing …………………………………………...
120,000
100,000
Profit
$ 492,500
$ 387,500
Alternatively, we can do a differential analysis:
Additional revenue …………………………………….
($500 x 1,000 units)
$500,000
Inspection savings ……………………………………..
20,000
$520,000
Less additional material cost in bending ………..
($55 x 10,000)
550,000
Less additional variable cost in welding ………..
($75 x 1,000)
75,000
Net change in profit …………………………………
$(105,000)
b. Based on the financial analysis, it appears to be more profitable to continue with
the current material. Other considerations include the cost of dealing with scrap.
Chapter 10 – Fundamentals of Cost Management
Solutions to Integrative Cases
10–60. (50 Min) Cost Hierarchies, Cost of Customers, and Pricing: WSM
($000)
Sales revenue ……………..
(40 Passengers
x 1,400 flights x $225)
$12,600
Costs:
Flight related …………..
(1,400 x $1,600)
$2,240
Passenger related ……
(40 Passengers
x 1,400 flights x $4)
224
Advertising related……
(20 Promotions x $60,000)
1,200
Fixed costs ……………..
($4,000 + $2,000 + $1,250)
7,250
10,914
Operating income …………
$1,686
Chapter 10 – Fundamentals of Cost Management
10–60. (continued)
b.
We can first consider the incremental revenues and costs that would result:
Increase in revenues: (5% x 40 passengers x 1,400 flights x $225) = $630,000
Increase in costs: $1,000,000 – (1,400 flights x $100) + (5% x 40 x 1,400 x $4) =
$871,200
1. Will we lose business to competitors that offer Internet sales?
2. Will we increase customer satisfaction if we offer Internet sales?
c.
This is a breakeven question. One approach is to set up the operating income in
© 2014 by McGraw-Hill Education. This is proprietary material solely for authorized instructor use. Not authorized for sale or distribution in any
manner. This document may not be copied, scanned, duplicated, forwarded, distributed, or posted on a website, in whole or part.
10–38
10–61. (50 Min) Unused Capacity: The Grape Cola Caper.
(Refer to the solution for 9-53.)
a. Percentage utilization of resource by activities:
Activity
Setups
Production
Runs
Products
Machine
Time
Indirect labor (including fringe benefits)
50%
40%
10%
0%
Information technology (IT)
0
80
20
0
Machinery depreciation
0
0
0
100
Machinery maintenance
0
0
0
100
Energy
0
0
0
100
Costs assigned to activiities:
Activity
Cost
Setups
Production
Runs
Products
Machine
Time
Indirect labor
$28,000
$14,000
$11,200
$2,800
$ 0
IT
10,000
0
8,000
2,000
0
Machinery depreciation
8,000
0
0
0
8,000
Machinery maintenance
4,000
0
0
0
4,000
Energy
2,000
0
0
0
2,000
Total
$52,000
$14,000
$19,200
$4,800
$14,000
÷ Activity
560 hours
110 runs
4 products
20,000 hrs
Cost driver rates
$25
$174.55
$1,200
$0.70
Chapter 10 – Fundamentals of Cost Management
10–39
10–61. (continued)
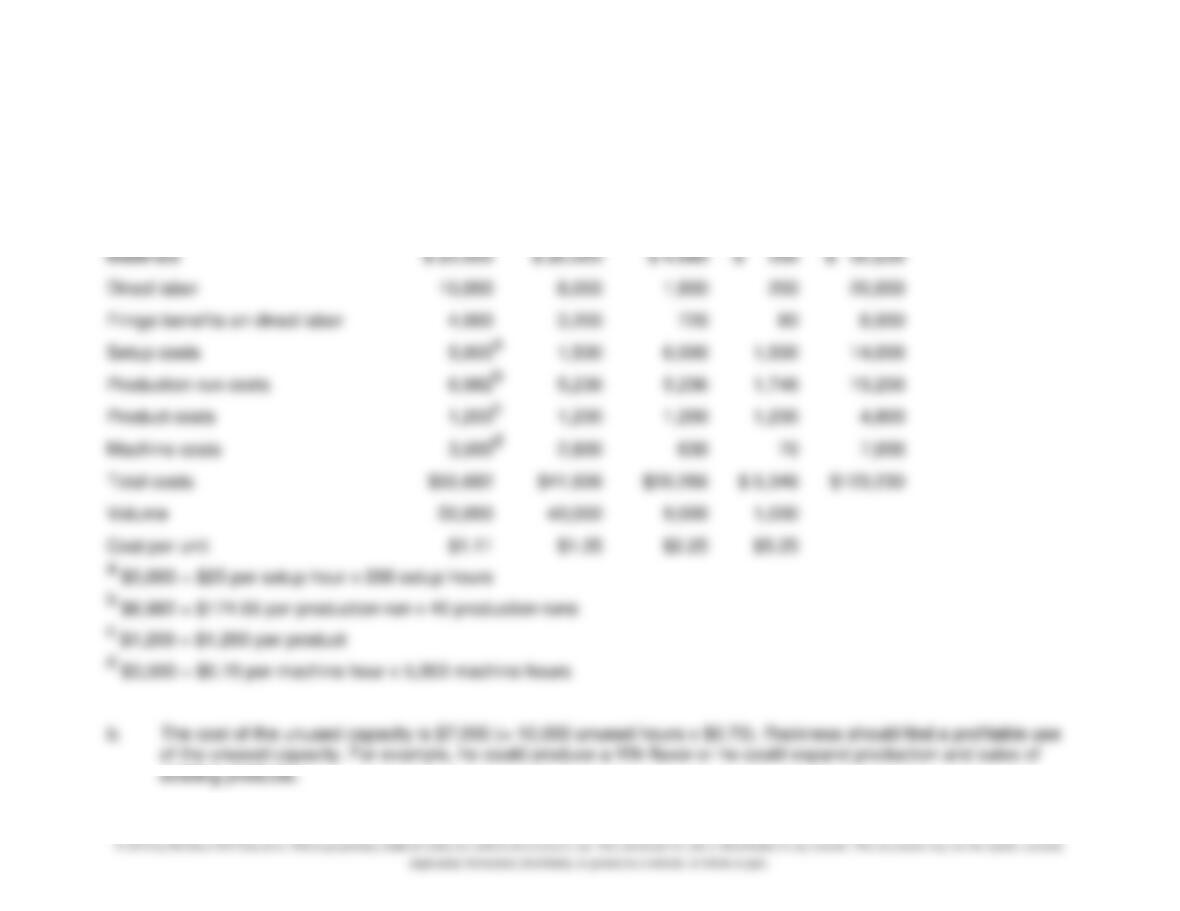
The only change is the cost driver rate for machine time:
Unit Costs on Cola Bottling Line
Diet
Regular
Cherry
Grape
Total
Materials
$ 25,000
$ 20,000
$ 4,680
$ 550
$ 50,230
Direct labor
10,000
8,000
1,800
200
20,000
Fringe benefits on direct labor
4,000
3,200
720
80
8,000
Setup costs
5,000
a
1,500
6,000
1,500
14,000
Production run costs
6,982
b
5,236
5,236
1,746
19,200
Product costs
1,200
c
1,200
1,200
1,200
4,800
Machine costs
3,500
d
2,800
630
70
7,000
Total costs
$55,682
$41,936
$20,266
$ 5,346
$123,230
Volume
50,000
40,000
9,000
1,000
Cost per unit
$1.11
$1.05
$2.25
$5.35
Chapter 10 – Fundamentals of Cost Management
10–61. (continued)
c.
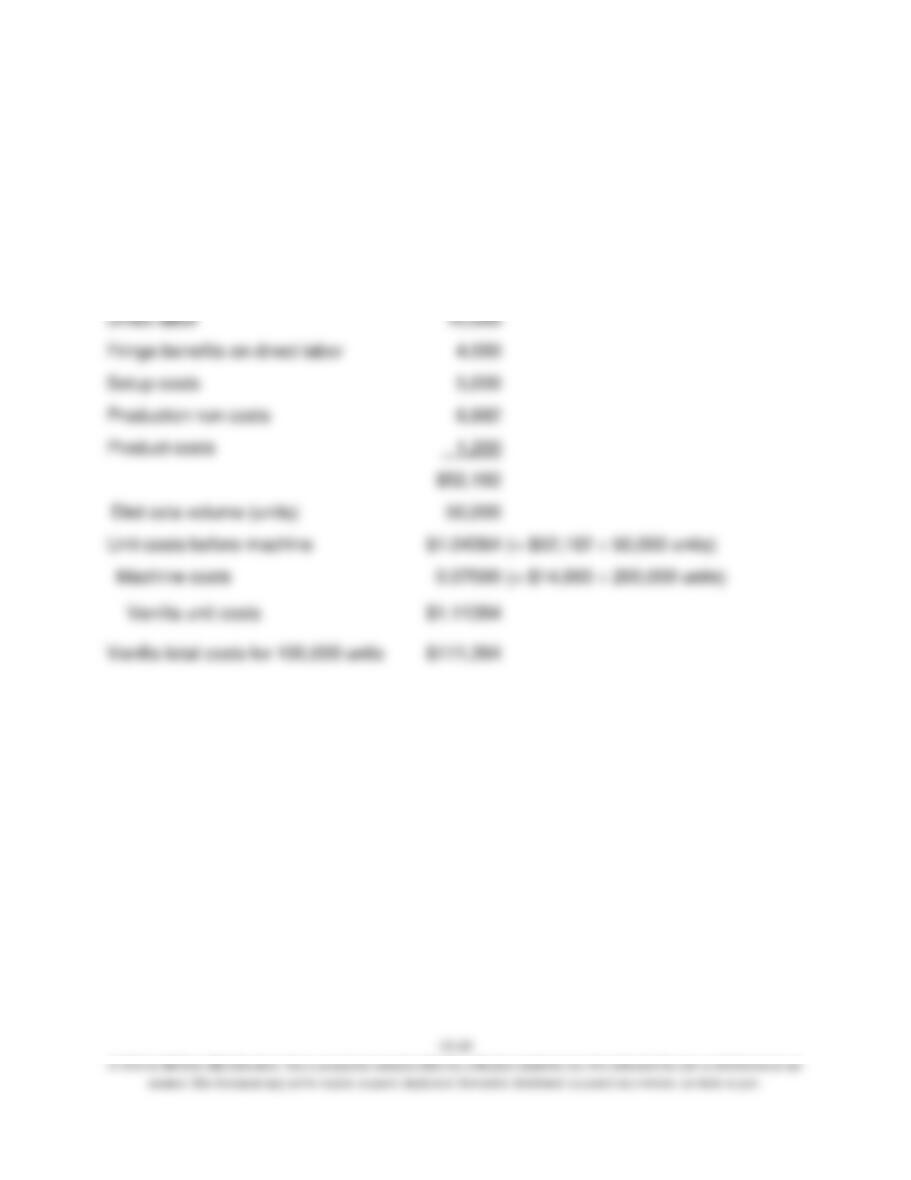
First, compute the costs per unit of Diet Cola, except for the machine costs:
Diet cola costs:
Materials
$ 25,000
Direct labor
10,000
Fringe benefits on direct labor
4,000
Setup costs
5,000
Production run costs
6,982
Product costs
1,200
$52,182
Diet cola volume (units)
50,000
Unit costs before machine
$1.04364
(= $52,182 ÷ 50,000 units)
Machine costs
0.07000
(= $14,000 ÷ 200,000 units)
Vanilla unit costs
$1.11364
Vanilla total costs for 100,000 units
$111,364