Chapter 10 – Fundamentals of Cost Management
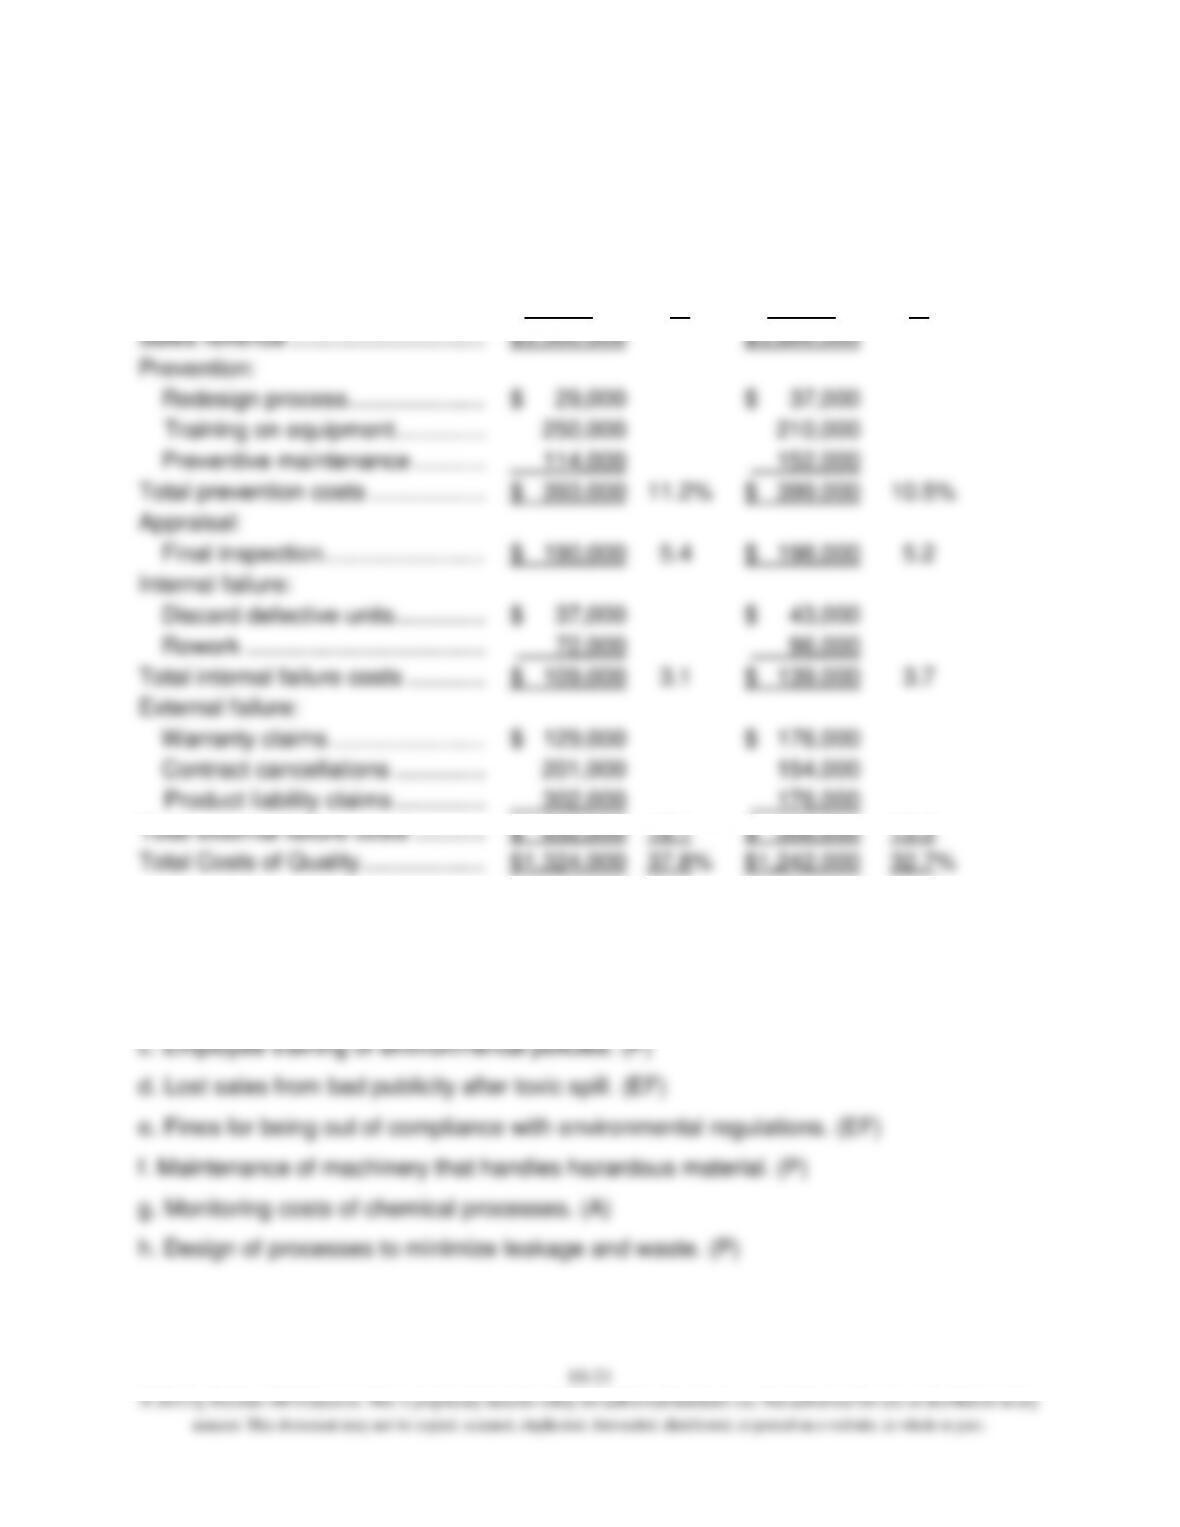
10–45. (30 min.) Trading-off Costs of Quality: Nuke-It-Now.
Nuke-It-Now Corporation
Cost of Quality Report
Year 1
%
Year 2
%
Sales revenue …………………………..
$3,500,000
$3,800,000
Prevention:
Redesign process …………………………..
$ 29,000
$ 37,000
Training on equipment …………..
250,000
210,000
Preventive maintenance ………..…………………
114,000
152,000
Total prevention costs …………………………..
$ 393,000
11.2%
$ 399,000
10.5%
Appraisal:
Final inspection …………………….…….
$ 190,000
5.4
$ 198,000
5.2
Internal failure:
Discard defective units …………..………………
$ 37,000
$ 43,000
Rework ……………………………….………………….
72,000
96,000
Total internal failure costs …………………………..
$ 109,000
3.1
$ 139,000
3.7
External failure:
Warranty claims …………………………..
$ 129,000
$ 176,000
Contract cancellations …………..………………
201,000
154,000
Product liability claims …………..………………
302,000
176,000
Total external failure costs ………..…………………
$ 632,000
18.1
$ 506,000
13.3
Total Costs of Quality ……………….………….
$1,324,000
37.8%
$1,242,000
32.7%
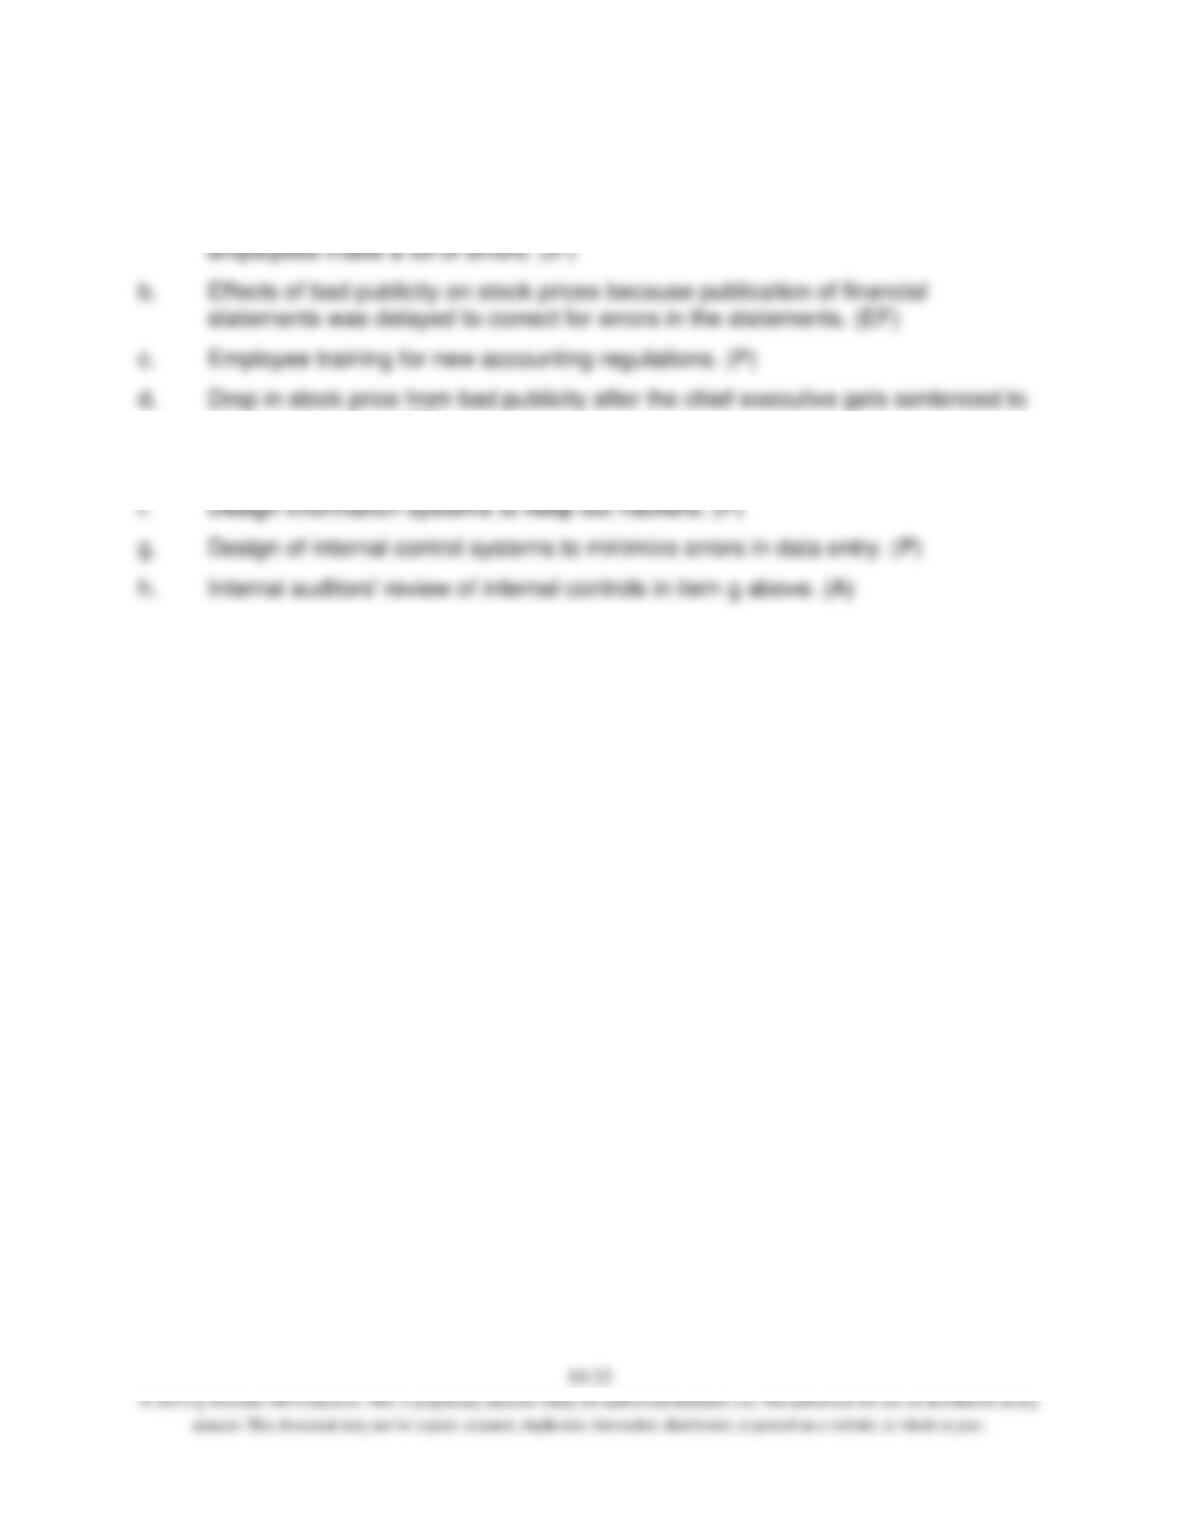
10–46. (15 min.) Cost of Quality—Environmental Issues.
a. Criminal penalties for illegal dumping. (EF)
b. Cleanup of leaks and spills on the plant floor. (IF)
Chapter 10 – Fundamentals of Cost Management
10–47. (15 min.) Cost of Quality—Financial Reporting Issues.
a. Extra work done by external auditors to complete the audit because new
10 years in prison. (EF)
e. Fines for failing to comply with accounting regulations. (EF)
Chapter 10 – Fundamentals of Cost Management
Solutions to Problems
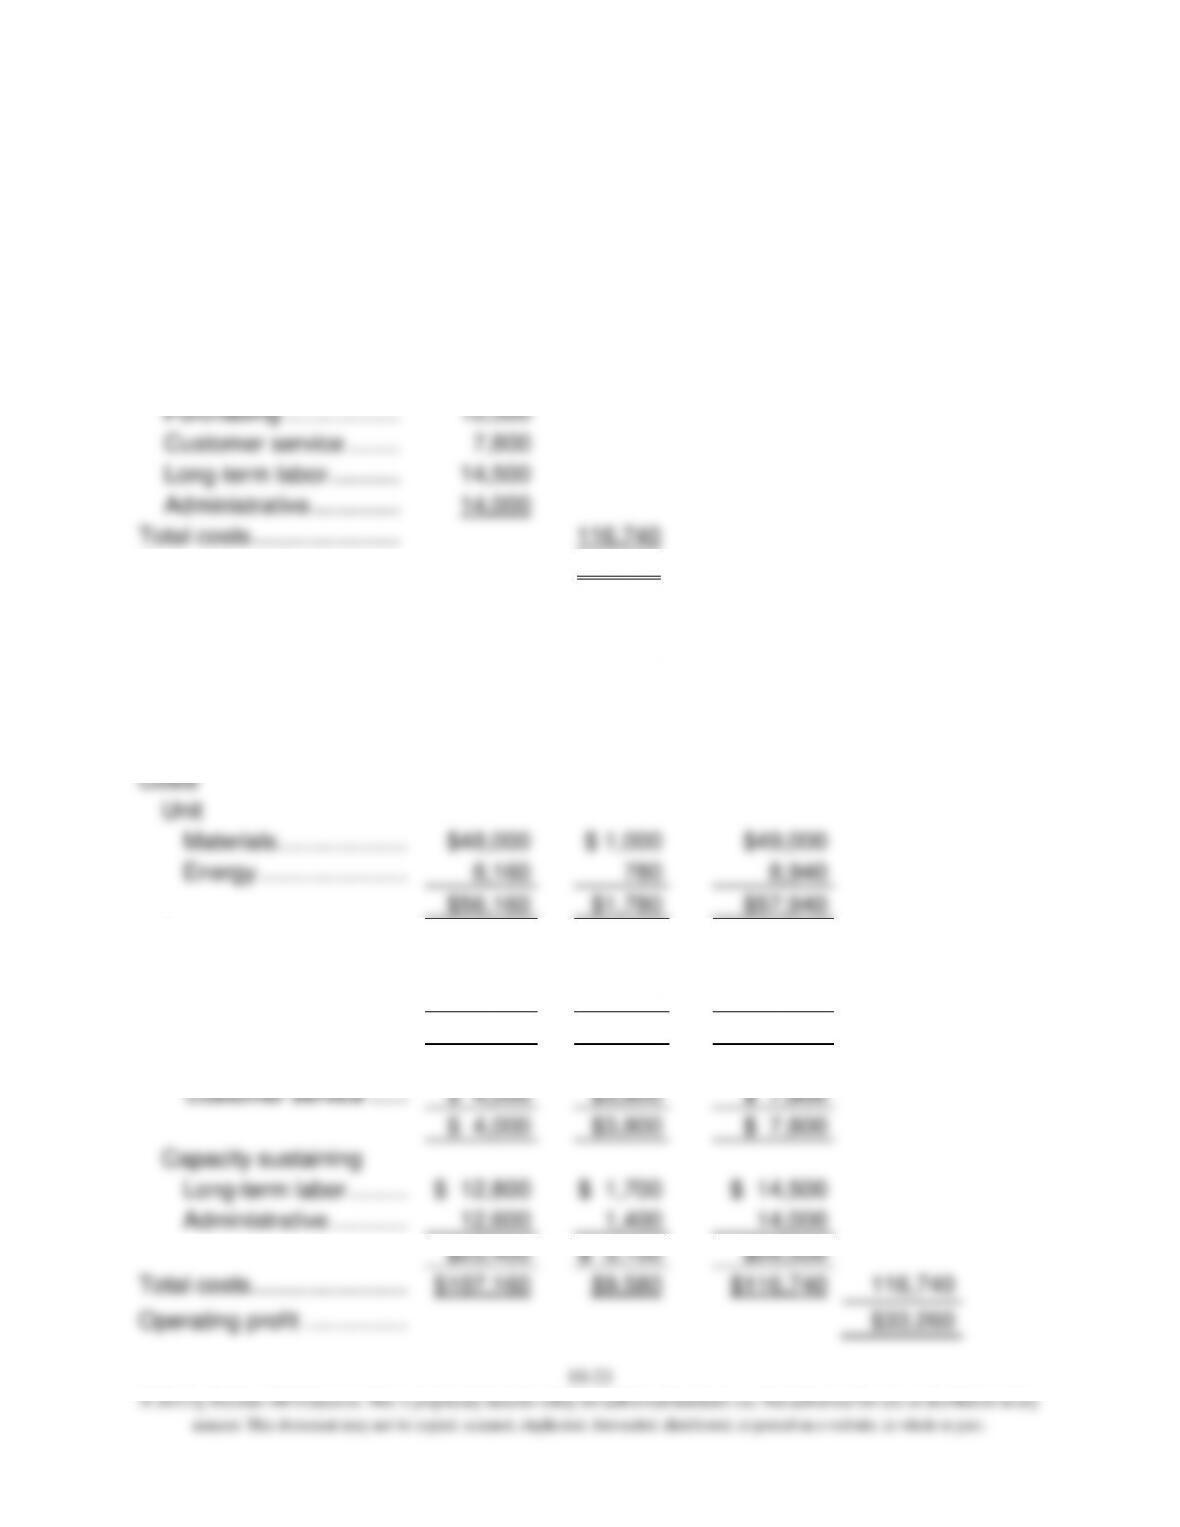
10–48. (50 min.) Activity-Based Reporting and Capacity: Gunnison Supply.
a.
Sales revenue ……………..
$150,000
Materials ………………….
$49,000
Energy …………………….
8,940
Setups …………………….
12,000
Purchasing ………………
10,500
Customer service ……..
7,800
Long-term labor ………..
14,500
Administrative …………..
14,000
Total costs …………………..
116,740
Operating profit ……………
$33,260
b.
Sales revenue
$150,000
Resources
Used
Unused
Resource
Capacity
Resources
Supplied
Costs
Unit
Materials ………………..…………
$48,000
$ 1,000
$49,000
Energy …………………..………
8,160
780
8,940
$56,160
$1,780
$57,940
Batch
Setups …………………..………
$ 12,000
$ -0-
$ 12,000
Purchasing …………….…………….
9,600
900
10,500
$ 21,600
$ 900
$ 22,500
Product and customer sustaining
Customer service …………………………..
$ 4,000
$3,800
$ 7,800
$ 4,000
$3,800
$ 7,800
Capacity sustaining
Long-term labor …………………………..
$ 12,800
$ 1,700
$ 14,500
Administrative …………………………..
12,600
1,400
14,000
$25,400
$ 3,100
$28,500
Total costs …………………………..
$107,160
$9,580
$116,740
116,740
Operating profit …………….…………….
$33,260
Chapter 10 – Fundamentals of Cost Management
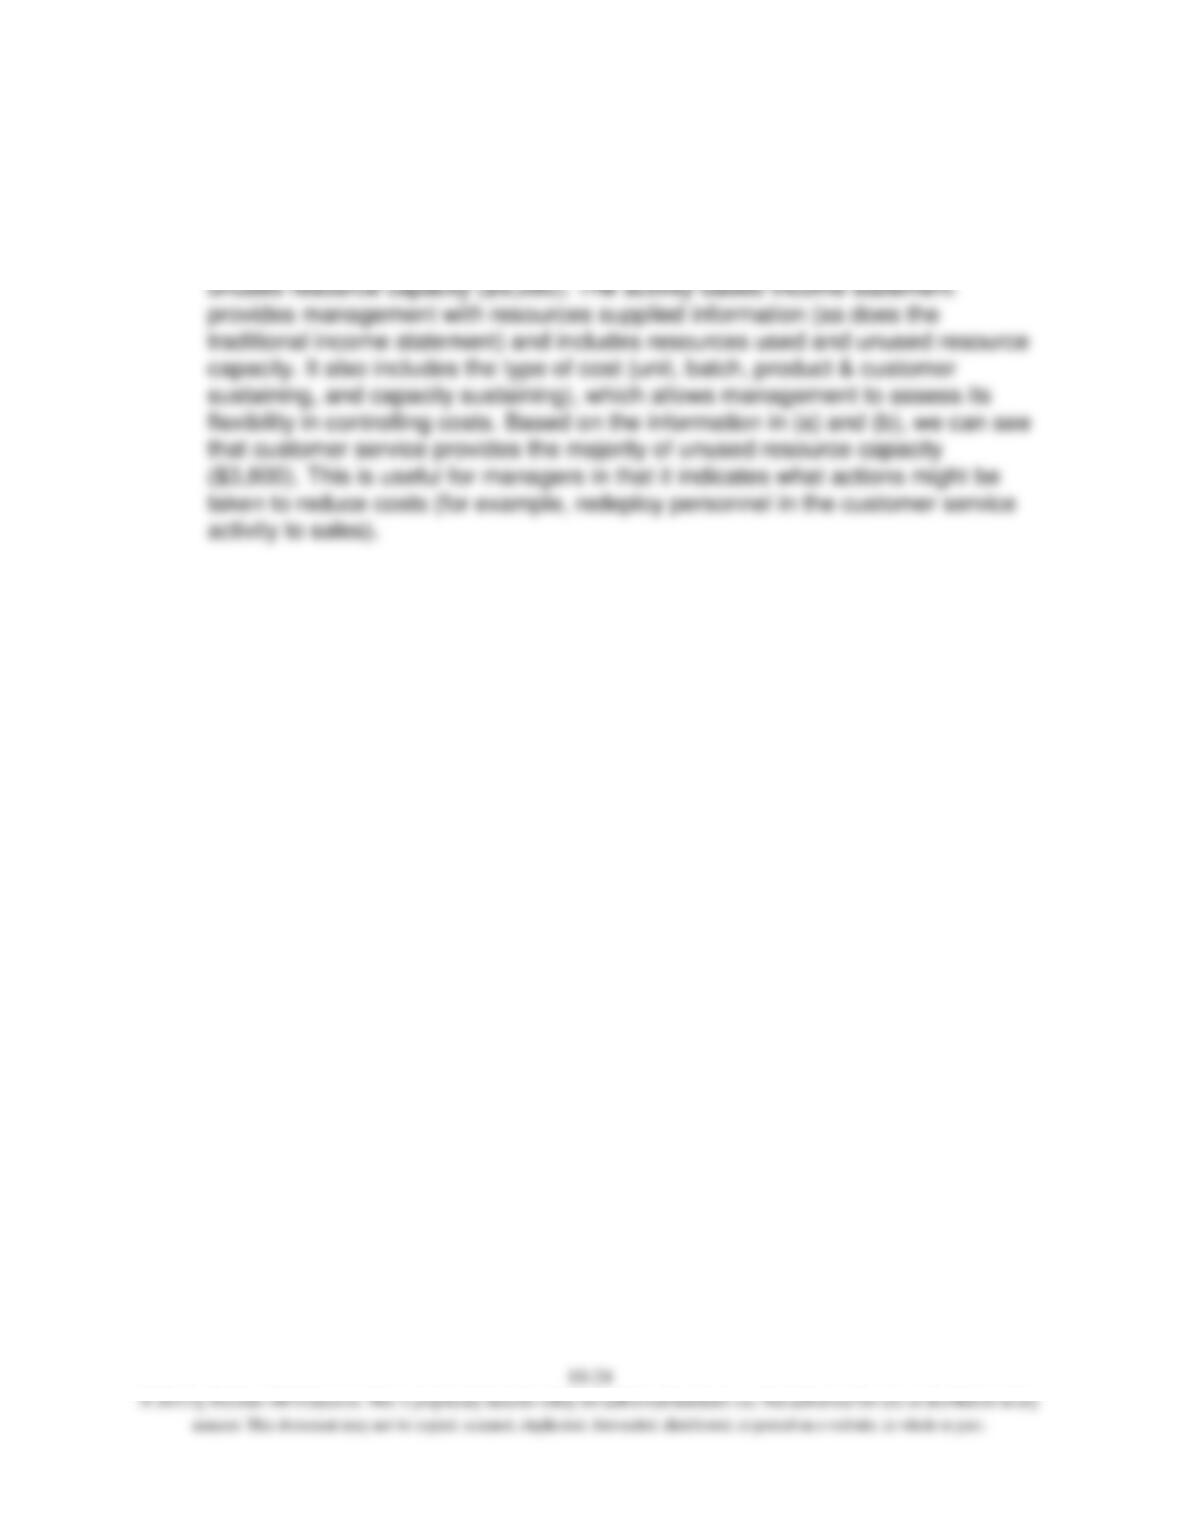
10–48. (continued)
c. A traditional income statement shows management resources supplied, but gives
no indication of the resources used and unused resource capacity. Management
has no way of knowing the amount of unused resource capacity or the cost of
Chapter 10 – Fundamentals of Cost Management
10–49. (50 min.) Activity-Based Reporting: Allcott Computer Services.
a.
Sales revenue ……………………………………
$1,350,000
Marketing ………………………………………
$120,000
Depreciation …………………………………..
89,500
Training personnel…………………………..
54,000
Energy …………………………………………..
85,500
Short-term labor ……………………………..
310,000
Long-term labor ………………………………
425,000
Administrative …………………………………
79,000
Repair verification …………………………..
42,000
Total costs …………………………………………
1,205,000
Operating profit ………………………………….
$ 145,000
b.
Sales revenue
$1,350,000
Resources
Used
Unused
Resource
Capacity
Resources
Supplied
Costs
Unit
Energy …………………………..
$80,000
$5,500
$ 85,500
Short-term labor …………………………..
225,000
85,000
310,000
$305,000
$90,500
$ 395,500
Batch
Repair verifications ……..……………………
$ 37,500
$ 4,500
$ 42,000
$ 37,500
$ 4,500
$ 42,000
Product and customer sustaining
Marketing…………………..………
$112,000
$ 8,000
$ 120,000
Training personnel …………………………..
45,000
9,000
54,000
$157,000
$ 17,000
$ 174,000
Capacity sustaining
Depreciation …………………………..
$87,000
$ 2,500
$ 89,500
Long-term labor ………….……………….
415,000
10,000
425,000
Administrative …………….…………….
70,000
9,000
79,000
$572,000
$ 21,500
$593,500
Total costs ……………………….….
$1,071,500
$133,500
$1,205,000
1,205,000
Operating profit ………………..…………
$ 145,000
Chapter 10 – Fundamentals of Cost Management
10-49. (continued)
c. A traditional income statement shows management resources supplied, but gives
no indication of the resources used and unused resource capacity. Management
has no way of knowing the amount of unused resource capacity or the cost of
10–50. (50 min.) Customer Profitability: SkiBlu, Ltd.
a.
Customer Costs
Gold
Silver
Number of customers ………
30,000
70,000
Number of customer representatives
30
7
Average gross margin per customer ……….
$330
$105
Total gross margin ($330 x 30,000; $105 x 70,000)
$9,900,000
$7,350,000
Customer representative salary (@ $35,000 per
customer representative)
1,050,000
245,000
Customer representative bonus (@ 10% of gross
margin)
990,000
735,000
Promotion costs (90% gold; 10% silver)…
3,600,000
400,000
Excess of gross margin over customer cost
$4,260,000
$5,970,000
b. Silver customers are more profitable than gold customers after considering the
costs of the representative.
Chapter 10 – Fundamentals of Cost Management
10–51. (50 min.) Customer Profitability: Lighthouse Company.
a.
Customer Costs
Premium
Standard
Number of customers …………………………………………...
2,000
8,000
Number of customer representatives ……………………...
20
8
Average gross margin per customers ……………………..
$1,500
$150
Total gross margin ($1,500 x 2,000; $150 x 8,000) …...
$3,000,000
$1,200,000
Customer representative salary (@ $60,000 per
customer representative) ……………………………………....
1,200,000
480,000
Customer representative bonus (@ 1% of gross
margin) ……………………………………………………………....
30,000
12,000
Promotion costs (80% premium; 20% standard) ……....
800,000
200,000
Excess of gross margin over customer cost ……………..
$970,000
$508,000
b. Premium customers are more profitable even after considering the cost of
representatives.
10–52. (30 min.) Activity-Based Costing of Suppliers: JFI Foods.
The effective price is the price to buy a “good” ton of feedstock. This can be
computed as the bid price divided by the yield (the ratio of good output to total
input).
Rex
Materials
Red Oak
Chemicals
Tons purchased ………………………..
1,350
2,250
Good output …………………………....
1,242
1,548
Yield (good output ÷ purchased) ....
92.0%
68.8%
Quoted price ……………………………..
$180
$140
Effective cost per ton (a) …………....
$195.65
$203.49
(a) $195.65 = $180 ÷ 92.0%; $203.49 = $140 ÷ 68.8%
Chapter 10 – Fundamentals of Cost Management
10–53. (20 min.) Activity-Based Costing of Suppliers: JFI Foods.
a. $156.52. If Red Oak has an exclusive contract, the price per ton, adjusted for
an 80% yield, should be no more than the effective price that JFI pays Rex
Materials ($195.65). This price can be determined by solving the following
to 80%.)
10–54. (50 min.) Activity-Based Reporting: Leidenheimer Corporation.
a.
Sales revenue ………………….……….
$1,700,000
Parts management …………………………..
$ 70,000
Energy …………………………….…………………………
100,000
Quality inspections …………………………..
100,000
Long-term labor ………………..…………
70,000
Short-term labor ……………….………….
48,000
Setups …………………………….…………………………
200,000
Materials …………………………..
300,000
Depreciation …………………….…….
200,000
Marketing ………………………..…
150,000
Customer service ……………..……………
40,000
Administrative …………………..………
140,000
Engineering changes ………..…………………
50,000
Outside contracts ……………..……………
60,000
Total costs ……………………….….
1,528,000
Operating profit ………………..…………
$ 172,000
Chapter 10 – Fundamentals of Cost Management
10–54. (continued)
b.
Sales revenue
$1,700,000
Resources
Used
Unused
Resource
Capacity
Resources
Supplied
Costs
Unit
Parts management ………..…………………
$ 60,000
$
10,000
$ 70,000
Energy …………………………..
100,000
0
100,000
Short-term labor …………………………..
40,000
8,000
48,000
Materials …………………………..
300,000
0
300,000
Outside contracts ………….……………….
60,000
0
60,000
$560,000
$ 18,000
$578,000
Batch
Quality inspections ………..…………………
$ 90,000
$ 10,000
$100,000
Setups …………………………..
140,000
60,000
200,000
$230,000
$ 70,000
$300,000
Product and customer sustaining
Marketing ………………….……….
$ 140,000
$ 10,000
$150,000
Customer service ……….………………….
20,000
20,000
40,000
Engineering changes ….……………………….
50,000
0
50,000
$210,000
$ 30,000
$240,000
Capacity sustaining
Long-term labor ………….……………….
$ 50,000
$ 20,000
$ 70,000
Depreciation …………………………..
120,000
80,000
200,000
Administrative …………….…………….
100,000
40,000
140,000
$270,000
$ 140,000
410,000
Total costs ……………………….….
$1,270,000
$258,000
$1,528,000
1,528,000
Operating profit ………………..…………
$ 172,000
Chapter 10 – Fundamentals of Cost Management
10–54. (continued)
c. A traditional income statement shows management resources supplied, but gives
no indication of the resources used and unused resource capacity. Management
has no way of knowing the amount of unused resource capacity or the cost of