5-51 (continued)
b. Using the results from the “improved” regression, the cost equation for overhead
costs can be written as:
5-52. (30 Min.) Interpretation of Regression Results: Lerner, Inc.
a. The letter b is best described as the estimate of the maintenance cost for an hour of
©The McGraw-Hill Companies, Inc., 2014
208 Fundamentals of Cost Accounting
5-53. (30 Min.) Cost Estimation—Simple Regression: Arnie’s Arcade & Video
Palace.
a. Yes. We would expect that, in general, there is a positive relation between
maintenance costs and activity. Revenue seems to be a reasonable measure of
activity.
5-54. (40 min.) Methods of Cost Analysis—Account Analysis, Simple and Multiple
Regression Using a Spreadsheet (Appendix A): Caiman Distribution
Partners.
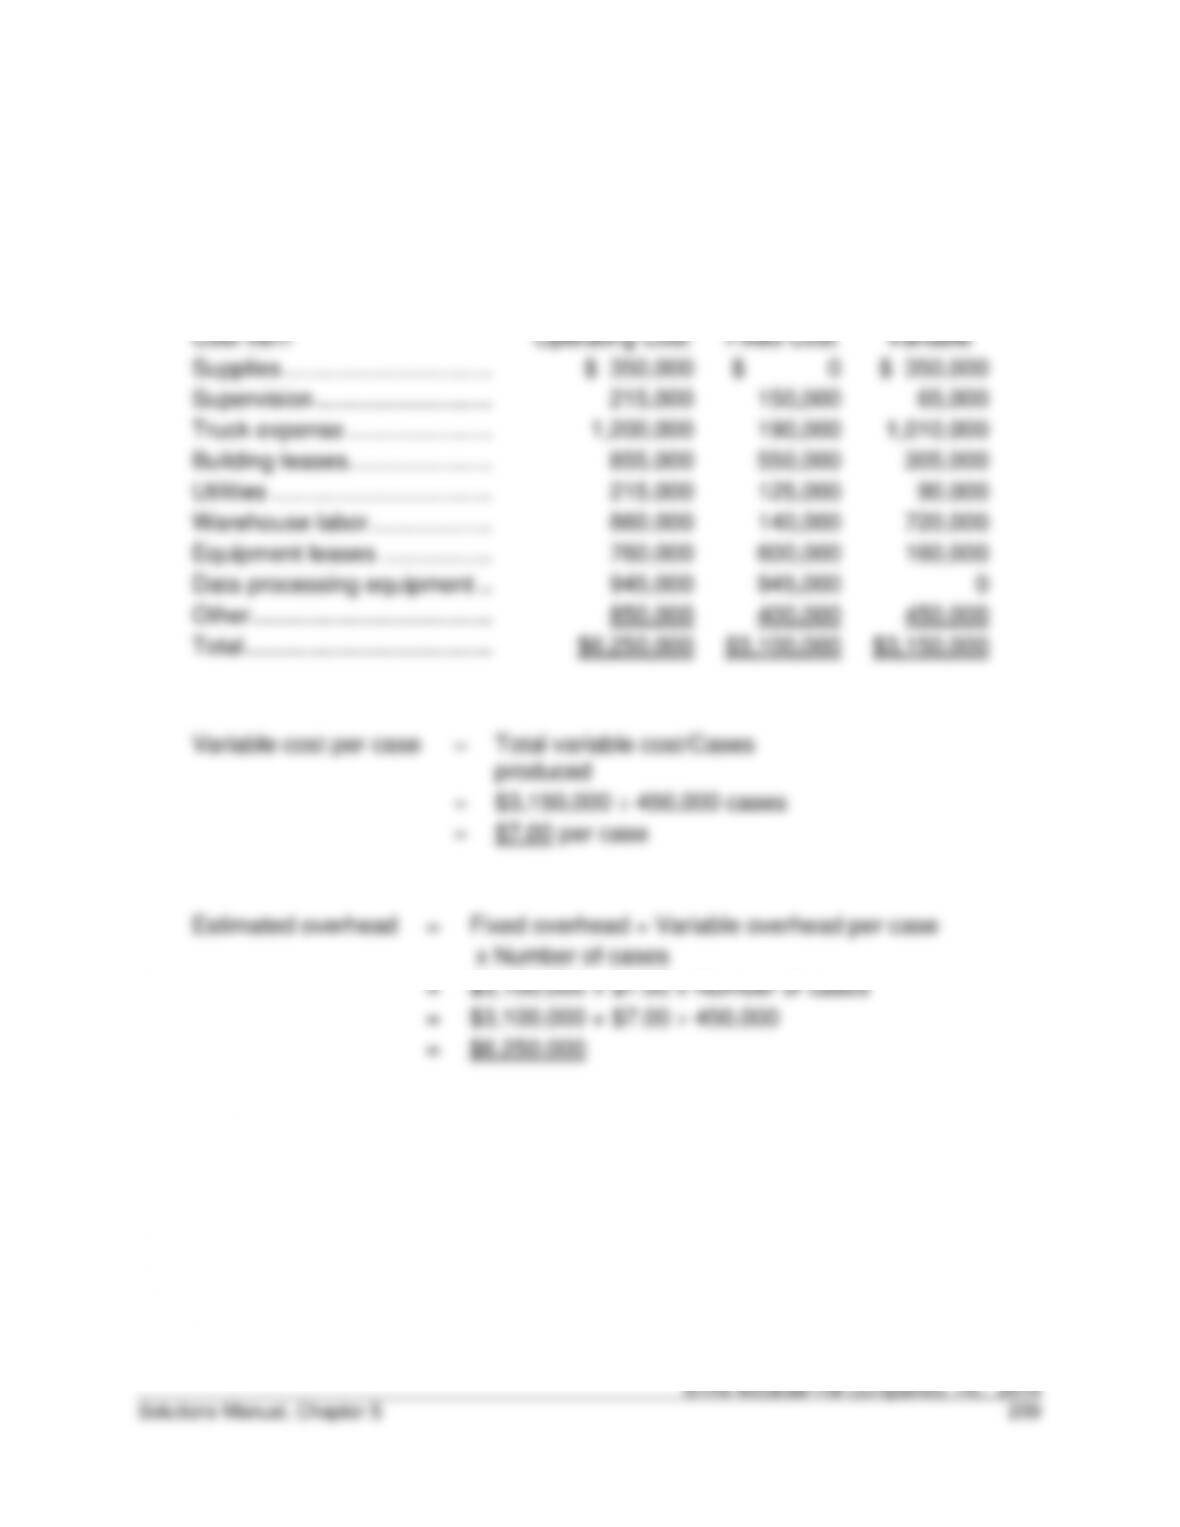
a. Estimating equation based on account analysis:
Cost Item
Operating Cost
Fixed Cost
Variable
Supplies …………………………..
$ 350,000
$ 0
$ 350,000
Supervision ………………………
215,000
150,000
65,000
Truck expense ………………….
1,200,000
190,000
1,010,000
Building leases ………………….
855,000
550,000
305,000
Utilities …………………………….
215,000
125,000
90,000
Warehouse labor ……………….
860,000
140,000
720,000
Equipment leases ……………..
760,000
600,000
160,000
Data processing equipment ..
945,000
945,000
0
Other ……………………………….
850,000
400,000
450,000
Total ………………………………..
$6,250,000
$3,100,000
$3,150,000
Variable cost per case
=
Total variable cost/Cases
produced
=
$3,150,000 ÷ 450,000 cases
=
$7.00 per case
Estimated overhead
=
Fixed overhead + Variable overhead per case
x Number of cases
=
$3,100,000 + $7.00 x Number of cases
=
$3,100,000 + $7.00 450,000
=
$6,250,000
©The McGraw-Hill Companies, Inc., 2014
210 Fundamentals of Cost Accounting
5-54. (continued)
b. Cost estimate using high-low analysis.
Cases
Operating
Costs
Highest activity (month 12) …………………….
432,000
$6,362,255
Lowest activity (month 1) ……………………….
345,000
$5,699,139
Variable cost =
Cost at highest activity – cost at lowest activity
Highest activity – lowest activity
=
$6,362,255 – $5,699,139
432,000 – 345,000
= $7.62202 per case
Fixed
costs
=
Total costs – variable costs
=
$6,362,255 – $7.62202 x 432,000
=
$3,069,542
or
Fixed
costs
=
$5,699,139 – $7.62202 x 345,000
=
$3,069,542
The cost equation then is:
Overhead costs = $3,069,542 + ($7.622 per case x Cases).
For 450,000 cases:
Operating costs
=
$3,069,542 + $7.622 x 450,000
=
$6,499,442
5-54. (continued)
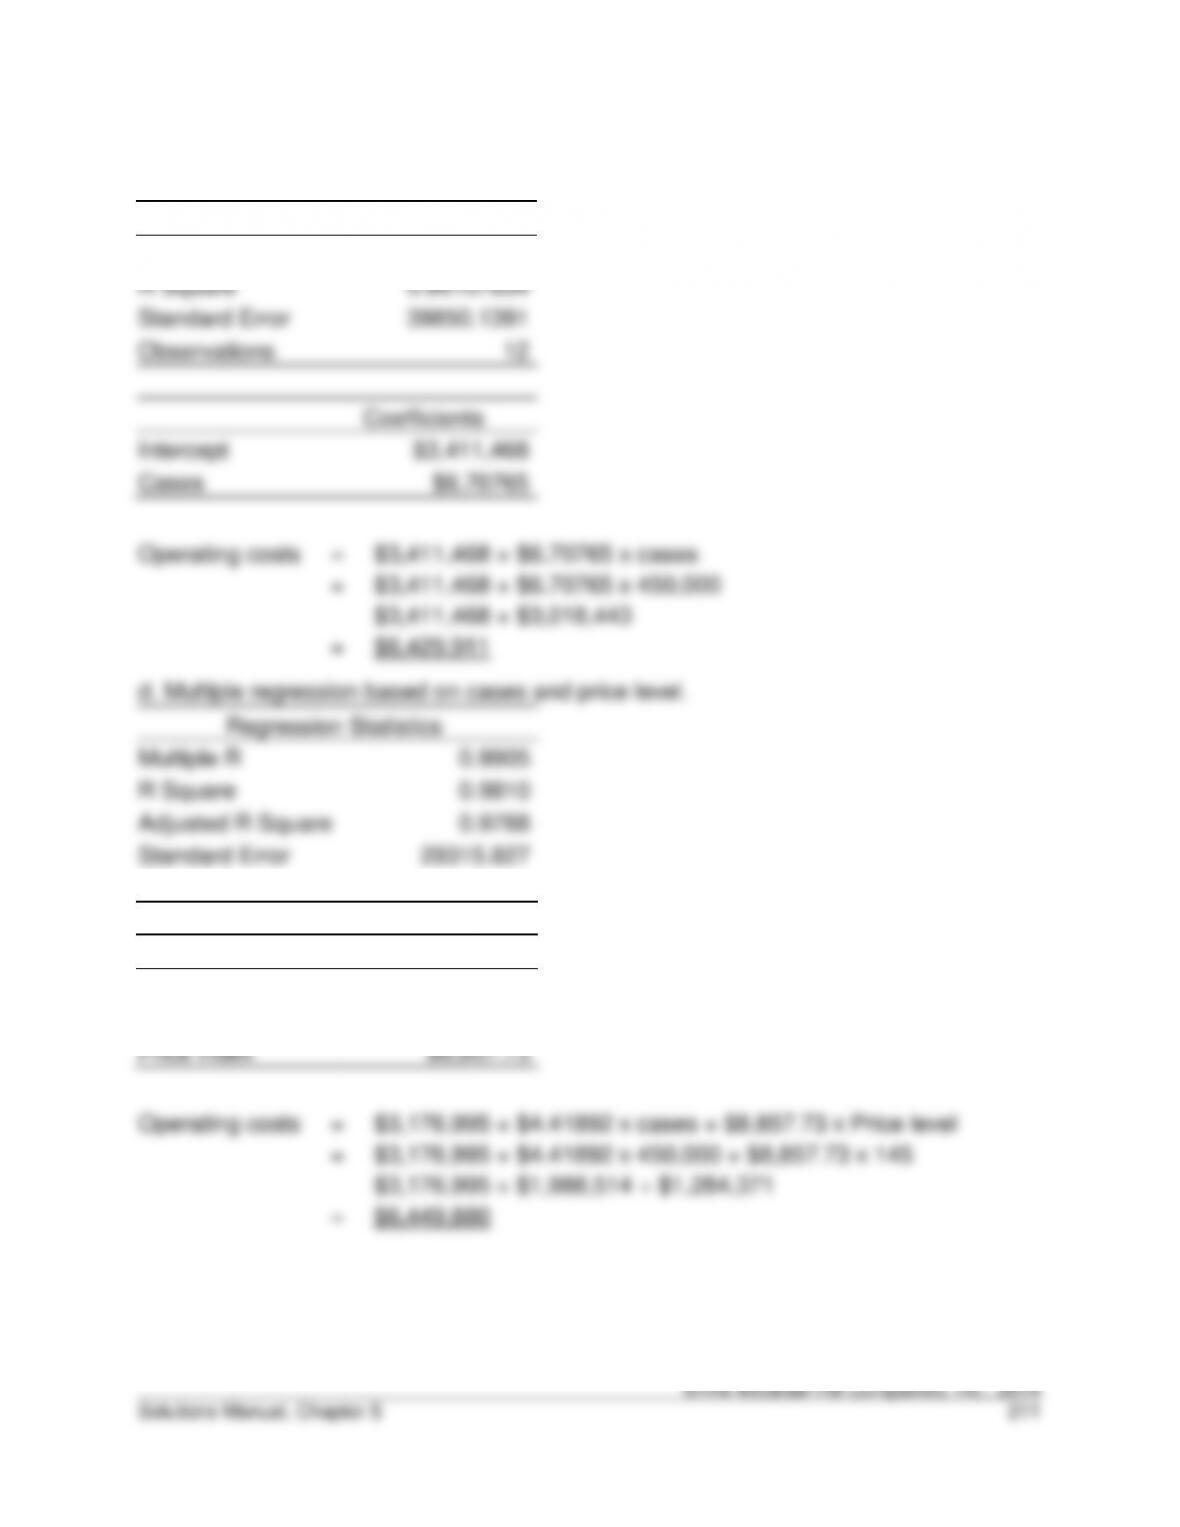
c. Simple regression based on cases:
Regression Statistics
Multiple R
0.98034501
R Square
0.96107634
Standard Error
39850.1391
Observations
12
Coefficients
Intercept
$3,411,468
Cases
$6.70765
Operating costs
=
$3,411,468 + $6.70765 x cases
=
$3,411,468 + $6.70765 x 450,000
$3,411,468 + $3,018,443
=
$6,429,911
d. Multiple regression based on cases and price level.
Regression Statistics
Multiple R
0.9905
R Square
0.9810
Adjusted R Square
0.9768
Standard Error
29315.827
Observations
12
Coefficients
Intercept
$3,176,995
Cases
$4.41892
Price Index
$8,857.73
Operating costs
=
$3,176,995 + $4.41892 x cases + $8,857.73 x Price level
=
$3,176,995 + $4.41892 x 450,000 + $8,857.73 x 145
$3,176,995 + $1,988,514 + $1,284,371
=
$6,449,880
©The McGraw-Hill Companies, Inc., 2014
212 Fundamentals of Cost Accounting
5-54. (continued)
e. Recommendation.
The multiple regression appears to improve the “fit” (compare the adjusted R2’s), but