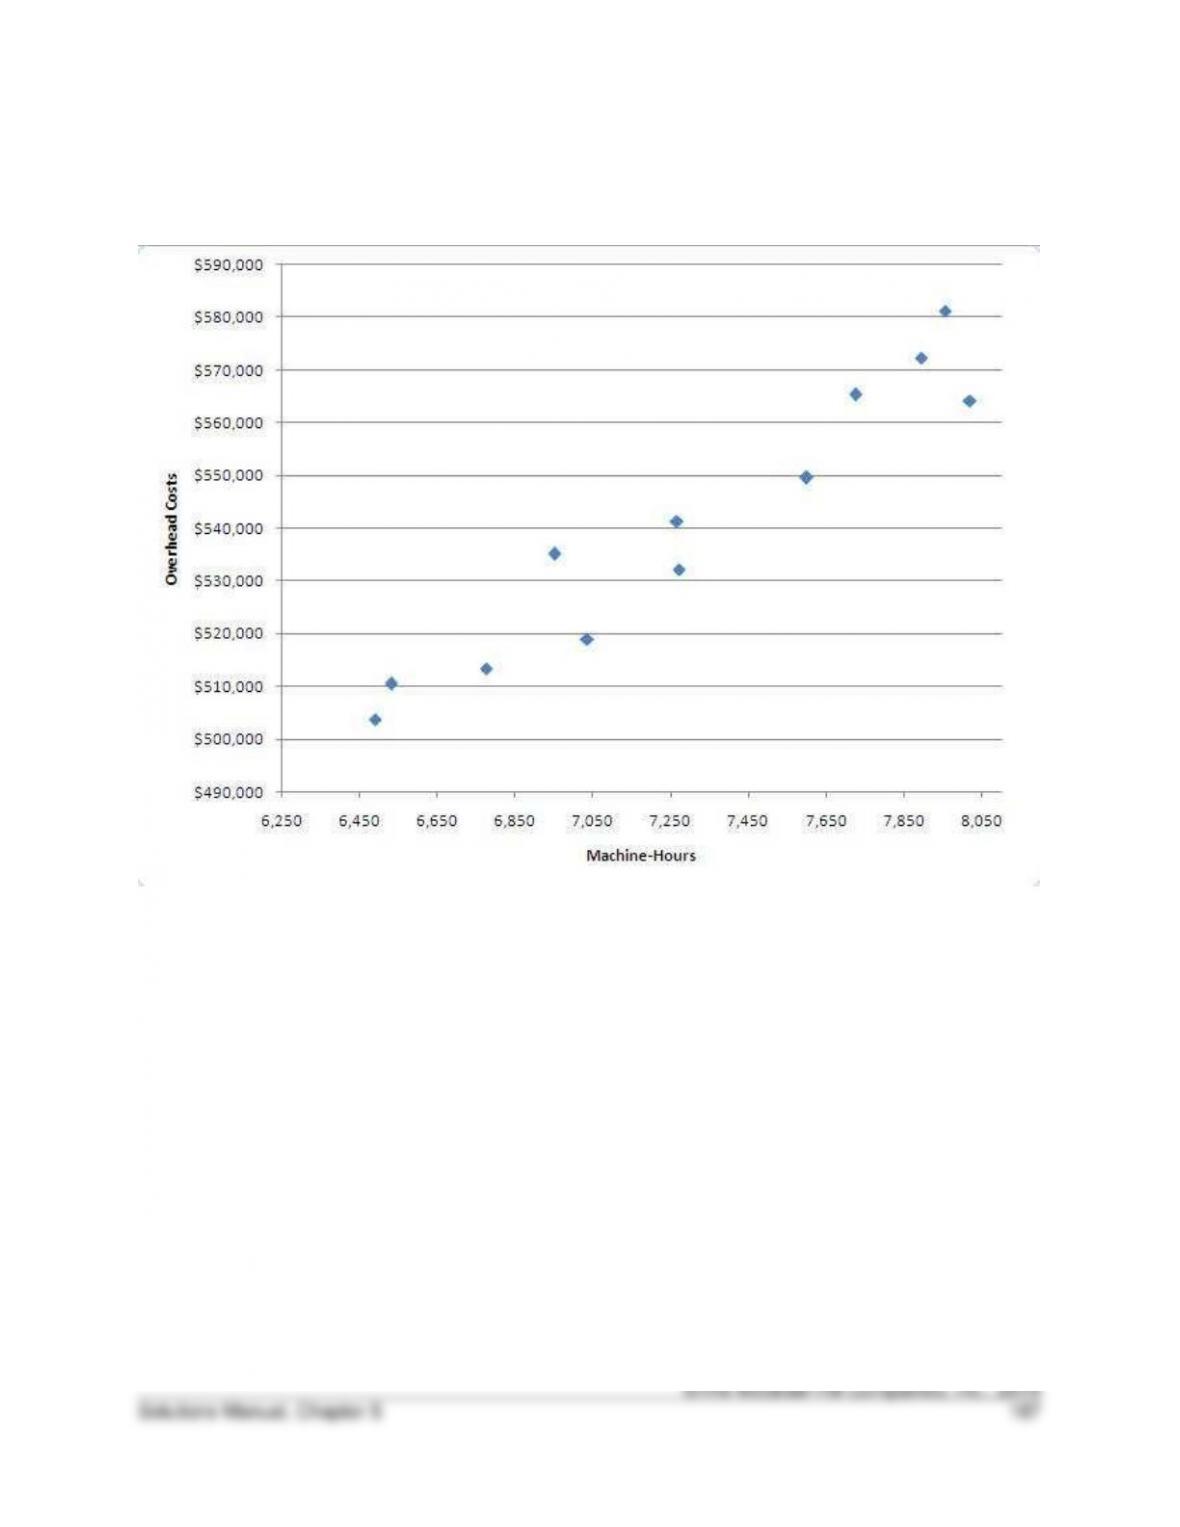
5-31. (15 min.) Methods of Estimating Costs—Scattergraph: Adriana Corporation.
©The McGraw-Hill Companies, Inc., 2014
188 Fundamentals of Cost Accounting
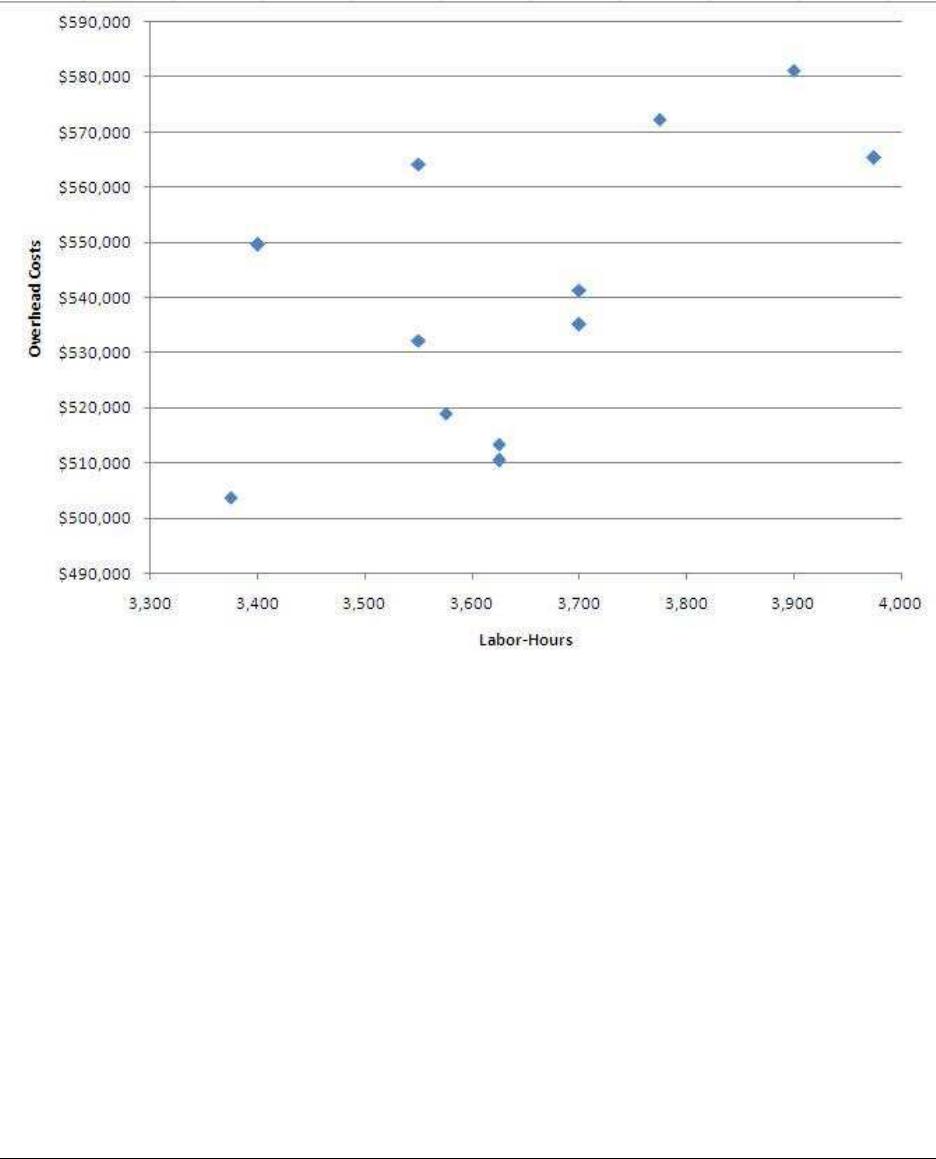
5-32. (15 min.) Methods of Estimating Costs—Scattergraph: Adriana
Corporation.
5-33. (10 min.) Methods of Estimating Costs—Simple Regression: Adriana
Corporation.
5-36. (20 min.) Interpretation of Regression Results—Multiple Choice: Cortez
Company.
a. (1) R2 = .848 (84.8%), the explanation of variation in Y from the X regressor.
5-37. (15 min.) Interpretation of Regression Results: Brodie Company.
This problem is frequently encountered when applying analytical techniques to certain
costs. Quite often the advertising expenditures result in sales being generated in the
5-38. (15 min.) Interpretation of Regression Results: Ross Enterprises.
This problem is frequently encountered when applying analytical techniques to certain
©The McGraw-Hill Companies, Inc., 2014
192 Fundamentals of Cost Accounting
5-39. (30 min.) Interpretation of Regression Results—Simple Regression: Fred’s
Fish Fry.
a. Estimation equation for nonfood kitchen costs:
Nonfood kitchen costs
=
Fixed costs + Variable cost as a percentage of food cost
=
$14,000 + 225% Food cost
b.
Nonfood kitchen costs
=
$14,000 + 225% Food cost
=
$14,000 + 225% x $15,000
=
$14,000 + $33,750
=
$47,750
c.
The R2 for the equation is only 23.3%, which is very low for this type of regression. Fred
should consider identifying other cost drivers and using them to estimate other nonfood
kitchen costs.
5-40. (20 min.) Learning Curves: General Dynamics.
5-42. (20 min.) Learning Curves (Appendix B).
The formula for the time to produce unit z is Y =100 z–0.3219.
Solutions to Problems
5-43. (20 min.) Account Analysis.
a.
Activity
Total Cost
÷
Volume
=
Unit Cost
Process paychecks
($180,100
÷
15,945 checks)
=
$11.30
Maintain customer accounts
($109,600
÷
3,650 accounts)
=
30.03
Perform special analyses
($120,000
÷
30 analyses)
=
4,000.00
b. The average fixed costs for a month are $34,391 (= $550,250 ÷ 16 months).
For 1,000 checks, 200 accounts, and 3 analyses, the estimated cost is:
$63,697 = $34,391 + (1,000 x $11.30) + (200 x $30.03) + (3 x $4,000).
5-44. Regressions from Published Data.
a. Answers will vary. The degree to which estimates based on the first twelve months
5-45. Regressions from Published Data.
a. Answers will vary. This is an estimate of the variable cost per dollar of sales
revenue.
©The McGraw-Hill Companies, Inc., 2014
196 Fundamentals of Cost Accounting
5-46. (30 min.) High-Low Method, Scattergraph: Cubicle Solutions.
a. High-low estimate
Support
Calls
Call Center
Cost
Highest activity (month 5) …………………….
61
$720
Lowest activity (month 1) ……………………..
37
528
Variable cost =
Cost at highest activity – cost at lowest activity
Highest activity – lowest activity
=
$720 – $528
61 – 37
= $8.00 per support call
Fixed costs
=
Total costs – variable costs
=
$720 – $8.00 x 61
=
$232
or
Fixed costs
=
$528 – $8.00 x 37
=
$232
The cost equation is:
Overhead costs = $232 + ($8.00 per call x Support calls)