Chapter 03 – Fundamentals of Cost-Volume-Profit Analysis
3-1
© 2014 by McGraw-Hill Education. This is proprietary material solely for authorized instructor use. Not authorized for sale or distribution in any
manner. This document may not be copied, scanned, duplicated, forwarded, distributed, or posted on a website, in whole or part.
Chapter 3
Fundamentals of Cost-Volume-Profit Analysis
Solutions to Review Questions
3-1.
Profit
=
operating profit,
TR
=
total revenue,
TC
=
total costs,
P
=
average unit selling price,
V
=
average unit variable cost,
X
=
quantity of units,
F
=
total fixed costs for the period.
3-2.
Total costs = Total variable costs plus total fixed costs.
3-3.
Total contribution margin: Total selling price – Variable manufacturing costs expensed –
3-4.
3-5.
Profit
=
TR – TC
=
PX – VX – F
=
(P – V)X – F
Chapter 03 – Fundamentals of Cost-Volume-Profit Analysis
3-2
3-6.
3-7.
3-8.
Target volume (units)
=
Fixed costs + [Target profit/(1-t)]
Unit contribution margin
3-9.
Income taxes do not affect the break-even equation because with zero income
(breakeven), there are no income taxes to pay.
3-10.
It is common to assume a fixed sales mix when solving for break-even volumes with
3-11.
Two common assumptions in CVP analysis are that unit prices and unit variable costs are
constant. It is also common to assume that fixed costs are constant over relatively large
Chapter 03 – Fundamentals of Cost-Volume-Profit Analysis
3-3
Solutions to Critical Analysis and Discussion Questions
3-12.
There may be a difference between costs used in cost-volume-profit analysis and costs
expensed in financial statements. A common example is fixed manufacturing costs. Cost–
3-13.
The accountant makes use of a linear representation to simplify the analysis of costs and
revenues. These simplifying assumptions are generally reasonable within a relevant
3-14.
As volume rises, it is likely that product markets will be saturated, leading to a need to cut
prices to maintain or increase volume. This price-cutting would result in a nonlinear
revenue function with a slope that becomes less steep (though still positive) as volume
3-15.
Although the assumptions of CVP analysis appear relatively simplistic, CVP analysis is a
useful tool for understanding the relations among costs, volumes, and the resulting profit.
3-16.
Although there are no “profits” in a not-for-profit organization, these organizations are still
very concerned about the difference between inflows (from fees, grants, sales, or other
3-4
© 2014 by McGraw-Hill Education. This is proprietary material solely for authorized instructor use. Not authorized for sale or distribution in any
manner. This document may not be copied, scanned, duplicated, forwarded, distributed, or posted on a website, in whole or part.
sources) and costs. Often the term “surplus” will be used in place of profit and the
methods of CVP analysis can be applied in the same way that it is in a for-profit firm.
3-17.
Most business schools have relatively high fixed costs when volume is measured by the
number of students. Examples of these costs would be plant (buildings and grounds),
3-18.
High (or low) operating leverage is not a good (or bad) thing. It is the result of managerial
decisions about the resources to be used (and the structure of the costs that result).
3-19.
The “product” or “service” for an airline consists of a flight between two city-pairs (for
example, Los Angeles to San Francisco). As you can imagine, the number of “products”
Chapter 03 – Fundamentals of Cost-Volume-Profit Analysis
Solutions to Exercises
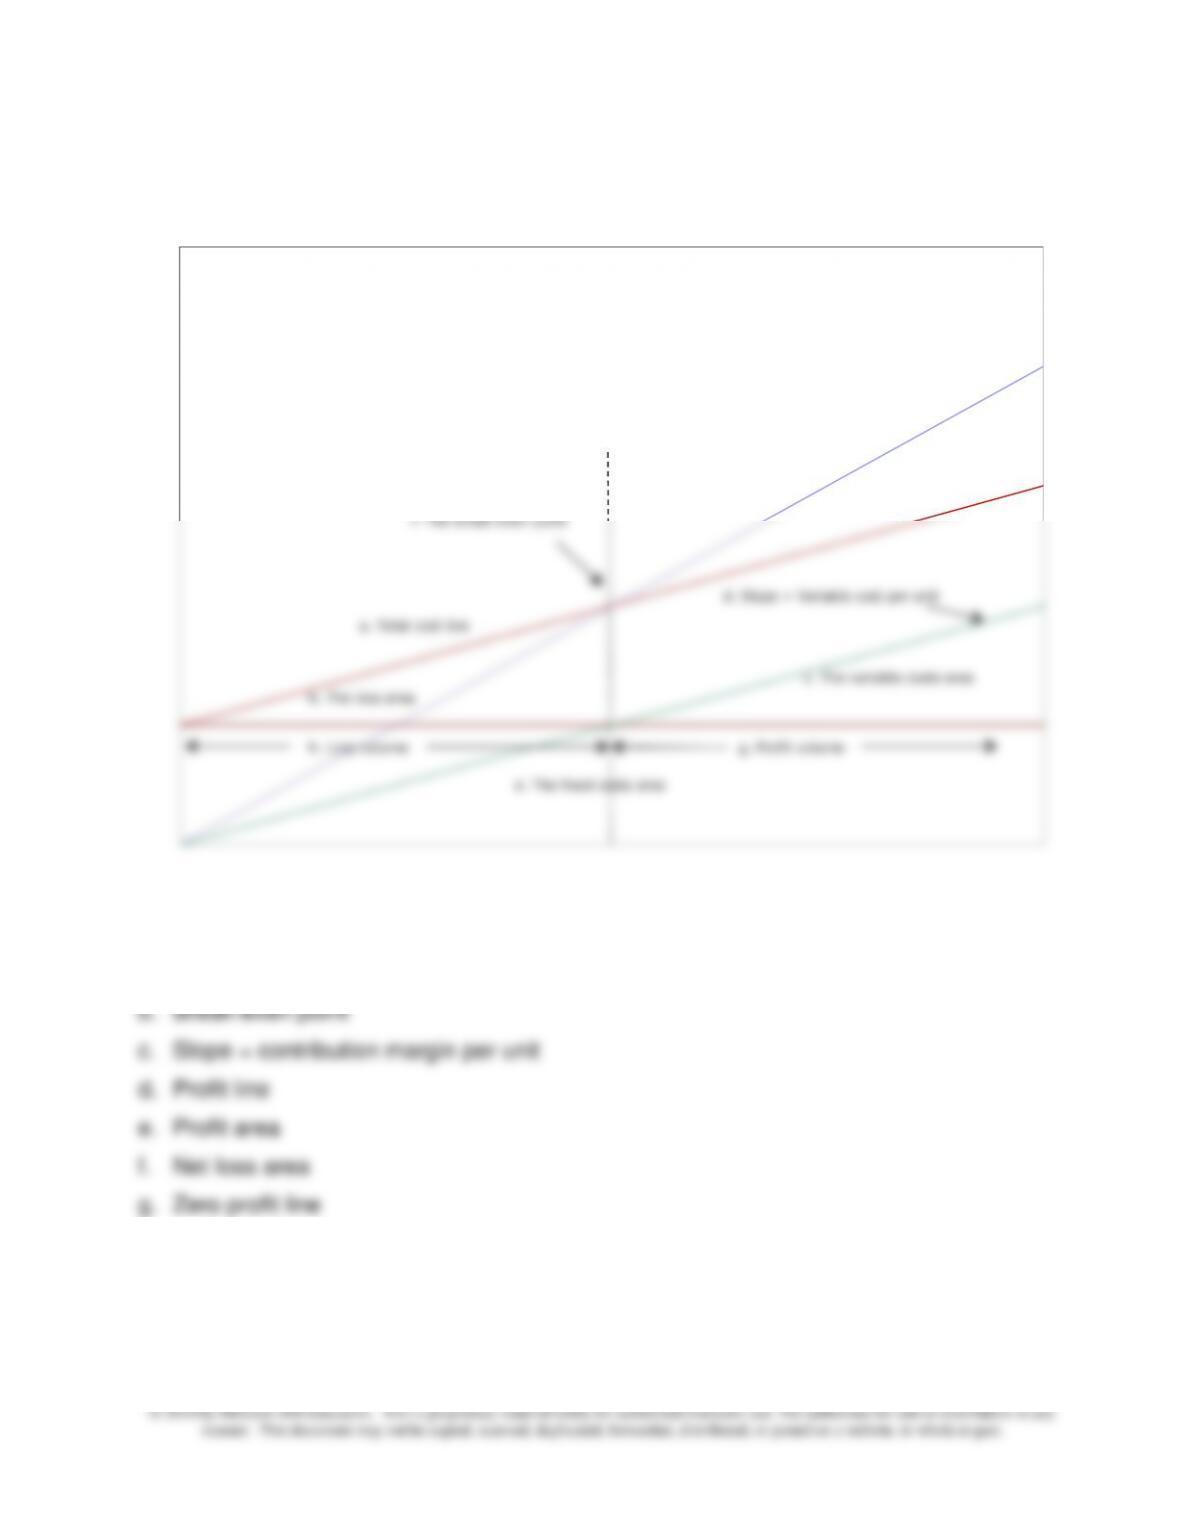
3-20. (15 min.) Profit Equation Components.
b. Total revenue line
a. Total cost line
c. The variable costs area
d. Slope = Variable cost per unit
e. The fixed costs area
f. The break-even point
g. The profit area
h. The loss area
g. Profit volume
h. Loss volume
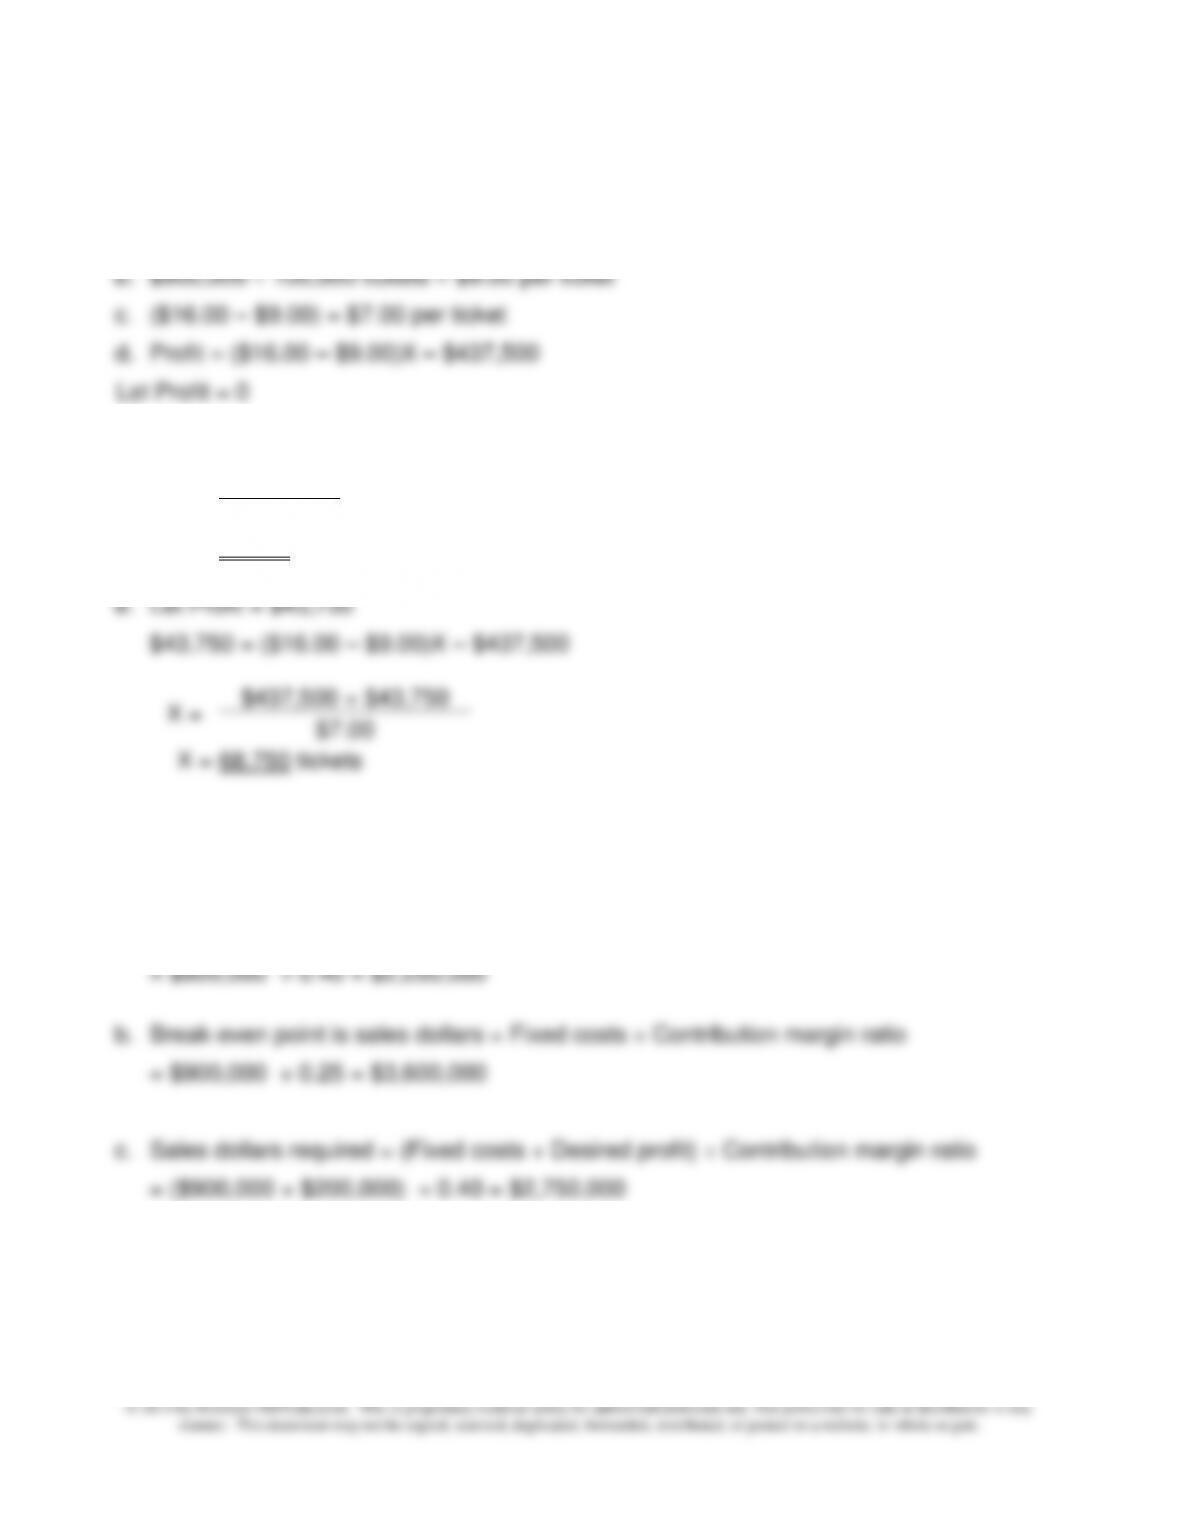
3-21. (15 min.) Profit Equation Components.
a. Total fixed costs (loss at zero volume)
Chapter 03 – Fundamentals of Cost-Volume-Profit Analysis
3-6
3-22. (20 min.) Basic Decision Analysis Using CVP: Anu’s Amusement Center.
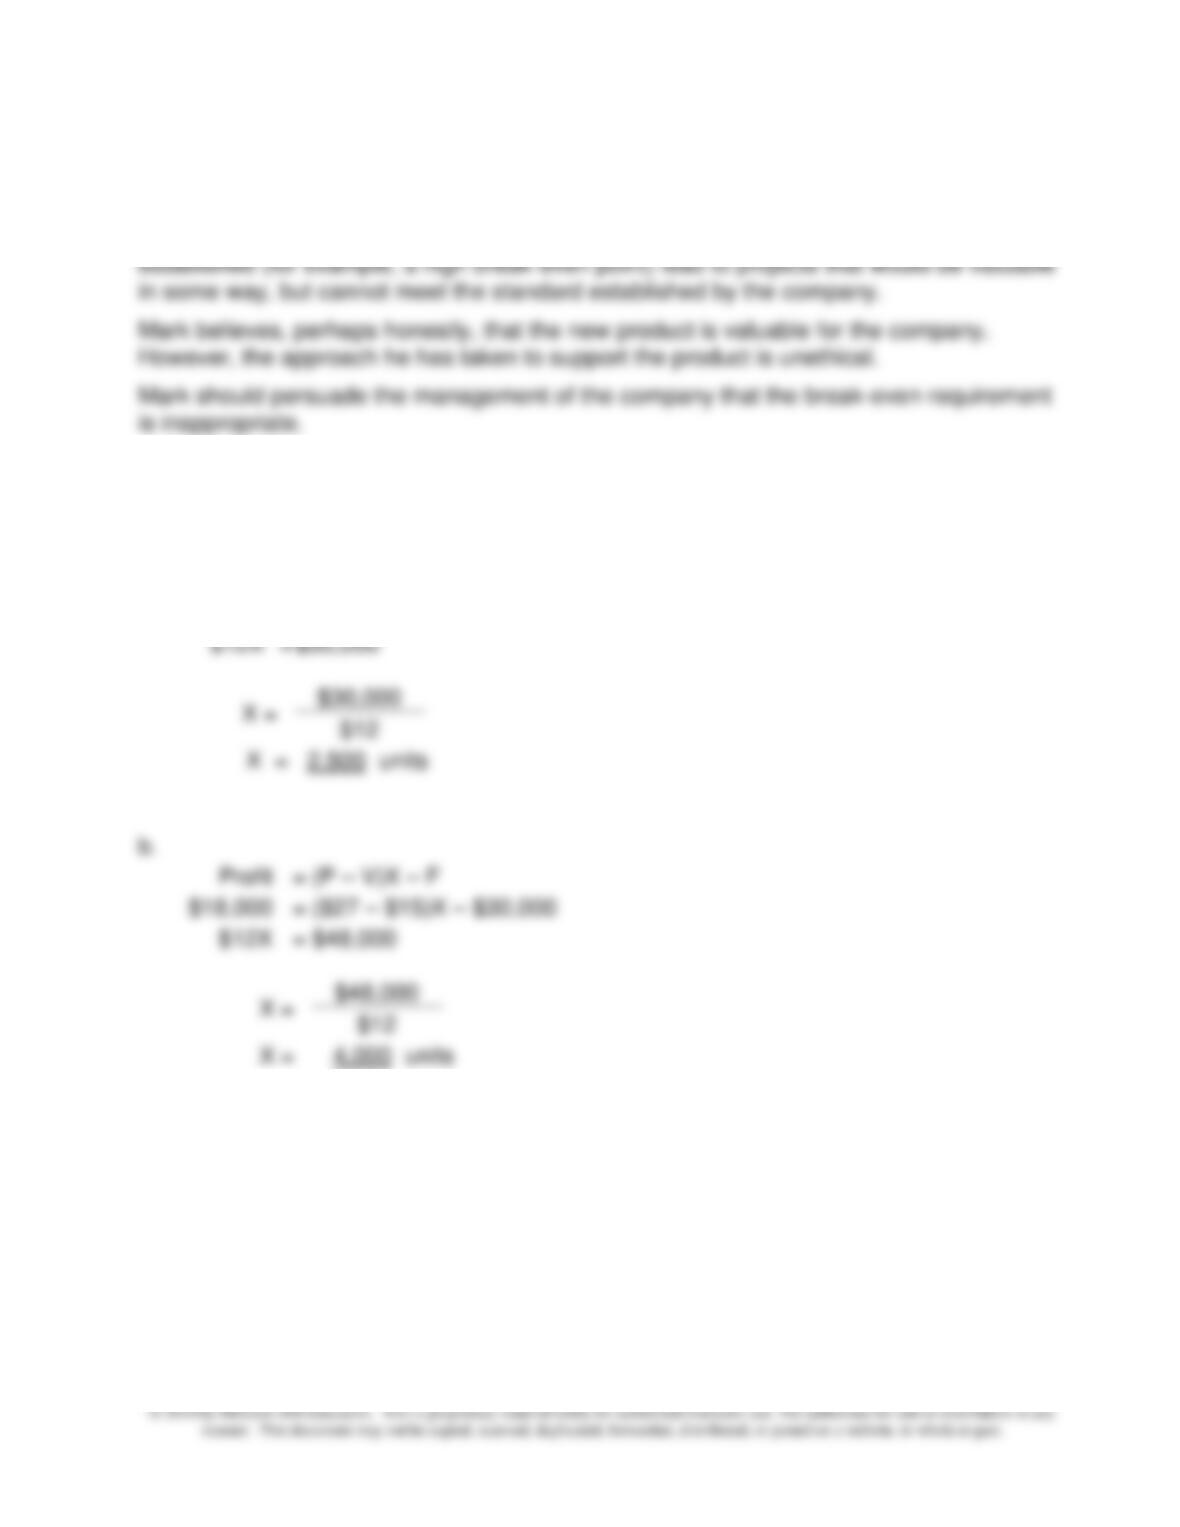
a. $1,600,000 100,000 tickets = $16.00 per ticket
0 = ($16.00 – $9.00)X – $437,500
X =
$437,500
$7.00
X =
62,500 tickets
3-23. (20 min.) Basic CVP Analysis: Kima’s Food Mart.
a. Break-even point is sales dollars = Fixed costs ÷ Contribution margin ratio
Chapter 03 – Fundamentals of Cost-Volume-Profit Analysis
3-7
3-24. (25 min.) CVP Analysis—Ethical Issues: Mark Ting.
This problem is based on the experience of the authors at several companies.
The problem in this example, which is common, is that the guidelines the company has
3-25. (55 min.) Basic Decision Analysis Using CVP: Cambridge, Inc.
a.
Profit
=
(P – V)X – F
$0
=
($27 – $15)X – $30,000
$12X
=
$30,000
X =
$30,000
$12
X
=
2,500
units
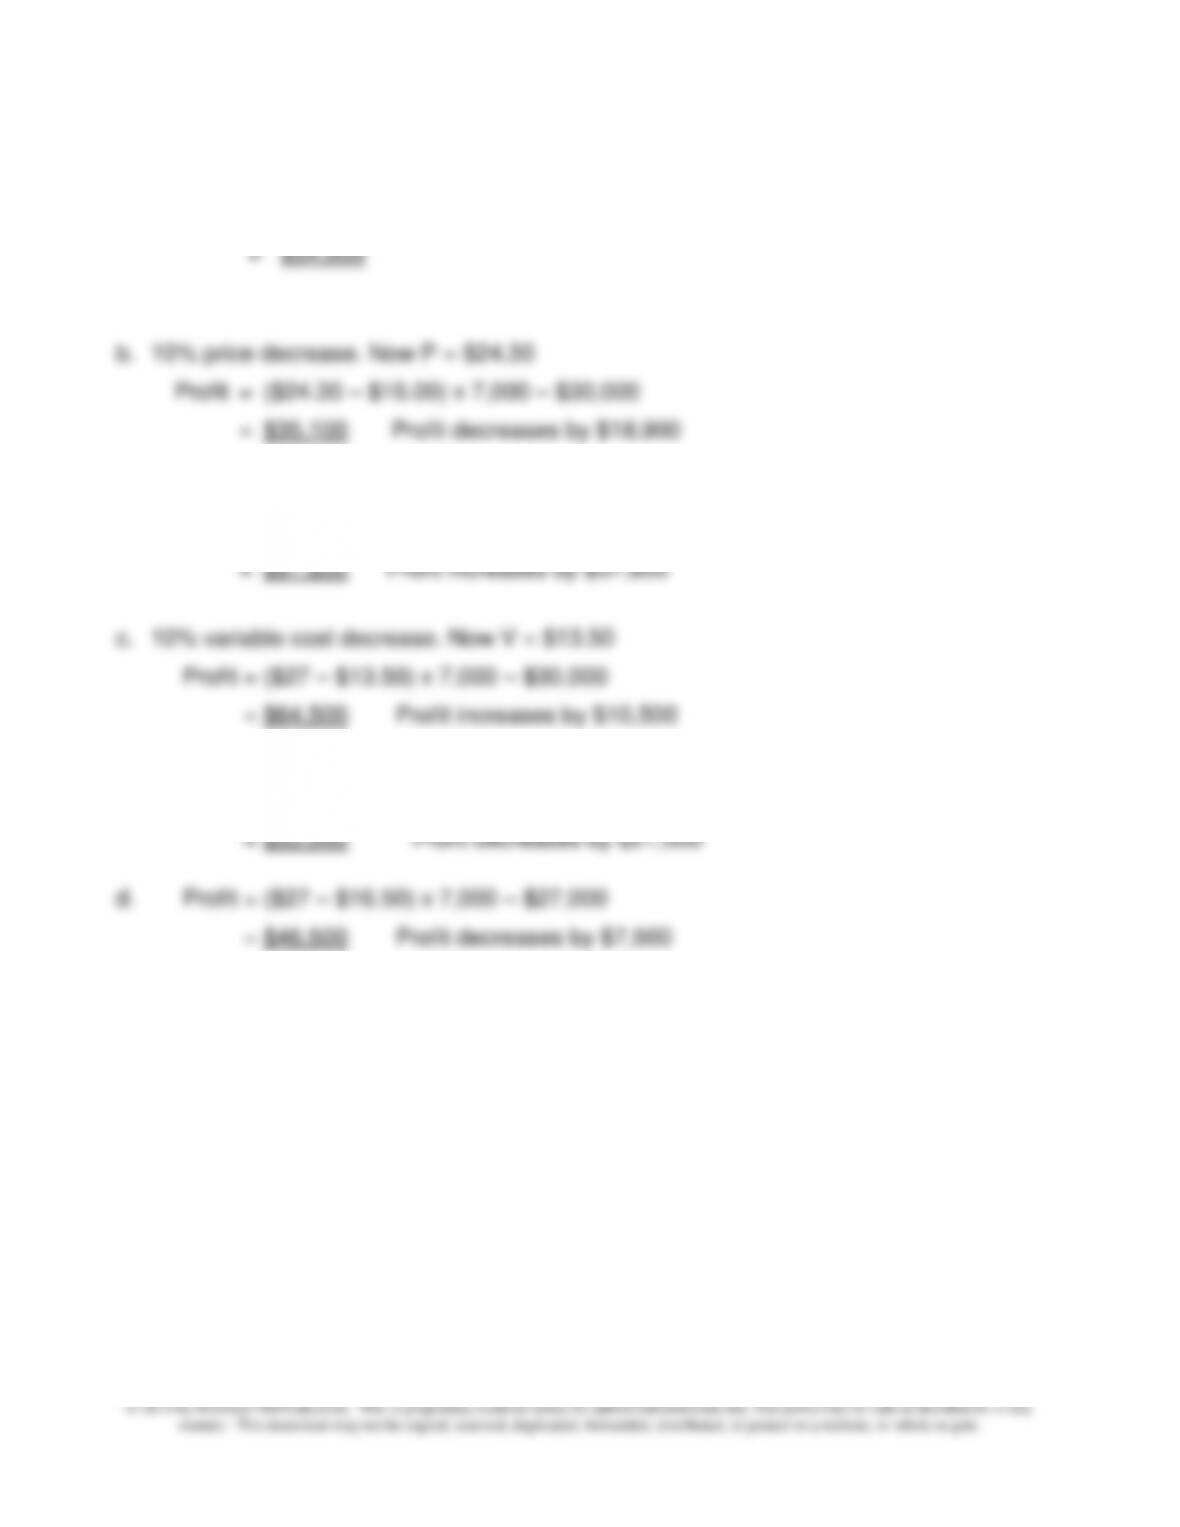
b.
Profit
=
(P – V)X – F
$18,000
=
($27 – $15)X – $30,000
$12X
=
$48,000
X =
$48,000
$12
X =
4,000
units
Chapter 03 – Fundamentals of Cost-Volume-Profit Analysis
3-8
3-26. (55 min.) Basic Decision Analysis Using CVP: Cambridge, Inc.
a.
Profit
=
($27 – $15) 7,000 – $30,000
=
$54,000
b.
10% price decrease. Now P = $24.30
Profit
=
($24.30 – $15.00) x 7,000 – $30,000
=
$35,100
Profit decreases by $18,900
20% price increase. Now P = $32.40
Profit
=
($32.40 – $15.00) x 7,000 – $30,000
=
$91,800
Profit increases by $37,800
c.
10% variable cost decrease. Now V = $13.50
Profit
=
($27 – $13.50) x 7,000 – $30,000
=
$64,500
Profit increases by $10,500
20% variable cost increase. Now V = $18
Profit
=
($27 – $18) x 7,000 – $30,000
=
$33,000
Profit decreases by $21,000
d.
Profit
=
($27 – $16.50) x 7,000 – $27,000
=
$46,500
Profit decreases by $7,500
Chapter 03 – Fundamentals of Cost-Volume-Profit Analysis
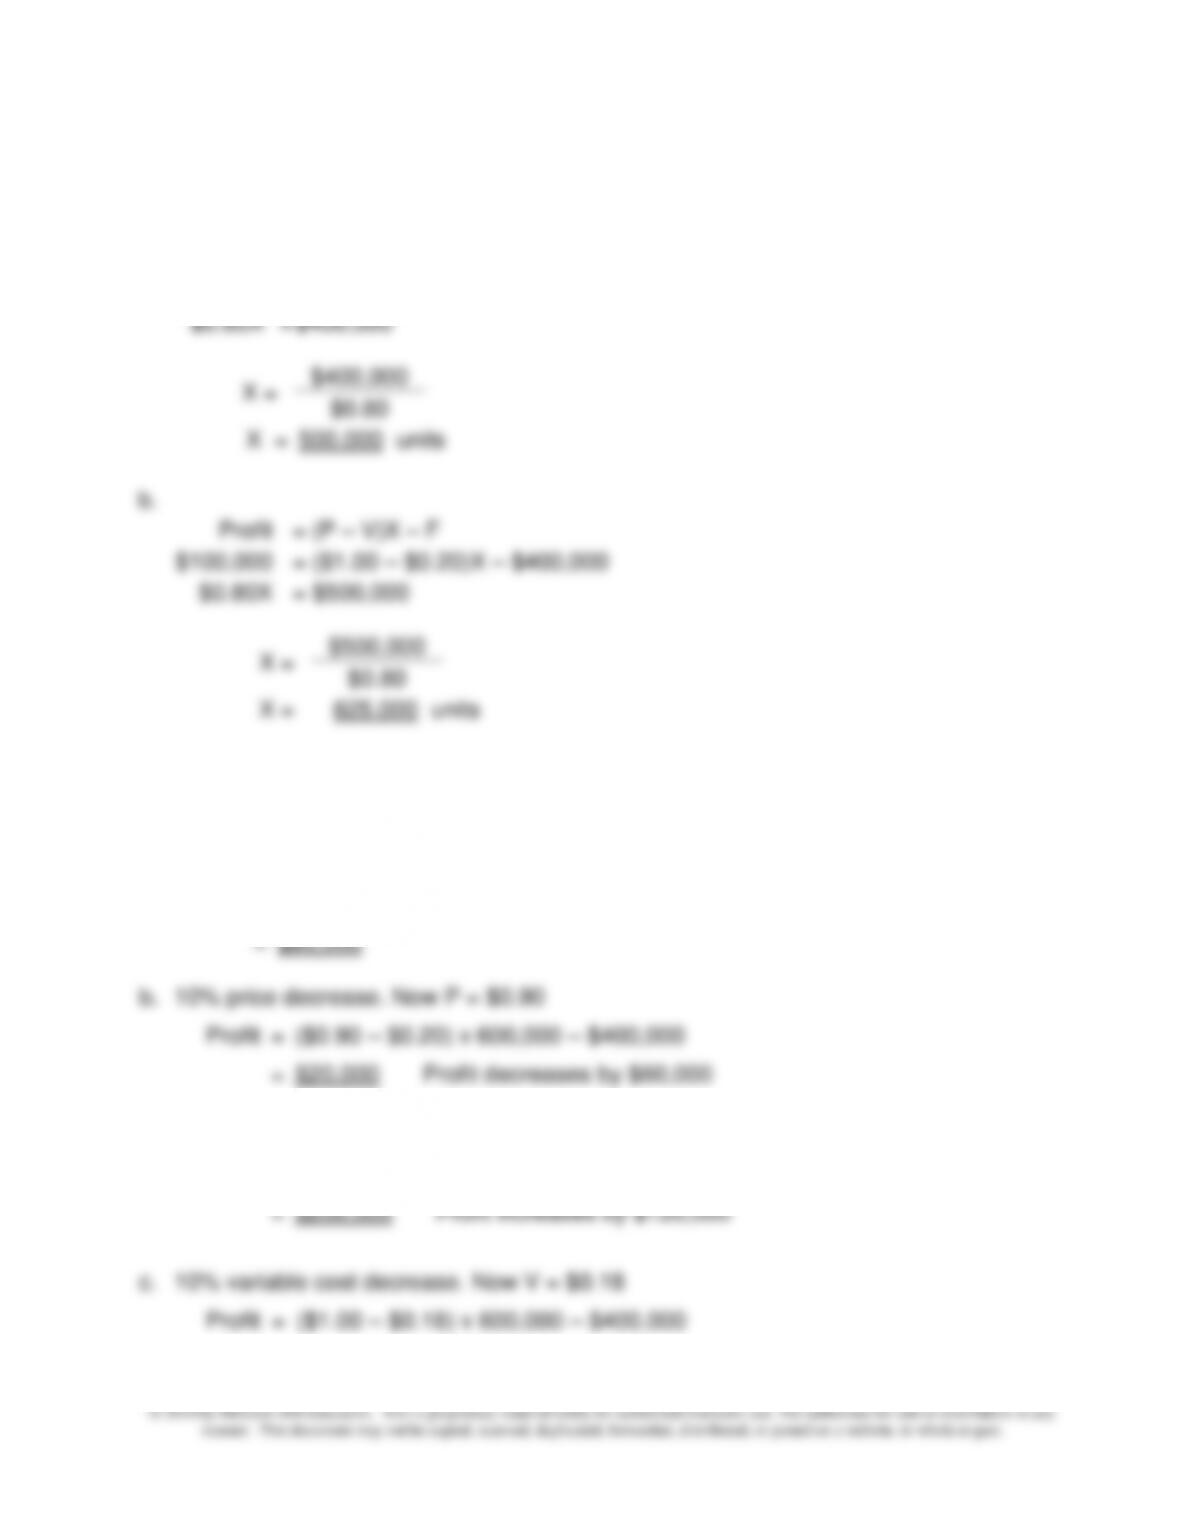
3-27. (25 min.) Basic Decision Analysis Using CVP: Balance, Inc.
a.
Profit
=
(P – V)X – F
$0
=
($1.00 – $0.20)X – $400,000
$0.80X
=
$400,000
$0.80
(P – V)X – F
($1.00 – $0.20)X – $400,000
$0.80
($1.00 – $0.20) 600,000 – $400,000
10% price decrease. Now P = $0.90
($0.90 – $0.20) x 600,000 – $400,000
Chapter 03 – Fundamentals of Cost-Volume-Profit Analysis
=
$92,000
Profit increases by $12,000
20% variable cost increase. Now V = $0.24
Profit
=
($1.00 – $0.24) x 600,000 – $400,000
=
$56,000
Profit decreases by $24,000
d.
Profit
=
($1.00 – $0.22) x 600,000 – $360,000
=
$108,000
Profit increases by $28,000
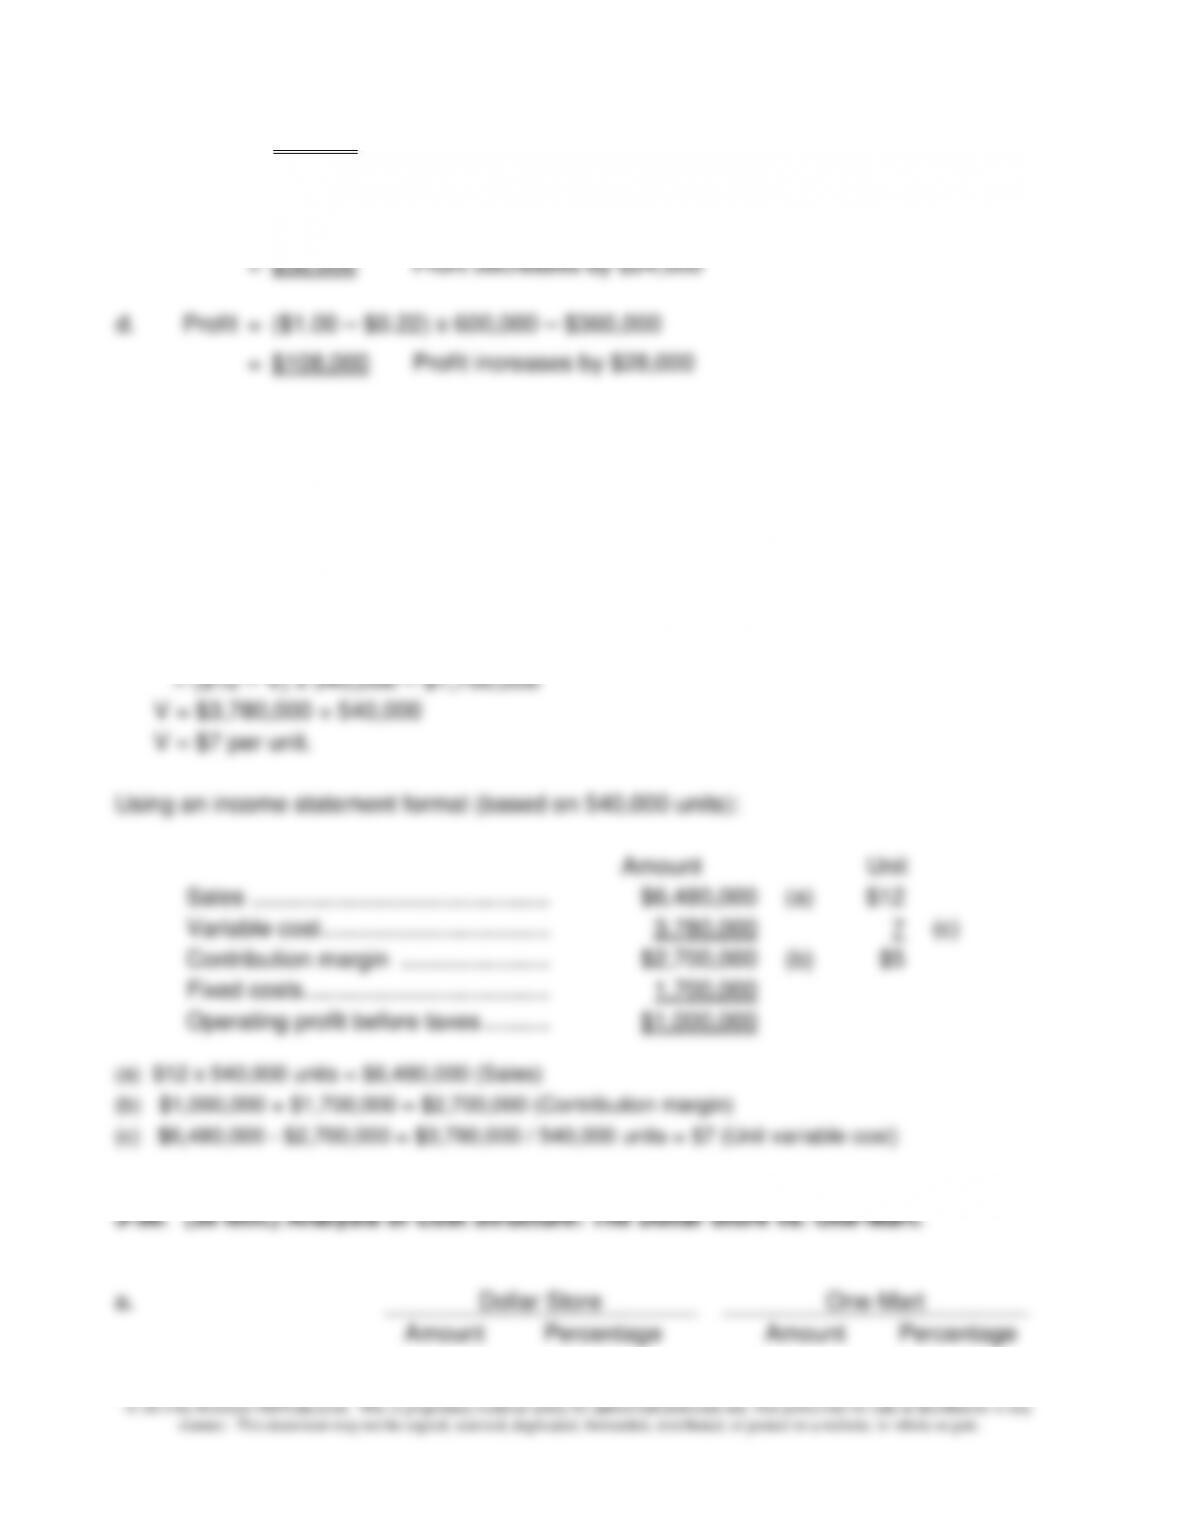
3-29. (30 min.) Basic CVP Analysis: LM Enterprises.
$7 per unit.
Using the profit equation:
Profit = (P – V) x X – F
= ($12 – V) x 540,000 – $1,700,000
V = $3,780,000 ÷ 540,000
V = $7 per unit.
Using an income statement format (based on 540,000 units):
Amount
Unit
Sales ………………………………………..
$6,480,000
(a)
$12
Variable cost ……………………………...
3,780,000
7
(c)
Contribution margin …………………...
$2,700,000
(b)
$5
Fixed costs ………………………………...
1,700,000
Operating profit before taxes ………..
$1,000,000
(a) $12 x 540,000 units = $6,480,000 (Sales)
(b) $1,000,000 + $1,700,000 = $2,700,000 (Contribution margin)
(c) $6,480,000 – $2,700,000 = $3,780,000 / 540,000 units = $7 (Unit variable cost)
3-30. (30 min.) Analysis of Cost Structure: The Dollar Store vs. One-Mart.
a.
Dollar Store
One-Mart
Amount
Percentage
Amount
Percentage