
Chapter 09 – Activity-Based Costing
9-1
Chapter 9
Activity-Based Costing
Learning Objectives
1. Understand the potential effects of using externally reported product costs for decision
making.
2. Explain how a two-stage product costing system works.
3. Compare and contrast plantwide and department allocation methods.
4. Explain how activity-based costing and a two-stage product system are related.
5. Compute product costs using activity-based costing.
6. Compare activity-based product costing to traditional department product costing
methods.
7. Demonstrate the flow of costs through accounts using activity-based costing.
8. Apply activity-based costing to marketing and administrative services.
Chapter Outline
I. REPORTED PRODUCT COSTS AND DECISION MAKING
A. Dropping a product
B. The death spiral
II. TWO-STAGE COST ALLOCATION
A. Two-stage cost allocation and the choice of cost drivers
B. Plantwide versus department-specific rates
C. Choice of cost allocation methods: A cost-benefit decision
III. ACTIVITY-BASED COSTING
♦ Developing activity-based costs
• Identifying activities that use resources
• Choosing cost drivers
• Computing a cost rate per cost driver
• Assigning costs to products
IV. COST HIERARCHIES
V. ACTIVITY-BASED COSTING ILLUSTRATED
A. Step 1: Identify the activities

Chapter 09 – Activity-Based Costing
9-2
B. Step 2: Identify the cost drivers
C. Step 3: Compute the cost driver rates
D. Step 4: Assign costs using activity-based costing
E. Unit costs compared
VI. COST FLOW THROUGH ACCOUNTS
VII. CHOICE OF ACTIVITY BASES IN MODERN PRODUCTION SETTINGS
VIII. ACTIVITY-BASED COSTING IN ADMINISTRATION
IX. WHO USES ABC?
X. SUMMARY
Key Concepts
LO 9-1 Understand the potential effects of using reported product costs
for decision making.
♦ The basic approach to product costing involves assigning direct costs to products and
allocating manufacturing overhead costs to products.
• For financial reporting purposes, the product costs computed are used primarily for
developing inventory balances and cost of goods sold amounts, and are based on
traditional systems that allocate manufacturing costs using a handful of allocation bases
(e.g., direct labor, direct materials, or machine utilization).
• In a traditional system, once a predetermined overhead rate is calculated, it is applied as
if all overhead costs were variable with respect to the allocation base, which is not true in
most cases for two reasons:
(1) Some of the overhead items could be fixed, and reducing the number of units
produced does not result in lower fixed costs. Examples of such fixed costs include
cost of supervision, machine and plant depreciation, and miscellaneous items that do
not vary with the allocation base.
(2) Some of the overhead items could vary, but with cost drivers other than those
traditionally chosen ones.
• If managers attempt to recover the costs with a smaller number of units, they are likely
to meet resistance in the market, resulting in demand for even fewer units. With the
smaller production, the reported product costs increase even more.

Chapter 09 – Activity-Based Costing
9-3
Example 1: MCR Manufacturing is considering the introduction of a new memory card
reader for use with digital cameras. Estimated unit variable cost is $5 and annual fixed
costs would be $100,000. The managers decide to price the new product with an
industry-standard markup of 16 percent (based on full cost).
The sales are initially estimated to be 10,000 units. So the introductory price will be
$17.40 = ($5 +
$100,000
10,000 units
) × (1 + 16%).
From the recent marketing report, the sales forecast is revised downward to 8,000
units. To recover the production cost in a hurry, the managers set a newer (and higher)
price of
$20.30 = ($5 +
$100,000
8,000 units
) × (1 + 16%),
driving away even more would-be customers. If the managers stick with the same
costing practice (and pricing strategy), the new memory card reader will soon
disappear from the retail shelf.
• Death spiral is a phenomenon that begins by attempting to increase price to meet
higher reported product costs, losing demand, reporting still higher costs, and so on until
the firm is pricing itself out of business.
• Death spiral may occur when the demand falls while fixed costs remain the same. Death
spiral may also occur when capacity (and associated fixed overhead costs) is increased in
anticipation of growing demand in the future. Either way, the prices have to go up in
order to recover the ever higher reported product costs in a vicious cycle that eventually
drives away remaining customers.
LO 9-2 Explain how a two-stage product costing system works.
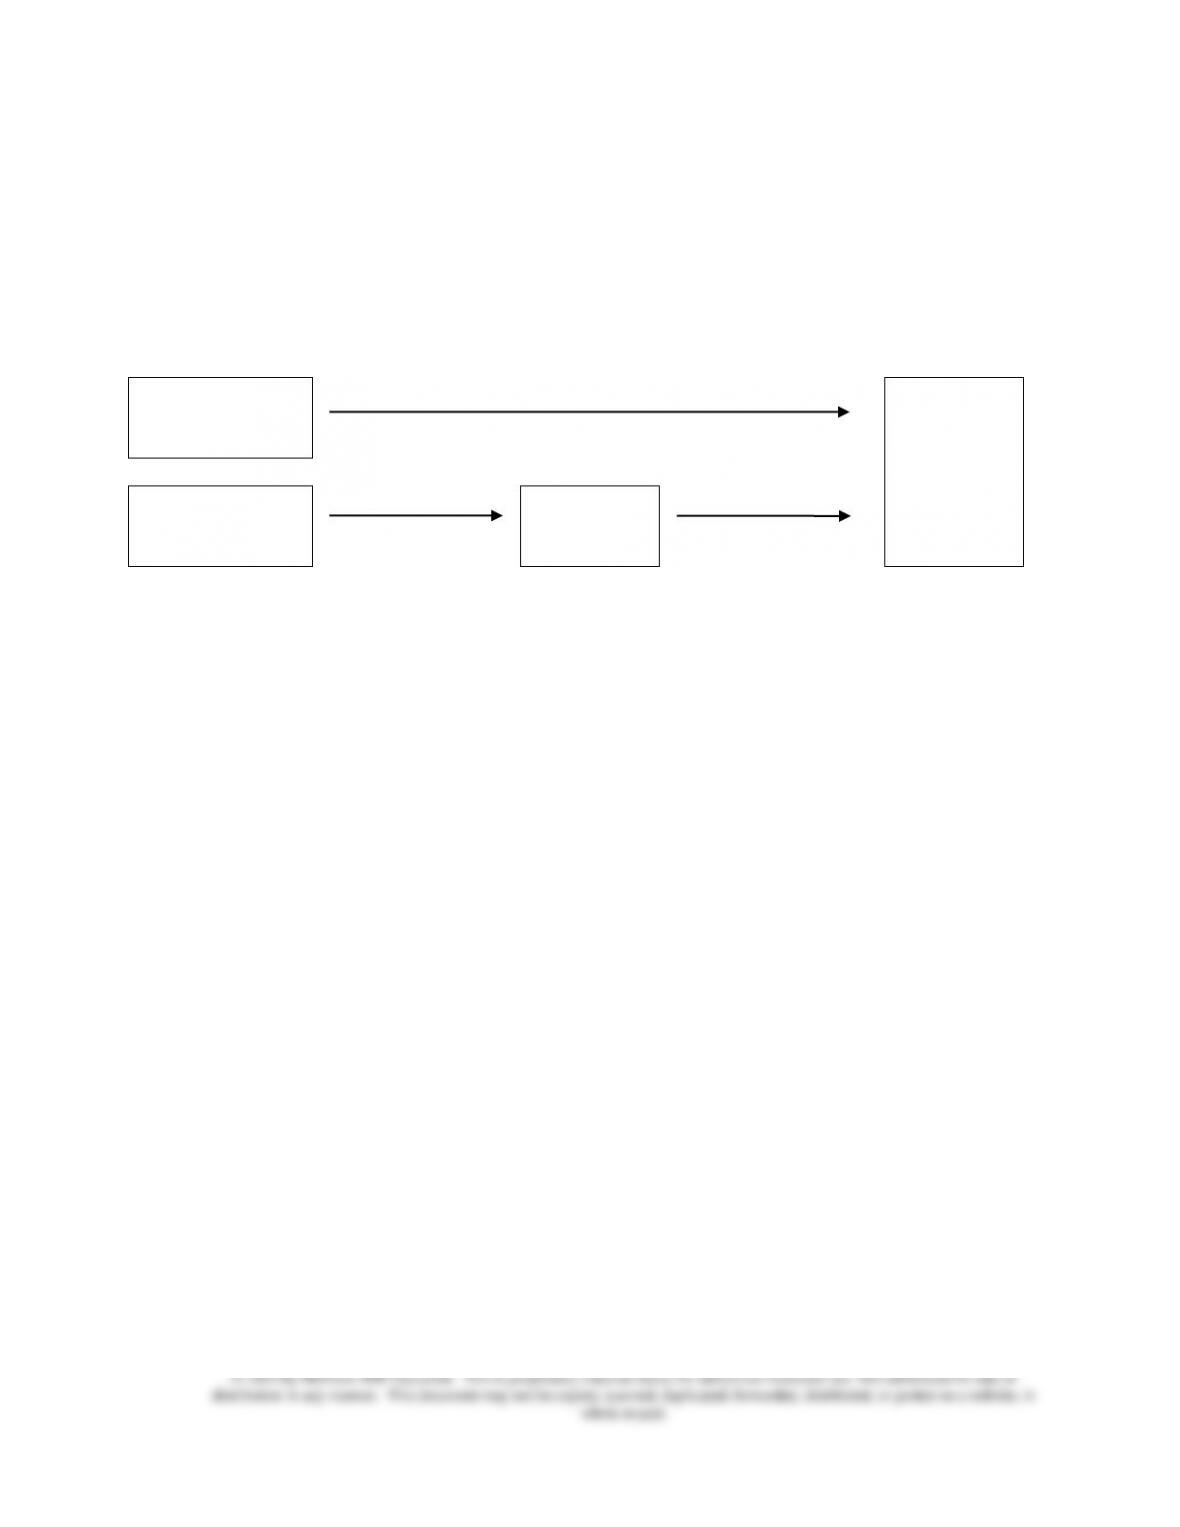
♦ The basic approach in product costing is to allocate costs in the cost pools that record
manufacturing costs and assign, or allocate, these costs to the products or services of interest, by
using appropriate cost allocation bases or cost drivers.
• Alternative cost-allocation approaches should be evaluated based on
Chapter 09 – Activity-Based Costing
9-4
(1) decision usefulness, and
(2) cost-benefit considerations.
• Two-stage approach to product costing was discussed in Chapter 6 and involves the
following:
Direct costs:
Direct materials,
Direct labor
Assigned to
Cost
objects:
Products or
services
Indirect costs:
Manufacturing
overhead
First stage
allocation
Cost pools
Second stage
allocation
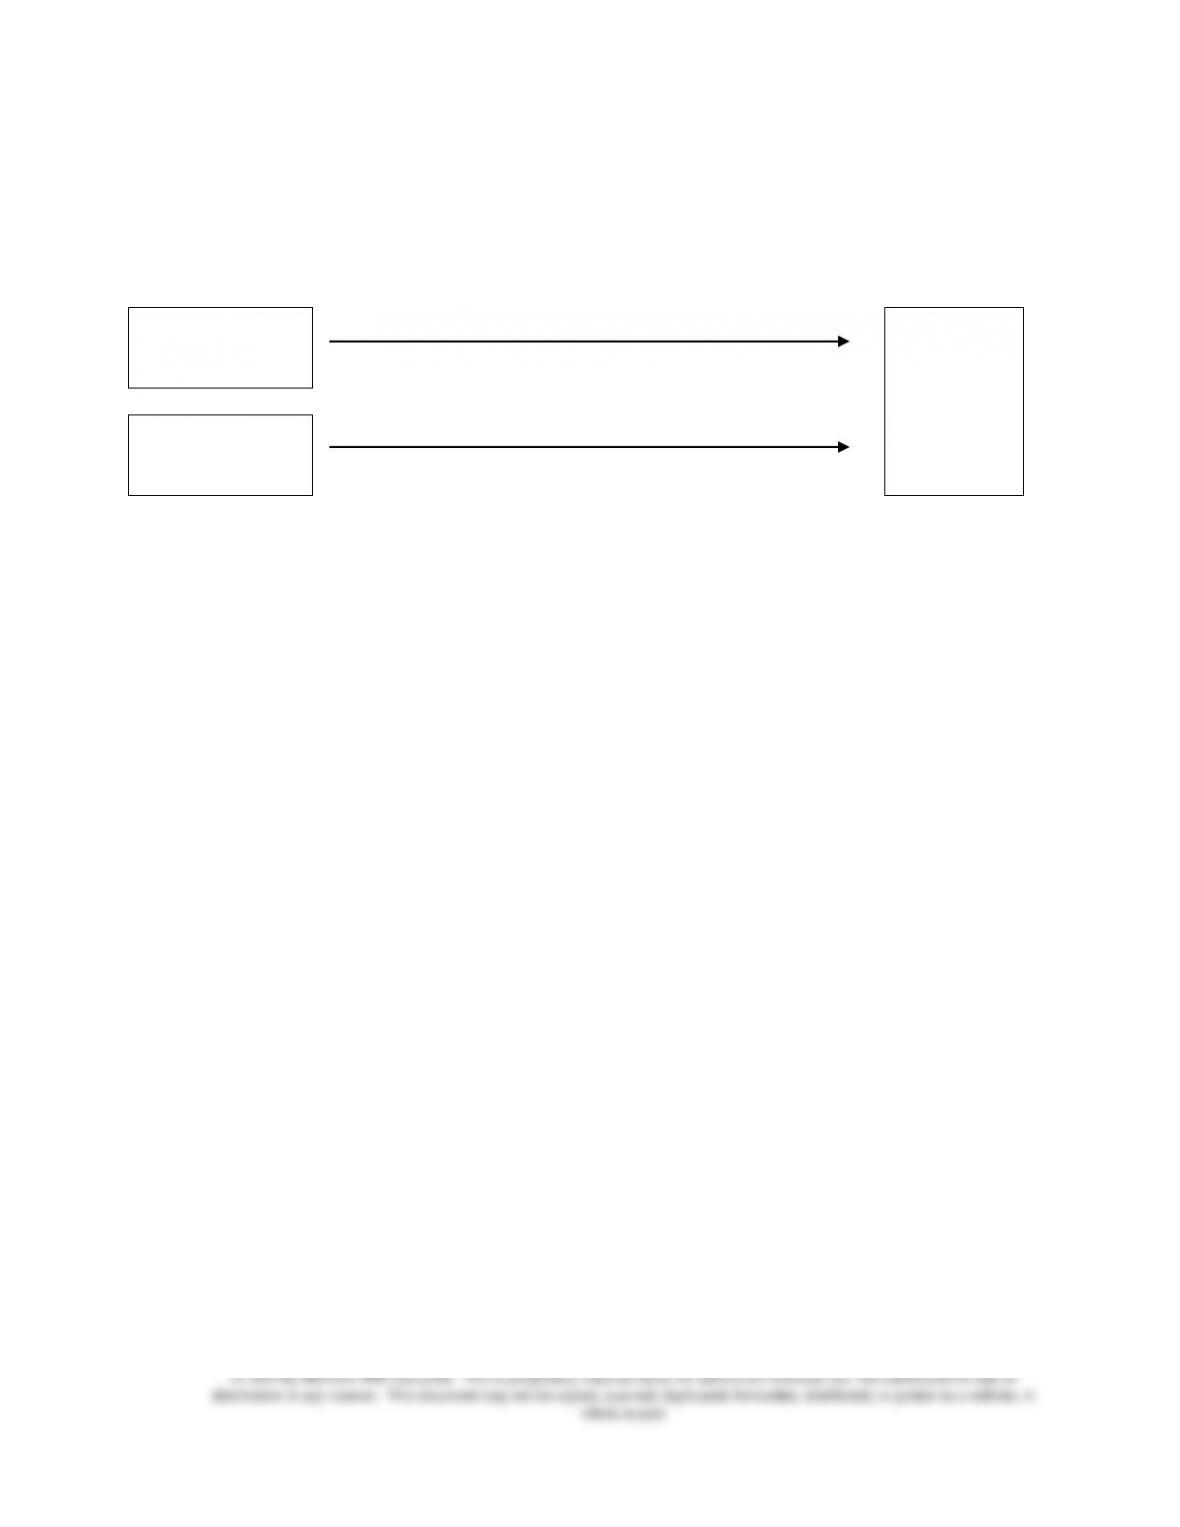
• The first-stage cost objects (cost pools) are the overhead accounts (e.g., machine-related
costs and direct labor-related costs) captured by the cost accounting system, as shown in
Exhibit 9.4.
• The two-stage approach separates plant, or manufacturing, overhead into two or more
cost pools based on the account in which the costs were recorded.
• The allocation in the first stage permits selection of multiple cost drivers that can be
used to allocate costs to products.
• Another common choice for first-stage cost objects is to use production departments or
product lines within the plant, as shown in Exhibit 9.5.
• The allocation of overhead costs to departments is not as simple as it is when overhead
accounts are used because the costs are not necessarily recorded at the department level.
• Complexity and special handling required during production may distort the product
costs reported when the traditional costing method is used. The two-stage system, on the
other hand, allows the firm to develop product costing systems that more closely align the
allocation of costs with the use of resources.
Chapter 09 – Activity-Based Costing
9-5
LO 9-3 Compare and contrast plantwide and departmental allocation
methods.
♦ The single-stage approach was introduced in Chapter 6 and depicted below:
Direct costs:
Direct materials,
Direct labor
Assigned to
Cost
objects:
Products or
services
Indirect costs:
Manufacturing
overhead
Single stage
Allocated to
• The plantwide allocation method is an allocation method that uses one cost pool (of
indirect costs) for the entire plant (e.g., an entire factory, store, hospital, or other multi-
department segment of a company), as in the single stage approach mentioned earlier. It
uses one overhead allocation rate, or one set of rates, for all of the departments in a
particular plant.
• Although it is called plantwide allocation, this allocation concept can be used in both
manufacturing and nonmanufacturing organizations.
• In plantwide allocation, all overhead costs are recorded in one cost pool in the
Manufacturing Overhead Control account for the plant without regard to the department
or activity that caused them. That is,
Manufacturing overhead control xx
Materials inventory xx
Wages payable xx
Accounts payable xx
Prepaid expense xx
Accumulated depreciation xx
… xx
• A single overhead rate is used to apply overhead to products, crediting Applied
Manufacturing Overhead account. That is,
Work–in–process inventory xx
Applied manufacturing overhead xx

Chapter 09 – Activity-Based Costing
9-6
Example 2: A company estimated its annual overhead costs to be $240,000. The
company uses the plantwide allocation method to assign overhead costs to its two
products, AA and BB, using machine hours, budgeted to be 12,000 for the coming
year. Then the single plantwide rate would be $20 (= $240,000 ÷ 12,000 machine
hours).
In March, 400 units of product AA were produced using 800 machine hours; 100 units
of product BB were produced using 400 machine hours. Then overhead allocation
would be
To AA:
$20 per machine hour × 800 machine hours = $16,000, or
$16,000 ÷ 400 units = $40 per unit.
To BB:
$20 per machine hour × 400 machine hours = $8,000, or
$8,000 ÷ 100 units = $80 per unit.
The journal entry would be
Work–in–process inventory (AA) 16,000
Work–in–process inventory (BB) 8,000
Applied manufacturing overhead 24,000
The amount of the credit to the Applied Manufacturing Overhead account and the total
amount of the debit to Work in Process for overhead costs equal the overhead rate per
machine hour times the total number of machine-hours worked for each product.
• Companies using a single plantwide rate generally use an allocation base related to the
volume of output, such as direct labor hours, machine hours, units of output, or materials
costs.
======================
Demonstration Problem 1
ABC Manufacturing, Inc. produces three gadgets (Ace, Best, and Champ) in two departments,
Machining and Assembly. Each product requires one hour of direct labor for completion. The
following table provides production and cost data for the year.

Chapter 09 – Activity-Based Costing
9-7
Ace
Best
Champ
Total
Number of units
25,000
15,000
5,000
45,000
Machine hours
2,500
1,500
2,000
6,000
Direct materials
$1,000,000
$450,000
$275,000
$1,725,000
Direct labor
375,000
225,000
75,000
675,000
Overhead
Machining
900,000
Assembly
450,000
Total overhead
1,350,000
Tot costs
$3,750,000
Required:
Use the plantwide allocation method to determine the unit cost for each product. The
allocation bases to choose from are
1. Machine hours.
2. Direct labor costs.
Solution:
1. The overhead allocation rate when machine hours were used as the allocation base was
$225 per machine hour (= $1,350,000 ÷ 6,000 machine hours). The unit cost report would
show the following:
Ace
Best
Champ
Units produced
25,000
15,000
5,000
Machine hours per unit
0.1
0.1
0.4
Direct materials
$40.00
$30.00
$55.00
Direct labor
15.00
15.00
15.00
Applied overhead ($225 per machine hour)
22.50
22.50
90.00
Unit cost
$77.50
$67.50
$160.00
2. The overhead allocation rate when direct hour costs were used as the allocation base was
200% (= $1,350,000 ÷ $675,000). The unit cost report would show the following:
Ace
Best
Champ
Units produced
25,000
15,000
5,000
Direct materials
$40.00
$30.00
$55.00
Direct labor
15.00
15.00
15.00
Applied overhead (200% direct labor costs)
30.00
30.00
30.00
Unit cost
$85.00
$75.00
$100.00

Chapter 09 – Activity-Based Costing
9-8
Please note that the same results can be obtained using the number of units produced as the
allocation base because each product requires one hour of direct labor for completion and the
direct labor costs are in direct proportion to the number of units produced. The overhead
allocation rate would be $30 per unit (= $1,350,000 ÷ 45,000 units) as shown above.
======================
• The department allocation method uses a separate cost pool for each department.
Each department has its own overhead allocation rate or set of rates. This is a variation of
the two-stage allocation approach in which the cost pools happen to be departments.
• If the company manufactures products that are quite similar and all use the same set of
resources, the plantwide rate is probably sufficient.
• If there are multiple products that require manufacturing facilities in many different
ways, departmental rates provide a better picture of the use of manufacturing resources
by the different products.
• The choice between a plantwide rate and departmental rates is based on the costs and
benefits of the information inherent in each system. Any incremental costs of additional
information must be justified by an increase in benefits from improved decisions.
======================
Demonstration Problem 2
(Continued from Demonstration Problem 1)
Considering the nature of the production processes, the cost accountant of ABC Manufacturing
decided to experiment with the department-specific allocation approach and determined that the
Machining Department can use machine hours as the allocation base for overhead assignment
while the Assembly Department can use direct labor costs instead.
Required:
Use the department allocation method to determine the unit cost for each product.
Solution:
For the Machining Department, the overhead allocation rate would be $150 per machine hour
(= $900,000 ÷ 6,000 machine hours).
For the Assembly Department, the overhead allocation rate would be 66.67% (= $450,000 ÷
$675,000).

Chapter 09 – Activity-Based Costing
9-9
Ace
Best
Champ
Units produced
25,000
15,000
5,000
Machine hours per unit
0.1
0.1
0.4
Direct materials
$40.00
$30.00
$55.00
Direct labor
15.00
15.00
15.00
Applied overhead
Machining ($150 per machine hour)
15.00
15.00
60.00
Assembly (66.67% of direct labor costs)
10.00
10.00
10.00
Unit cost
$80.00
$70.00
$140.00
======================
LO 9-4 Explain how activity-based costing and a two-stage product
system are related.
♦ Activity-based costing (ABC) is a two-stage product costing method that first assigns costs to
activities and then allocates them to products based on the each product’s consumption of
activities.
• The cost pools in the two-stage approach now accumulate activity-related costs.
• An activity is any discrete task that an organization undertakes to make or deliver a
product or service.
• Activity-based costing is based on the concept that products consume activities and
activities consume resources.
• Activity-based costing can be used by any organization that wants a better
understanding of the costs of the goods and services it provides, including manufacturing,
service, and even nonprofit organizations (see In Action item for a case study).
• Activity-based costing involves the following four steps:
(1) Identify the activities that consume resources and assign costs to them.
(2) Identify the cost driver(s) associated with each activity. A cost driver is any factor
that causes, or “drives,” an activity’s costs.
(3) Compute a cost rate per cost driver unit or transaction. Each activity could have
multiple cost drivers.
(4) Assign costs to products by multiplying the cost driver rate by the volume of cost
driver units consumed by the product.

Chapter 09 – Activity-Based Costing
9-10
• Identifying activities that use resources is the most interesting and challenging part of
the process, from which much of the value of activity-based costing comes. A cost-
benefit consideration dictates that companies identify only the most important activities.
• Many nonvalue-added activities are identified as well. These activities may be
eliminated to improve efficiency and profitability (to be discussed in Chapter 10).
• Examples of cost drivers are shown in Exhibit 9.10. Most of the cost drivers are related
either to the volume of production or to the complexity of the production or marketing
process.
• Cost drivers are selected based on three criteria:
(1) Causal relation. Ideally, choose a cost driver that causes the cost. This is the best cost
drive available.
(2) Benefits received. Choose a cost driver to assign costs in proportion to benefits
received.
(3) Reasonableness or fairness. When the first two criteria fail, assign costs on the basis
of fairness or reasonableness.
• For any indirect cost, a predetermined rate can be computed as follows:
Predetermined rate =
Estimated indirect cost
Estimated volume of allocation base
.
• For activity-based costing, the first stage consists of activities. Each activity has an
associated cost pool and requires a cost driver rate using the formula above.
• The second stage in a two-stage system using activity-based costing allocates costs to
products by multiplying the cost driver rates by the number of units of the cost driver (i.e.,
volume of activities) consumed in each product. Exhibit 9.11 illustrates such a process.
• The distinctive feature of activity-based costing is that it recognizes that overhead costs
are caused by activities and that activities may not be caused solely by volume, but by
other types of activities. Cost drivers for the activities should reflect the cost incurrence
in the activity, even if cost is not caused by volume.
• Cost hierarchy represents a classification of cost drivers into general levels of activity,
volume, batch, product, etc. Four possible levels of cost hierarchy are
(1) volume-related,
(2) batch-related,