
Chapter 06 – Fundamentals of Product and Service Costing
6-1
Chapter 6
Fundamentals of Product and Service Costing
Learning Objectives
1. Explain the fundamental themes underlying the design of cost systems.
2. Explain how cost allocation is used in a cost management system.
3. Explain how a basic product costing system works.
4. Understand how overhead cost is allocated to products.
5. Explain the operation of a two-stage allocation system for product costing.
6. Describe the three basic types of product costing systems: job order, process, and
operations.
Chapter Outline
I. COST MANAGEMENT SYSTEMS
A. Reasons to calculate product or service costs
B. Cost allocation and product costing
C. Cost flow diagram
II. FUNDAMENTAL THEMES UNDERLYING THE DESIGN OF COST SYSTEMS
FOR MANAGERIAL PURPOSES
III. COSTING IN A SINGLE PRODUCT, CONTINUOUS PROCESS INDUSTRY
A. Basic cost flow model
B. Costing with no work-in-process inventories
C. Costing with ending work-in-process inventories
IV. COSTING IN A MULTIPLE PRODUCT, DISCRETE PROCESS INDUSTRY
A. Predetermined overhead rates
B. Product costing of multiple products
C. Choice of the allocation base for predetermined overhead rate
D. Choosing among possible allocation bases
V. MULTIPLE ALLOCATION BASES AND TWO-STAGE SYSTEMS
♦ Choice of allocation bases
VI. DIFFERENT COMPANIES, DIFFERENT PRODUCTION AND COSTING
SYSTEMS
♦ Operations costing: An illustration
VII. SUMMARY

Chapter 06 – Fundamentals of Product and Service Costing
6-2
Key Concepts
LO 6-1 Explain the fundamental themes underlying the design of cost systems.
♦ Two principles in costing are:
(1) The cost system should be oriented to the needs of the decision makers.
(2) The cost system should be designed so that its benefits exceed its costs.
♦ A cost management system is a system that provides information about the costs of processes,
products, and services used and produced by an organization. The cost management system is
often abbreviated as cost system.
• A well-designed cost management system accumulates and reports costs that are
relevant to the decisions that managers make.
• These costs include those associated with the processes the organization uses to meet
customer needs, to serve the customers, and to comply with regulatory and tax authorities.
• The purposes of calculating individual product (and service) cost include:
(1) Computing the inventory values and cost of goods sold for the financial statements,
(2) Helping various product managers make decisions regarding pricing, production,
promotion, adding or dropping a product, whether to outsource selected products or
services, and so on.
• The In Action box emphasizes the importance of distinguishing between production
costs and overhead costs for small businesses, especially in hiring and layoff decisions.
LO 6-2 Explain how cost allocation is used in a cost management system.
♦ Costs that are common to two or more cost objects are likely to be allocated to those cost
objects on a somewhat arbitrary basis.
• Cost allocation can result in misleading information and poor decisions.
• The goal of a well-designed cost management system is to balance the potential
distortion in reported product costs with the cost of conducting a special study every time
a manager needs to make a decision.
• The product costs reported routinely from the cost system may be “good enough” as a
tradeoff between the cost of bad decisions and the cost of developing the information.
Chapter 06 – Fundamentals of Product and Service Costing
6-3
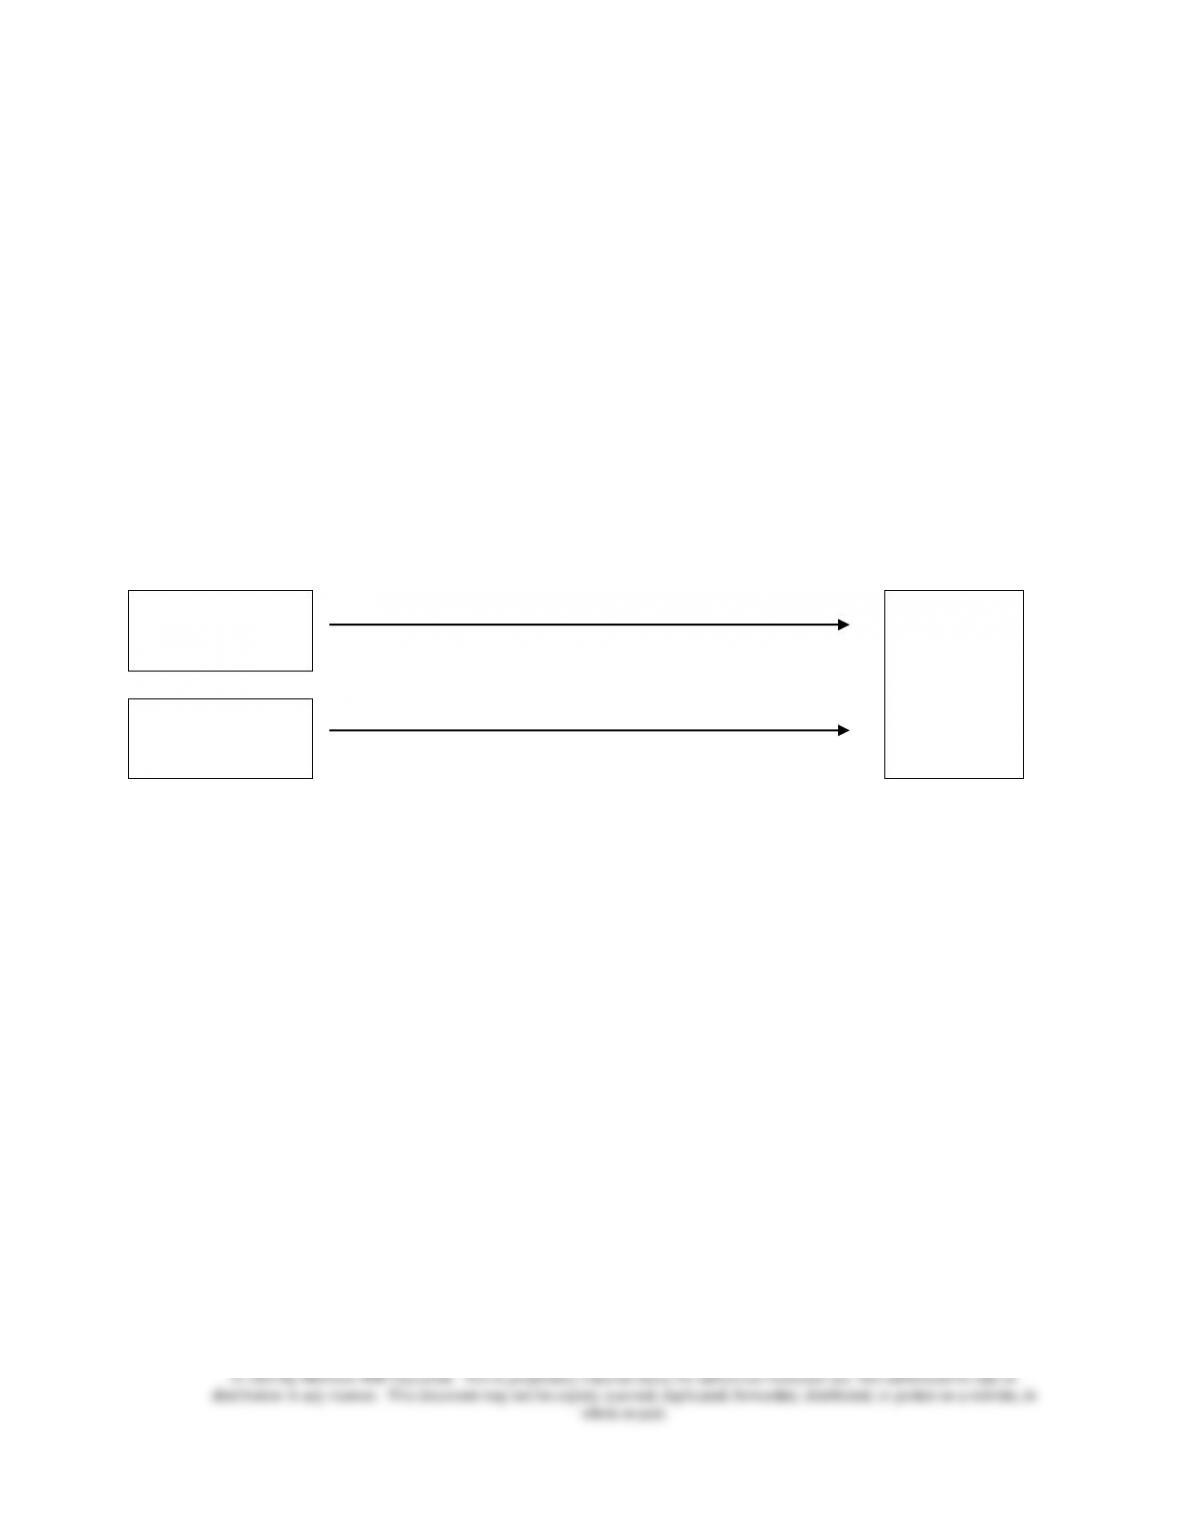
♦ The cost flow diagram is helpful by providing a graphical representation of the product costing
process.
• Exhibit 6.1 illustrates a basic cost flow diagram.
• The direct materials and direct labor costs are assigned directly to the cost objects. The
link between resources and the cost objects that consume the resources is unambiguous.
• Overhead costs are allocated based on some measure of activity (or cost driver)
consumed by the cost objects.
• The following graph shows the allocation process in an alternative view. Since the
manufacturing overhead is allocated to the cost objects in one step, this is known as the
single-stage allocation system.
Direct costs:
Direct materials,
Direct labor
Assigned to
Cost
objects:
Products or
services
Indirect costs:
Manufacturing
overhead
Allocated to
♦ Questions that need addressing before undertaking the design of a new cost system:
(1) How will managers use the information?
(2) What type of decisions will be made?
(3) Will benefits of improved decision making outweigh the costs of implementing the new cost
system?
• The answers to these questions give rise to the three fundamental themes underlying the
design of cost systems for managerial purposes.
• Cost systems should have a decision focus. It is important to design the cost system to
facilitate the decision making of the users (or customers) of the cost data provided by the
cost system.
• Different cost information is used for different purposes. What works for one
purpose will not necessarily work for another purpose. The cost information must provide
the appropriate data for its intended purpose.
Chapter 06 – Fundamentals of Product and Service Costing
6-4
• Cost information for managerial purposes must meet the cost-benefit test. Cost
information can always be improved. But the benefits of improvements (i.e., better
decision making) must outweigh the costs of making the improvement.
LO 6-3 Explain how a basic product costing system works.
♦ The fundamental framework for recording costs in any type of firm is the cost flow model as
represented by the basic inventory equation.
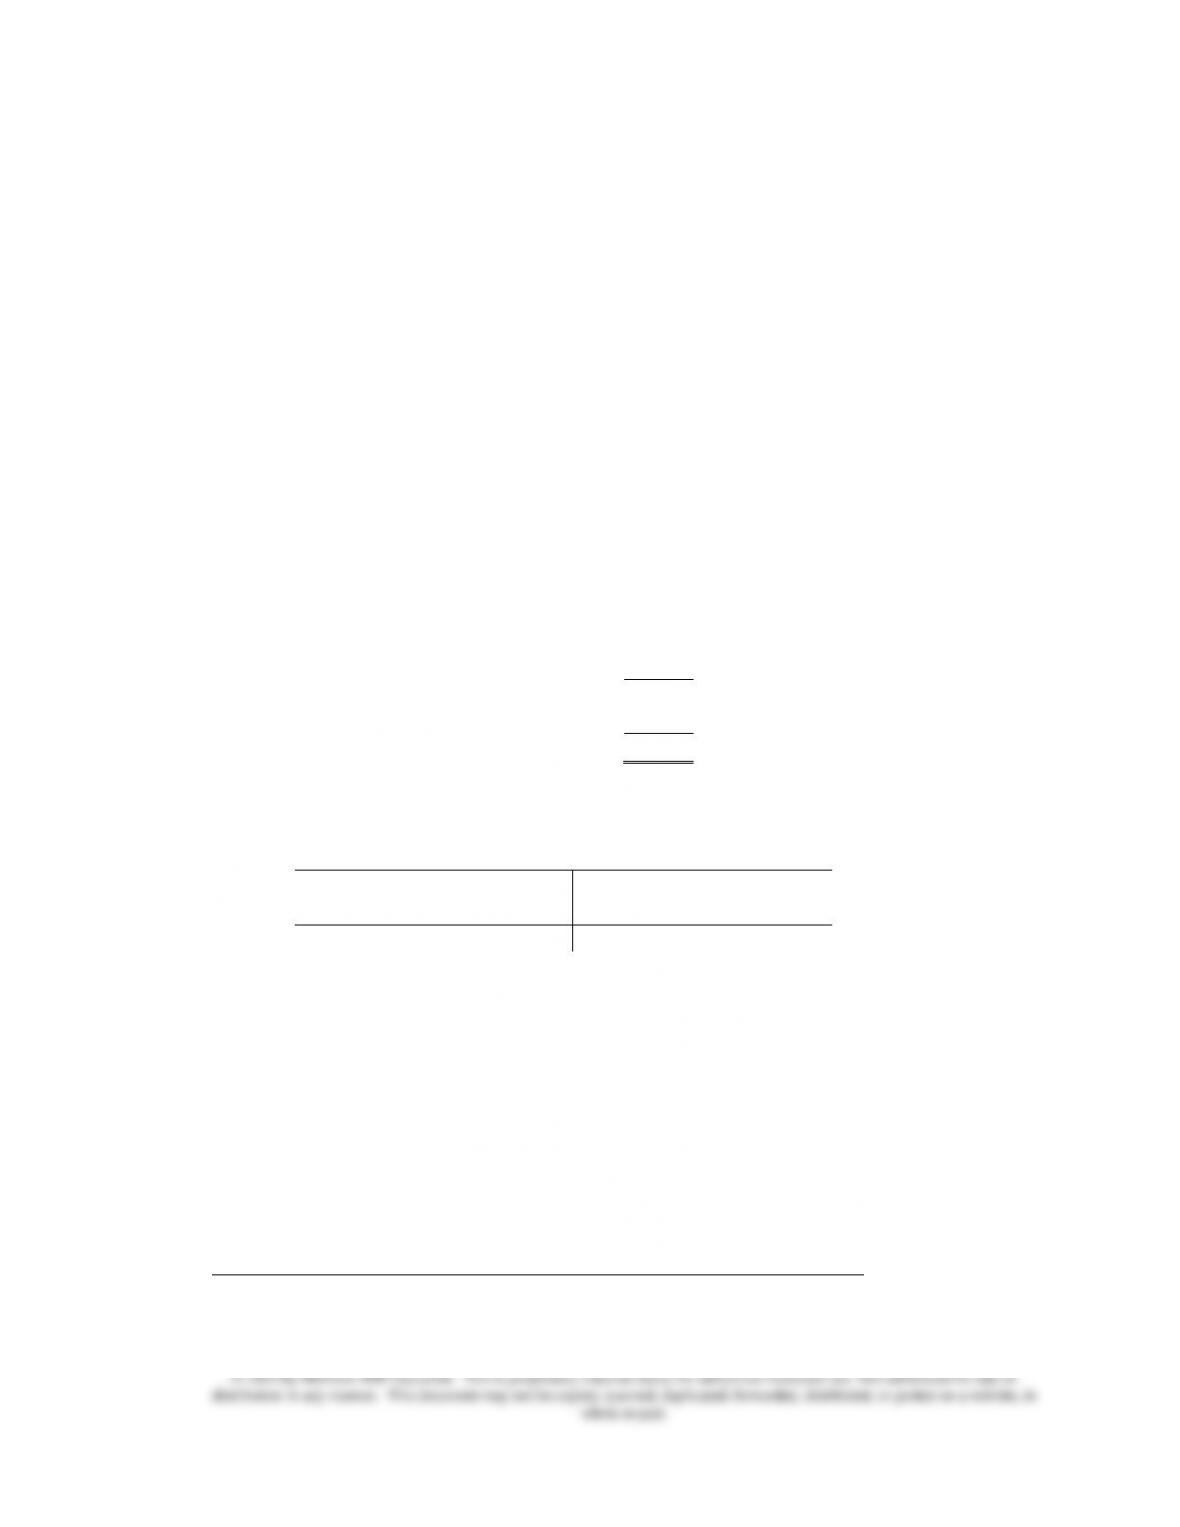
• The inventory equation is
Beginning balance (BB) + Transfer in (TI) – Transfer out (TO) = Ending balance (EB).
• Another way to look at the inventory equation is the following statement format:
Beginning balance (BB)
xx
Plus: Transfer in (TI)
xx
Total to account for
xx
Less: Transfer out (TO)
xx
Ending balance (EB)
xx
• A third way to study the inventory equation is through the inventory T-account:
Inventory account
Beginning balance (BB)
Less: Transfer out (TO)
Plus: Transfer in (TI)
Ending balance (EB)
• The inventory equation applies to both physical units and the costs associated with the
inventory item in question.
♦ For a single product with a continuous production process such as paint manufacturing, each
individual unit of product can be considered identical to every other one, so it serves no purpose
trying to trace costs to the individual unit level.
• When there are no work–in-process inventories, the cost assigned to each unit of output
produced can be calculated as
Total manufacturing costs (Materials, labor and overhead) for a period
Total quantity of output for a period
.
Chapter 06 – Fundamentals of Product and Service Costing
6-5
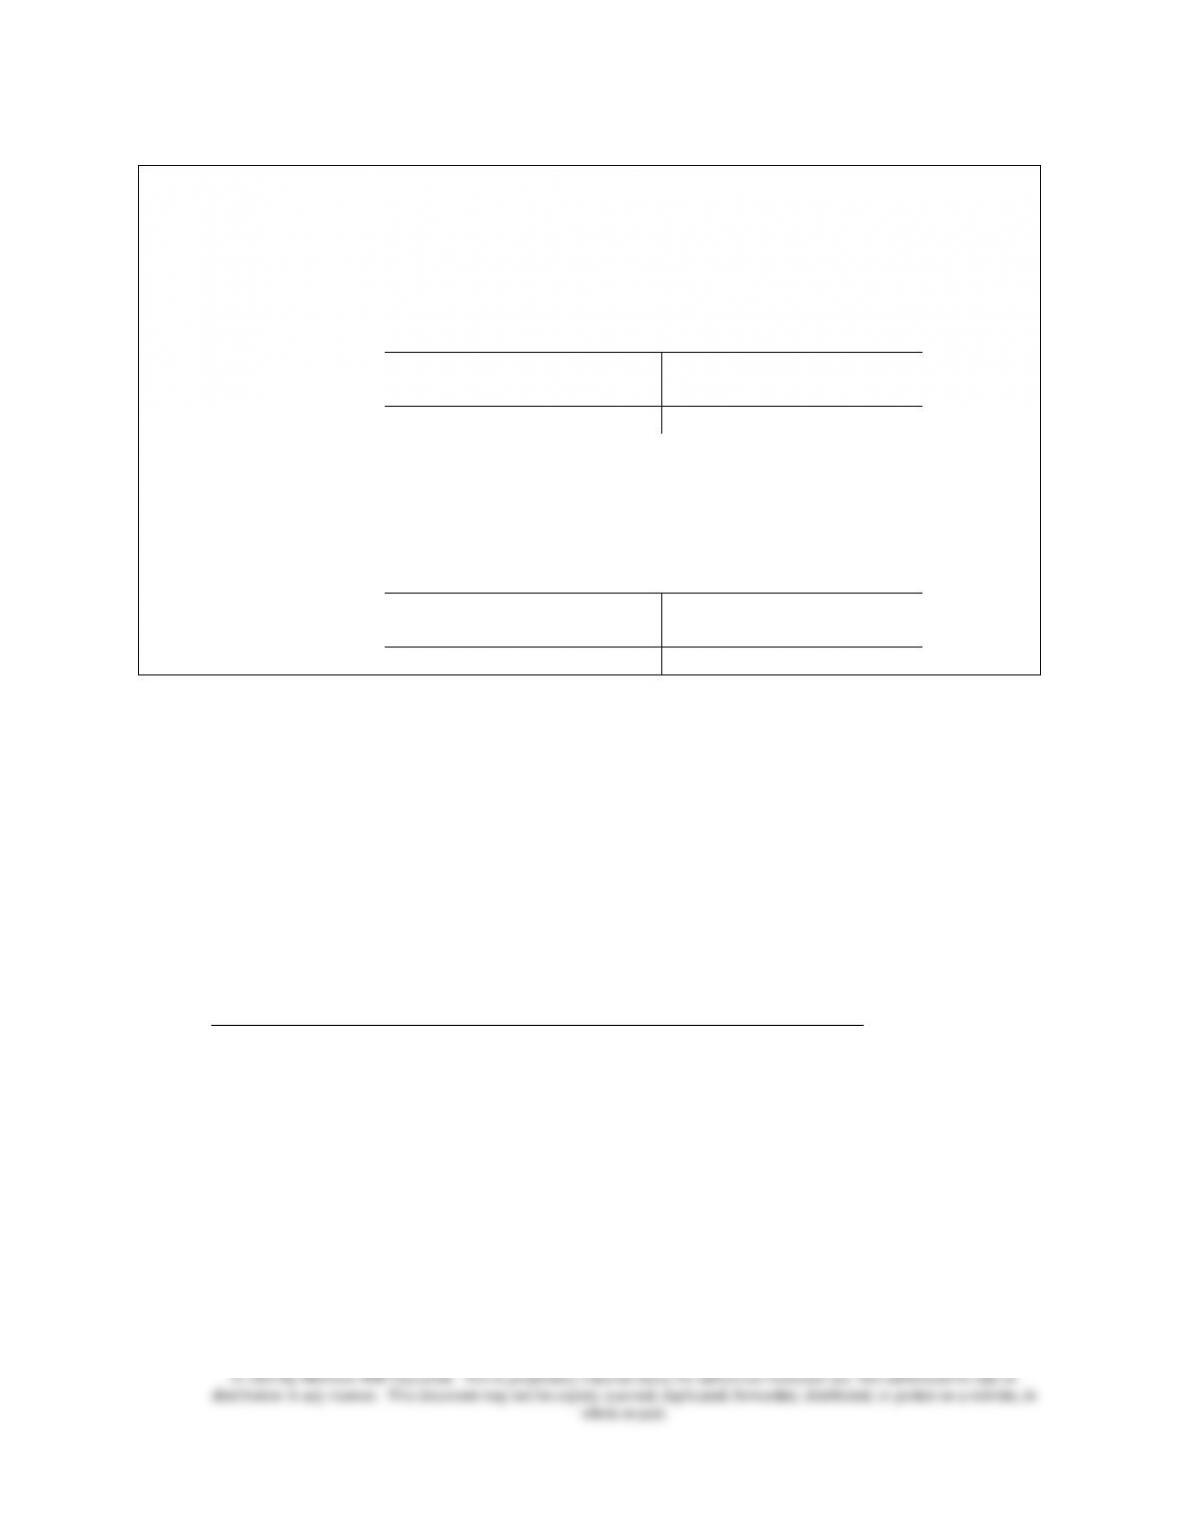
Example 1: In April, Baxter Paints started and completed production of 100,000
gallons of white paint. Total manufacturing costs incurred in April were $1,000,000.
There were no beginning and ending work-in-process inventories. The following T-
account shows the relations in terms of the physical units.
White paint (gallons)
0
100,000
100,000
0
Each gallon of white paint was assigned a cost of $10 (= $1,000,000 ÷ 100,000
gallons). Since all 100,000 gallons of white paint were transferred out, the following T-
account in monetary term applies.
White paint ($)
0
1,000,000
1,000,000
0
• When ending work–in-process inventory is present, the unit-cost calculation is the
same as before. But the denominator, Total quantity of output for a period, requires
modification. Since the ending work-in-process inventory is partially completed, the
“equivalent” unit of production must be calculated for the ending work–in-process
inventory and added to the number of units completed to determine the total quantity of
output for a period.
Equivalent units = Number of physical units × Percentage of completion.
• The revised unit-cost calculation becomes
Total manufacturing costs (Materials, labor and overhead) for a period
(Equivalent units + Units completed) for a period
.
Chapter 06 – Fundamentals of Product and Service Costing
6-6
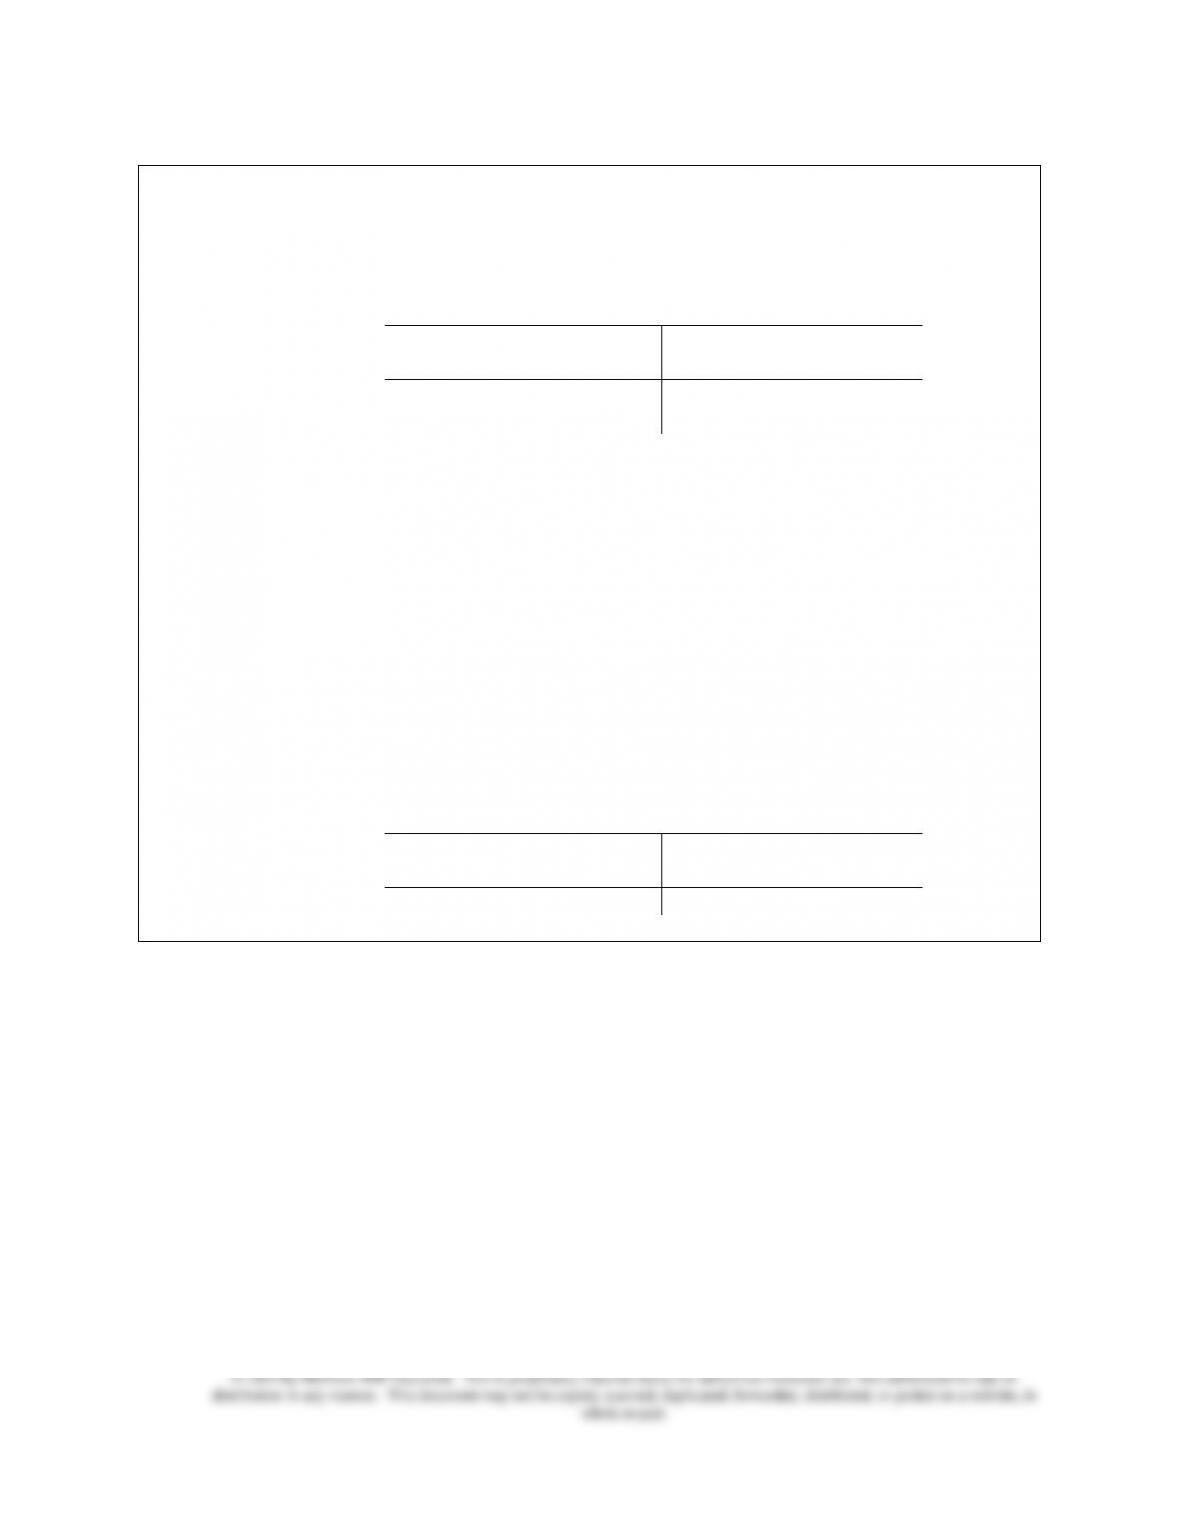
Example 2 (Continued from Example 1): In May, Baxter Paints incurred a total of
$990,000 manufacturing white paint. The accountant prepared the following T-account
in physical units.
White paint (gallons)
0
110,000
90,000
20,000
(50% complete)
For the 20,000 gallons of paint in process at the end of May, they were on average 50
percent complete and was equivalent to 10,000 gallons of finished paint (= 20,000
gallons × 50%). Total quantity of output for May became 100,000 gallons (= 90,000
gallons completed and transferred out + 10,000 equivalent gallons).
Each gallon of white paint was assigned a cost of $9.90 (= $990,000 ÷ 100,000
gallons). The $990,000 total manufacturing costs incurred were allocated to two cost
objects:
$891,000 (= $9.90 × 90,000 gallons) to the units transferred out, and
$99,000 (= $9.90 × 10,000 equivalent gallons) to the ending work-in-process
inventory, as shown in the following T-account.
White paint ($)
0
990,000
891,000
99,000
• The cost flow diagram in Exhibit 6.2 illustrates the costing process used at Baxter
Paints and the results in May.
======================
Demonstration Problem 1
In the first quarter of operation, the Blending Department of ChemUSA produced 50,000 barrels
of Compound X and left 20,000 barrels in ending work-in-process inventory which was, on
average, 55 percent completed. A total of $231,800 was incurred in that period. There was no
beginning work-in-process inventory.

Chapter 06 – Fundamentals of Product and Service Costing
6-7
Required:
1. Determine the amount of Compound X started in the first quarter.
2. Compute the cost of Compound X transferred to finished goods and the amount of work-
in-process inventory as of the end of the first quarter.
Solution:
1.
Compound X (barrels)
0
?
50,000
20,000
(55% complete)
Since 0 + ? – 50,000 = 20,000, the amount of Compound X started in the first quarter was
70,000 barrels.
2. For the 20,000 barrels of Compound X in process at the end of the first quarter, they were
on average 55 percent complete and equivalent to 11,000 barrels of finished product (=
20,000 barrels × 55%). Total quantity of output for the first quarter became 61,000
barrels (= 50,000 barrels completed and transferred out + 11,000 equivalent barrels).
Each barrel of Compound X was assigned a cost of $3.80 (= $231,800 ÷ 61,000 barrels).
The $231,800 total manufacturing costs incurred were allocated to two cost objects:
$190,000 (= $3.80 × 50,000 barrels) to the units finished and transferred out, and
$41,800 (= $3.80 × 11,000 equivalent barrels) to the ending work-in-process inventory,
as shown in the following T-account.
Compound X ($)
0
231,800
190,000
41,800
======================
♦ For a multiple-product, discrete process industry such as boat manufacturing, each unit of
product is produced in a series of discrete steps that differ in detail depending on the products. In
this case, the benefits of more detailed costing often outweigh the costs.
• The cost flow diagram in Exhibit 6.3 describes the problem of taking costs from the
three basic cost pools (direct materials, direct labor, and manufacturing overhead) and
allocating them to the cost objects (various products).

Chapter 06 – Fundamentals of Product and Service Costing
6-8
• Direct costs (direct materials and direct labor) can be directly traced or assigned to the
products at relatively low cost. Work orders, inventory requisitions, and skilled workers’
time spent are specific to the individual products.
• Indirect costs (manufacturing overhead) cannot, by definition, be identified directly
with individual units of product and must be allocated by identifying one or more
allocation bases.
• Ideally, an allocation base has a direct, cause-and-effect relation with the costs incurred.
The ideal is unlikely to be met.
• In practice, an allocation base needs to be measured for each cost object before it can be
used to allocate the manufacturing overhead. One common allocation base is direct labor
(cost or hour).
LO 6-4 Understand how overhead cost is allocated to products.
♦ Predetermined overhead rate represents the cost per unit of the allocation base used to
charge manufacturing overhead to products and is calculated from the budgeted data (as
estimated).
• Predetermined overhead rate =
Estimated overhead
Estimated allocation base
.
Example 3: Grange Boats makes two products, C-20 and C-27 sailboats, and uses
direct labor hours to allocate manufacturing overhead to products. For next January, the
budget data indicate that 10 C-27s and 30 C-20s will be produced using 2,000 and
3,000 direct labor hours, respectively. The total manufacturing overhead is expected to
be $180,000. The predetermined overhead rate can be calculated as
Predetermined overhead rate =
$180,000
(2,000 + 3,000) direct labor hours
= $36 per direct
labor hour.
C-27s will be allocated $72,000 (= $36 per direct labor hour × 2,000 direct labor hours)
and C-20s $108,000 (= $36 per direct labor hour × 3,000 direct labor hours) of the
budgeted manufacturing overhead of $180,000.
C-27s’ share of the manufacturing overhead is 40 percent (= 2,000 hours ÷ 5,000
hours) and C-20s’ share is the remaining 60 percent.

Chapter 06 – Fundamentals of Product and Service Costing
6-9
• The cost assigned to each unit of output produced in a multiple-product, discrete
process firm can be calculated as
Total manufacturing costs (Materials, labor and overhead) for a product
Total quantity of output for a product
.
Example 4 (Continued from Example 3): Grange Boats’ January budget data also show
that C-27s will use $40,000 of direct materials and $72,000 of direct labor; C-20s
$36,000 of direct materials and $78,000 of direct labor.
The cost system will assign $18,400 (= ($40,000 + $72,000 + $72,000) ÷ 10 C-27s) to
each C-27 and $7,400 (= ($36,000 + $78,000 + $108,000) ÷ 30 C-20s) to each C-20.
• The product costs calculated on the basis of budget data are estimates and useful for
decisions about future pricing and whether to continue making a particular product.
• The actual costing of the products after the period ends is done in the same general way
as described here. Chapter 7 will discuss what to do when actual results are not the same
as budgeted.
♦ There are at least two reasons why a particular allocation base is chosen:
(1) The cost system already captures information about the allocation base (such as direct labor
hours) by product line.
(2) Managers believe that the allocation base reflects the amount of “effort” that goes into each
product.

Chapter 06 – Fundamentals of Product and Service Costing
6-10
Example 5 (Continued from Examples 3 and 4): If Grange Boats selects instead direct
labor cost as the allocation base, then the predetermined overhead rate can be
calculated as
Predetermined overhead rate =
$180,000
($72,000 + $78,000) direct labor cost
= 120% of direct
labor cost.
This means that for every dollar of direct labor cost spent, $1.20 of manufacturing
overhead will be charged to the product. C-27s will be allocated $86,400 (= $1.20 per
direct labor dollar × $72,000 direct labor costs) and C-20s $93,600 (= $1.20 per direct
labor dollar × $78,000 direct labor costs) of the budgeted manufacturing overhead of
$180,000.
C-27s’ share of manufacturing overhead is 48 percent (= $72,000 ÷ $150,000) and C-
20s’ share is the remaining 52 percent.
The revised unit cost will be $19,840 (= ($40,000 + $72,000 + $86,400) ÷ 10 C-27s)
for each C-27 and $6,920 (= ($36,000 + $78,000 + $93,600) ÷ 30 C-20s) for each C-
20.
• The choice of possible allocation bases, though arbitrary, could have important
implications for decision making.
• The ideal allocation base chosen should reflect a direct cause-and-effect relation
between overhead costs incurred and the activity represented by the allocation base.
• There is no “right” choice because, by definition, there is no direct relation between
activity and overhead cost that is economically feasible to measure.
• Cost estimation techniques (see Chapter 5) can be applied to aid in making the choice.
(1) The overhead accounts can be analyzed to determine which allocation base seems to
be more highly related to overhead.
(2) Statistical analysis can be used to estimate the correlation between overhead cost and
activity.
• If a large portion of the overhead accounts are employee related and affected by the
wage rate, direct labor costs would be a better allocation base. If the costs are largely