
Chapter 05 – Cost Estimation
5-18
Y = number of labor hours per unit required for the last single unit produced (when
incremental unit-time learning model is adopted),
a
= number of labor hours required to produce the first unit,
X = cumulative number of units produced, and
b = index of learning equal to the natural logarithm (ln) of the learning rate divided by the ln
of 2.
• The expanded learning curve can be described as
ln(Learning rate %)
ln(2)
Y aX
Chapter 05 – Cost Estimation
5-19
Example 4 (Continued from Example 3): With the same incremental unit-time
learning model and an 85 percent learning rate for workers, the labor cost is assumed
to be $40 per hour. The learning curve formula can be used to populate the table
showing the relation between labor time and labor costs. Specifically,
ln(85%)
ln(2)
120YX
, where
b =
ln(85%)
ln(2)
= -0.2345.
Unit
Produced
(X)
Labor time
required to produce
the Xth unit
Cumulative
total time
in labor
hours
Total cost
(@ $40
per hour)
Average
cost
per unit
1
120 hours
120 hours
$4,800
$4,800
2
102.00 (= 120 × .85)
222
8,880
4,440
3
92.75 (=
0.2345
120 3
)
314.75
12,590
4,197
4
86.70 (= 102 × .85)
401.45
16,058
4,015
5
82.28 (=
0.2345
120 5
)
483.73
19,349
3,870
6
78.83 (=
0.2345
120 6
)
562.56
22,502
3,750
7
76.03 (=
0.2345
120 7
)
638.59
25,544
3,649
8
73.70 (= 86.7 × .85)
712.29
28,492
3,561
…
…
…
…
…
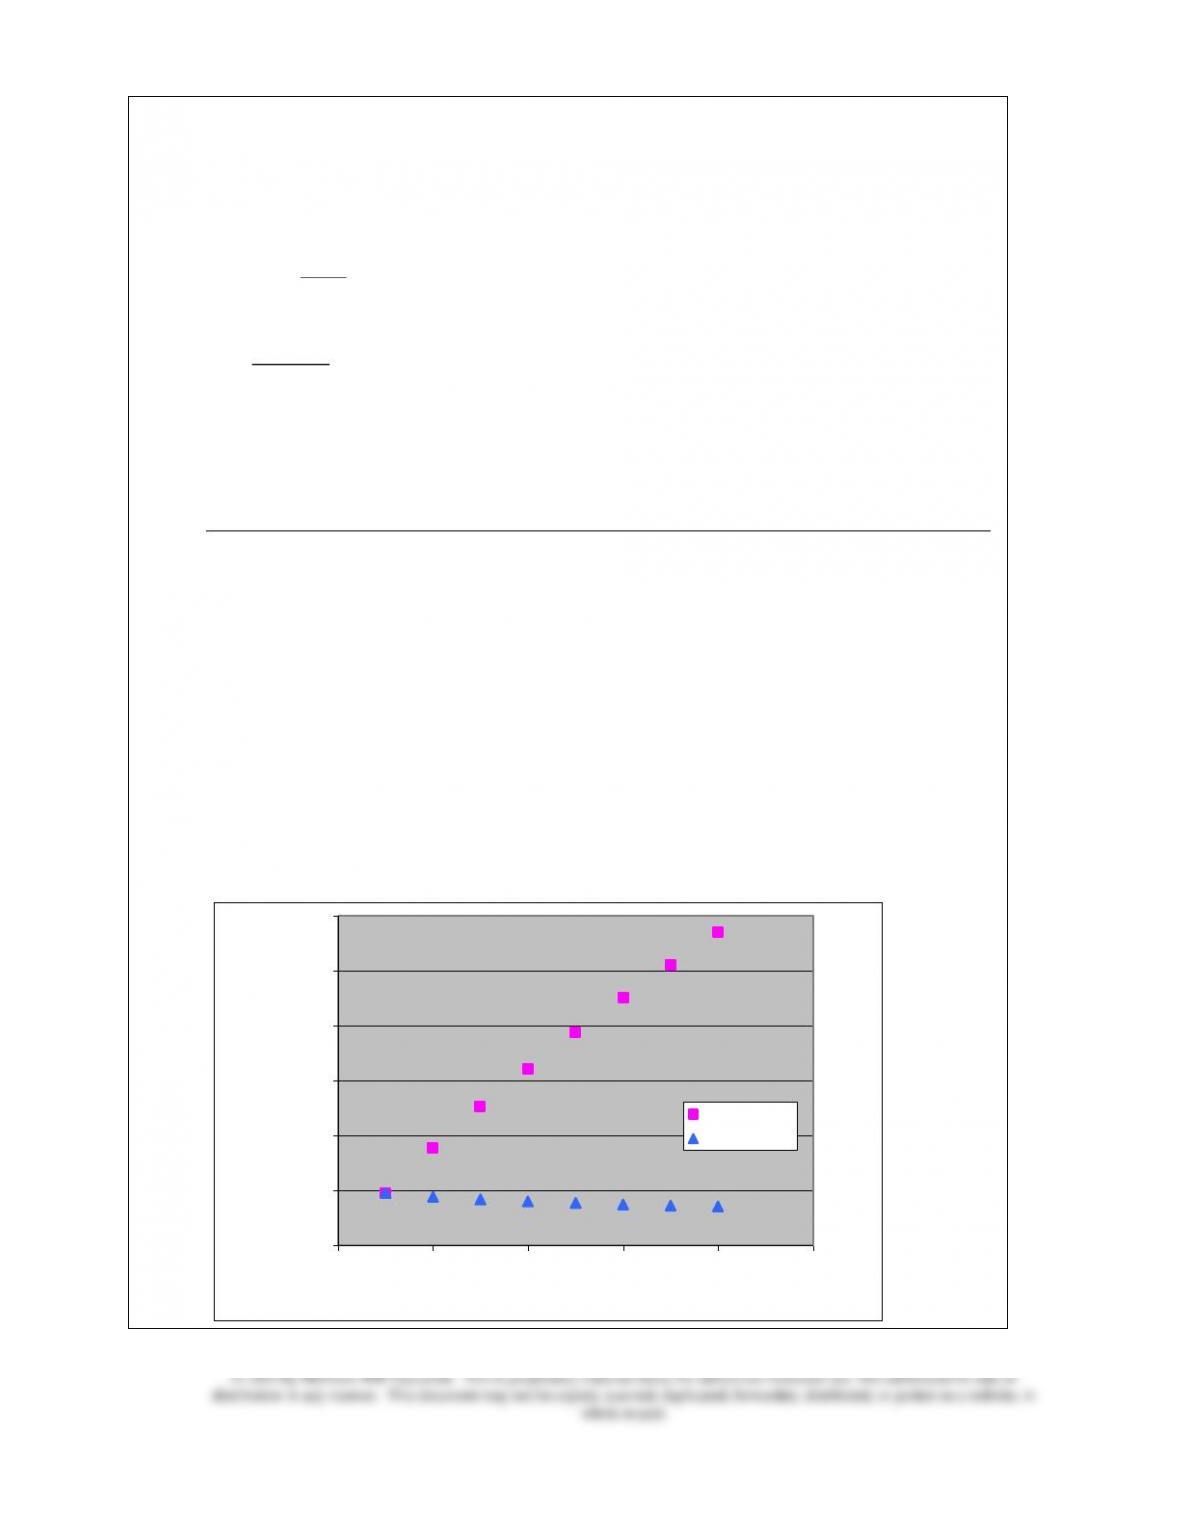
The relation between total and average costs is shown below. The average cost per
unit declines as the labor time required is decreasing to reflect the impact of the
learning phenomenon.
$0
$5,000
$10,000
$15,000
$20,000
$25,000
$30,000
0 2 4 6 8 10
Units
Costs
Total cost
Average cost

Chapter 05 – Cost Estimation
5-20
Matching
A.
Account analysis
G.
Independent variable
B.
Coefficient of determination
H.
Learning phenomenon
C.
Correlation coefficient
I.
Regression
D.
Dependent variable
J.
Relevant range
E.
Engineering estimate
K.
Scattergraph
F.
High-low cost estimation
L.
t-statistic
_____ 1. A cost estimate based on measurement and pricing of the work involved in a task.
_____ 2. Represents the limits within which a cost estimate may be valid.
_____ 3. A graph that plots costs against activity levels.
_____ 4. The value of the estimated coefficient divided by its standard error.
_____ 5. A cost estimation method that calls for a review of each account making up the total
cost being analyzed.
_____ 6. A measure of the linear relation between two or more variables.
_____ 7. The X term, or predictor, on the right-hand side (RHS) of a regression equation.
_____ 8. A systematic relationship between the amount of experience in performing a task and
the time required to perform it.
_____ 9. Statistical procedure to determine the relation between variables.
_____ 10. The Y term, or the left-hand side (LHS) of a regression equation.
_____ 11. The proportion of the variation in the dependent variable explained by the
independent variable(s).
_____ 12. A method to estimate costs based on two cost observations on the scattergraph,
usually at the highest and lowest activity levels.
Chapter 05 – Cost Estimation
5-21
Answers
Multiple Choice
1. Cost estimation
a. Is useful for decision making.
b. Is based on past cost pattern.
c. Differentiates between variable and fixed costs.
d. All of the above.
2. Engineering estimates
a. Are very time consuming.
b. For labor time may use time and motion study.
Chapter 05 – Cost Estimation
5-22
c. Requires data from prior activities.
d. Both a and b.
3. You are asked to conduct an account analysis of overhead. For last month, 450 labor hours
were incurred while spending $12,750 on overhead. You figured that fixed overhead
accounted for 40% of total overhead.
a. Last month’s fixed overhead was $5,200.
b. Variable overhead per labor hour was $17.
c. The projected overhead for 475 labor hours will be $13,750.
d. The information is not enough to proceed.
The following information is for questions 4 – 6.
For a typical quarter, the highest activity is 450 machine hours with overhead of $26,250; the
lowest activity is 250 machine hours with overhead of $18,750.
4. The variable overhead per machine hour is
a. $30.50.
b. $32.50.
c. $35.50.
d. $37.50.
5. The fixed overhead cost is
a. $8,500.
b. $8,750.
c. $9,375.
d. $9,650.
6. For 360 machine hours, the projected overhead costs are
a. $19,425.
b. $20,935.
c. $21,355.
d. $22,875.
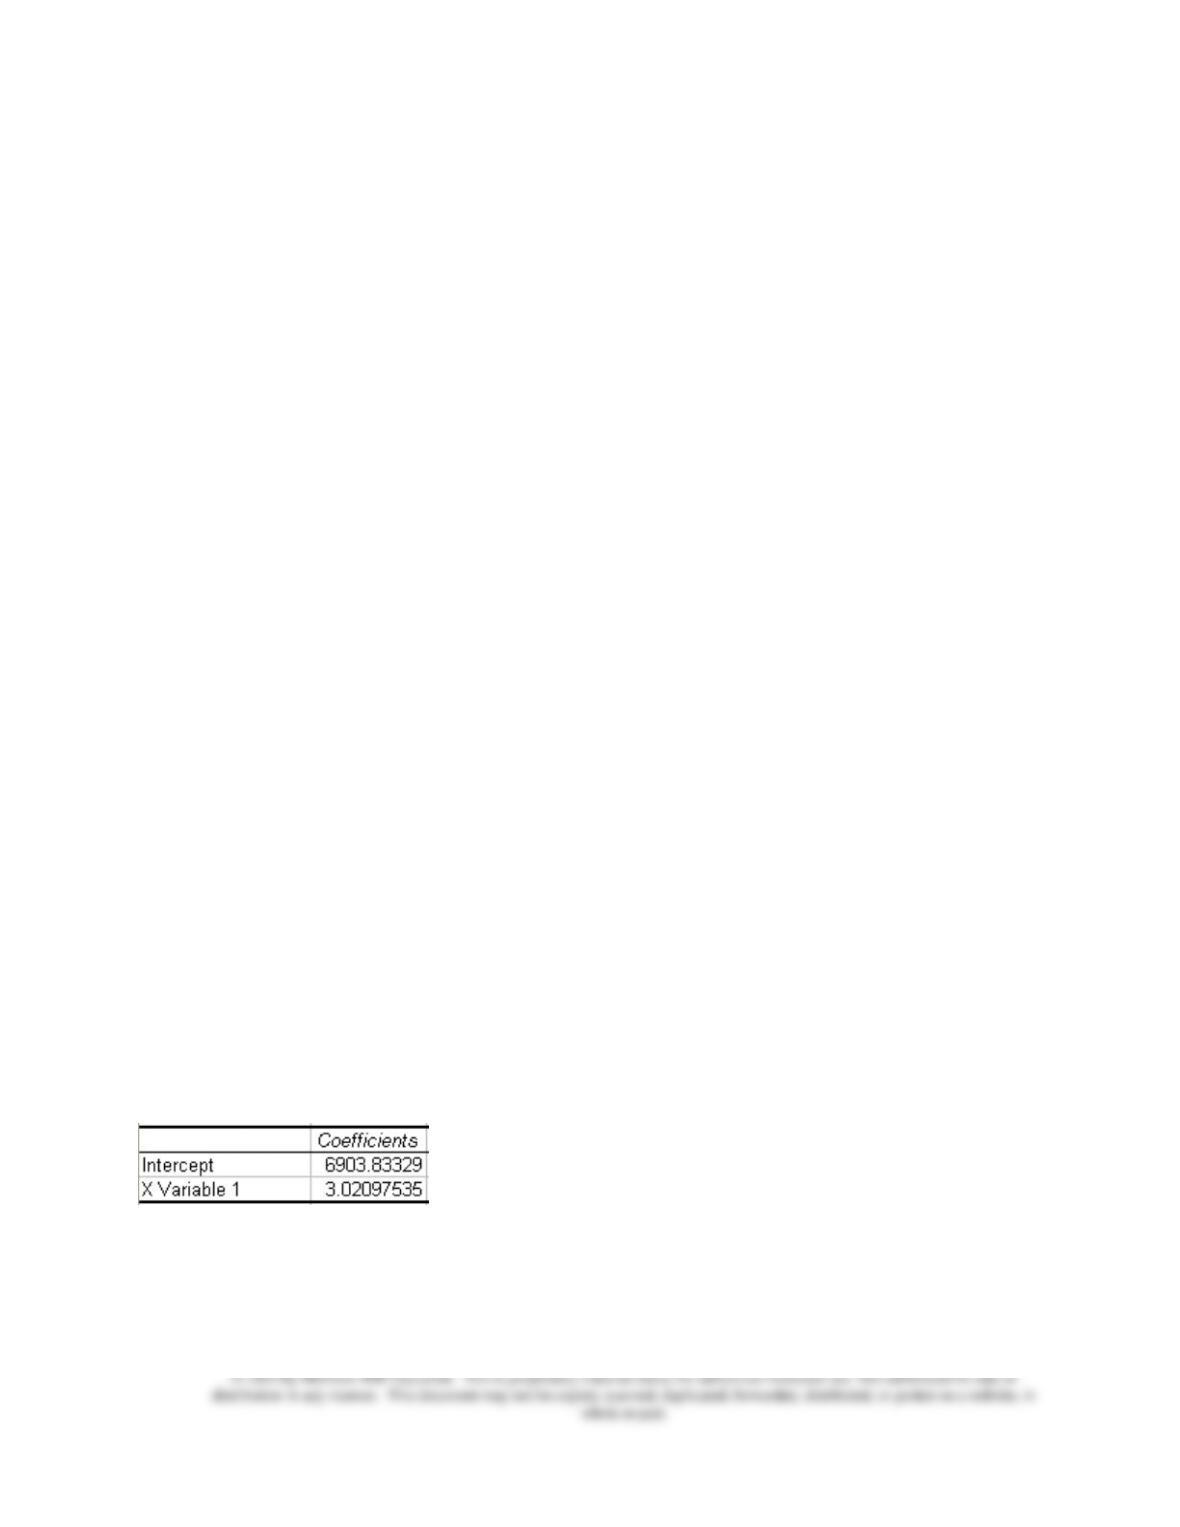
7. The following shows a partial printout of a regression analysis.
a. The fixed cost component is $6,903.
b. The variable cost per unit is $3.02.
c. Projected total cost for 400 units of activity will be $8,111.
d. All of the above.

Chapter 05 – Cost Estimation
5-23
8. Regression analysis
a. Is always accurate.
b. Uses statistical techniques.
c. May involve more than one predictor variable.
d. Both b and c.
9. The data used to estimate cost function
a. May be misplaced.
b. Are not subjected to inflation.
c. Never include allocated costs.
d. Are all within the relevant range.
10. It takes 80 hours of labor time to complete the first unit of output. Assuming that the
company adopts the individual unit-time learning model with a 90 percent learning rate,
a. The 2nd unit will take 72 hours.
b. The time to finish the 3rd unit can’t be determined.
c. The fourth unit will take 64 hours.
d. Direct materials will be reduced because of learning.
11. High-low cost estimation
a. Provides a very precise cost estimate.
b. Assumes that costs behave linearly.
c. Uses extreme points which are always representative of the rest of the data.
d. Is used to determine total product costs.
12. Which of the following statements is correct?
a. Learning affects labor costs.
b. The presence of learning means that variable costs tend to decrease per unit as the
volume increases.
c. Failure to recognize learning effects can have unexpected consequences.
d. All of the above.
Chapter 05 – Cost Estimation
5-24
Answers