Chapter 03 – Fundamentals of Cost-Volume-Profit Analysis
3-10
Target volume in units =
Fixed cost (F) + [After-tax target profit / (1 – t)]
Unit contribution margin (P- V)
, where
[After-tax target profit / (1 – t)]
determines the required before-tax operating profit.
======================
Demonstration Problem 2
(Continued from Demonstration Problem 1)
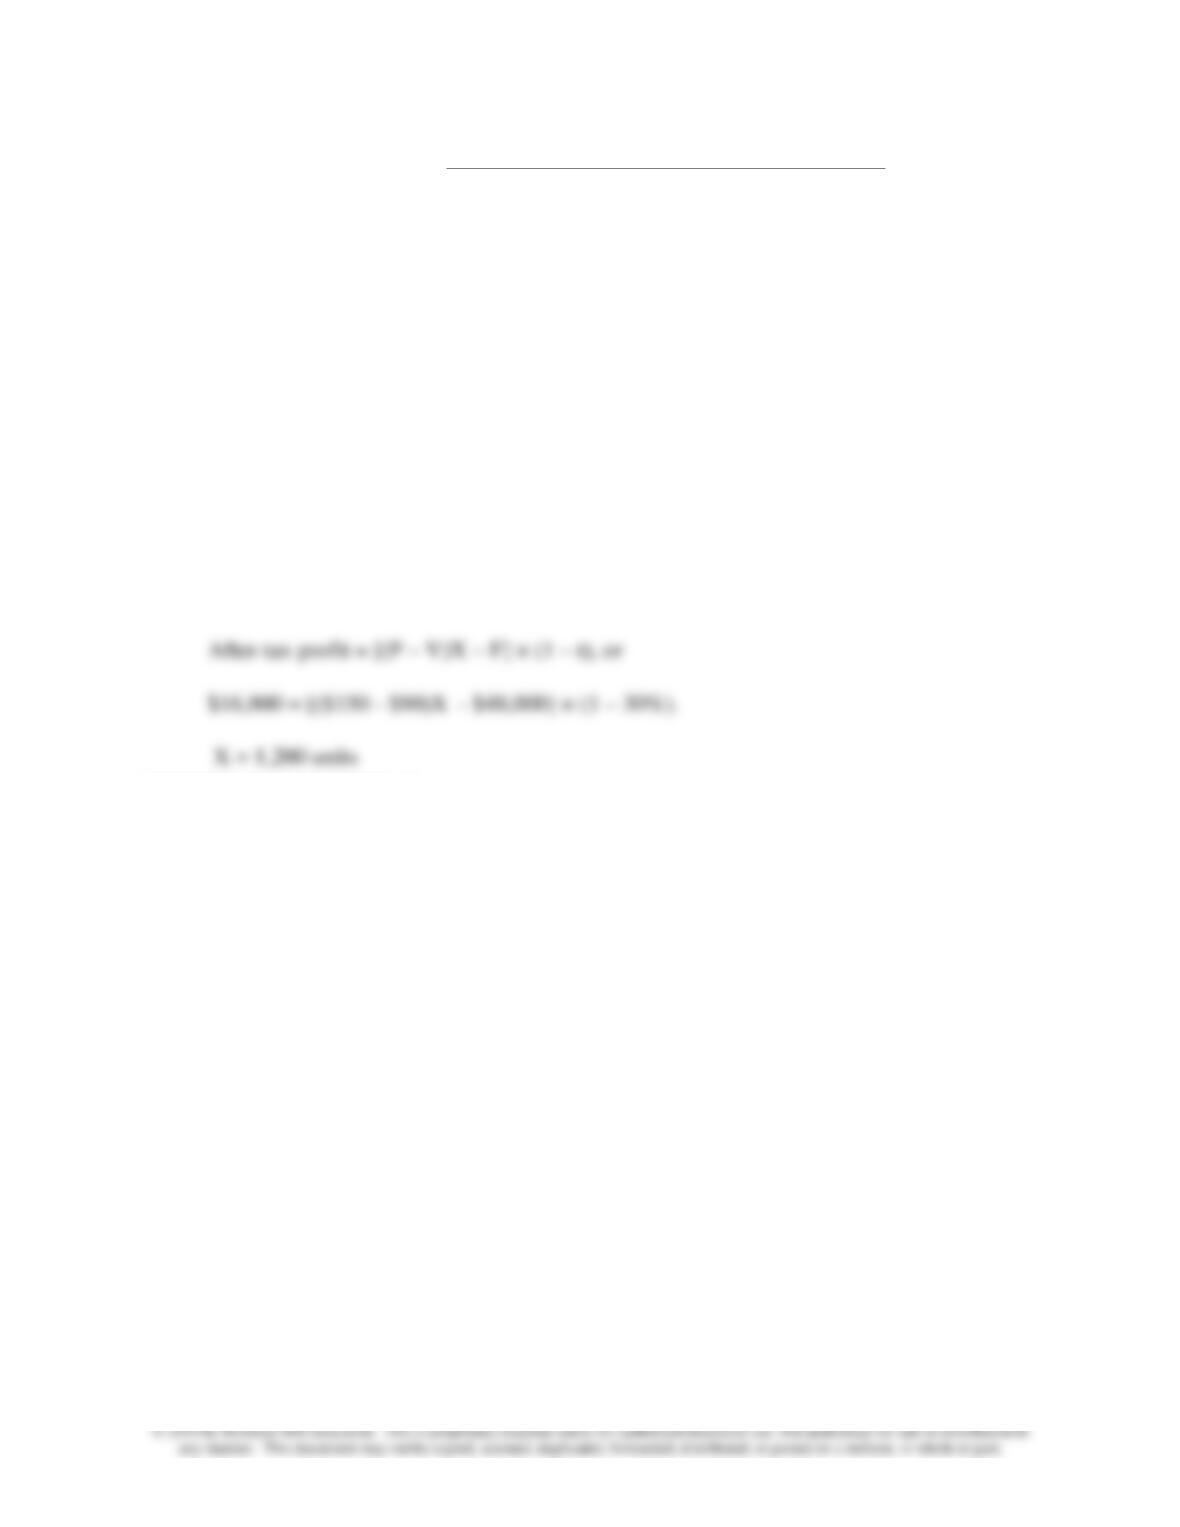
The Power Tool Division of ABC Hardware now faces a tax rate of 30 percent.
Required:
Determine the number of Jig Saws required to generate the after-tax operating profit of
$16,800.
Solution:
======================
• For firms that make multiple products, managers often assume a particular product mix
and compute break-even or target volumes using
(1) fixed product mix method, or
(2) weighted-average contribution margin method.
• Using the fixed product mix method, managers define a package or bundle of products
in the typical product mix and then compute the break-even or target volume for the
package. Once the break-even point is calculated for the number of packages required,
the product mix in the package will be multiplied to determine the required units for
each product.
• Assuming a constant product mix, the second method calculates a weighted-average
contribution margin per unit for all of the products considered. The break-even formula
determines the required total number of units for all products involved. Multiplying the
total by the respective “weights” in the product mix determines the required units for
each product.
Chapter 03 – Fundamentals of Cost-Volume-Profit Analysis
3-11
======================
Demonstration Problem 3
(Continued from Demonstration Problem 1)
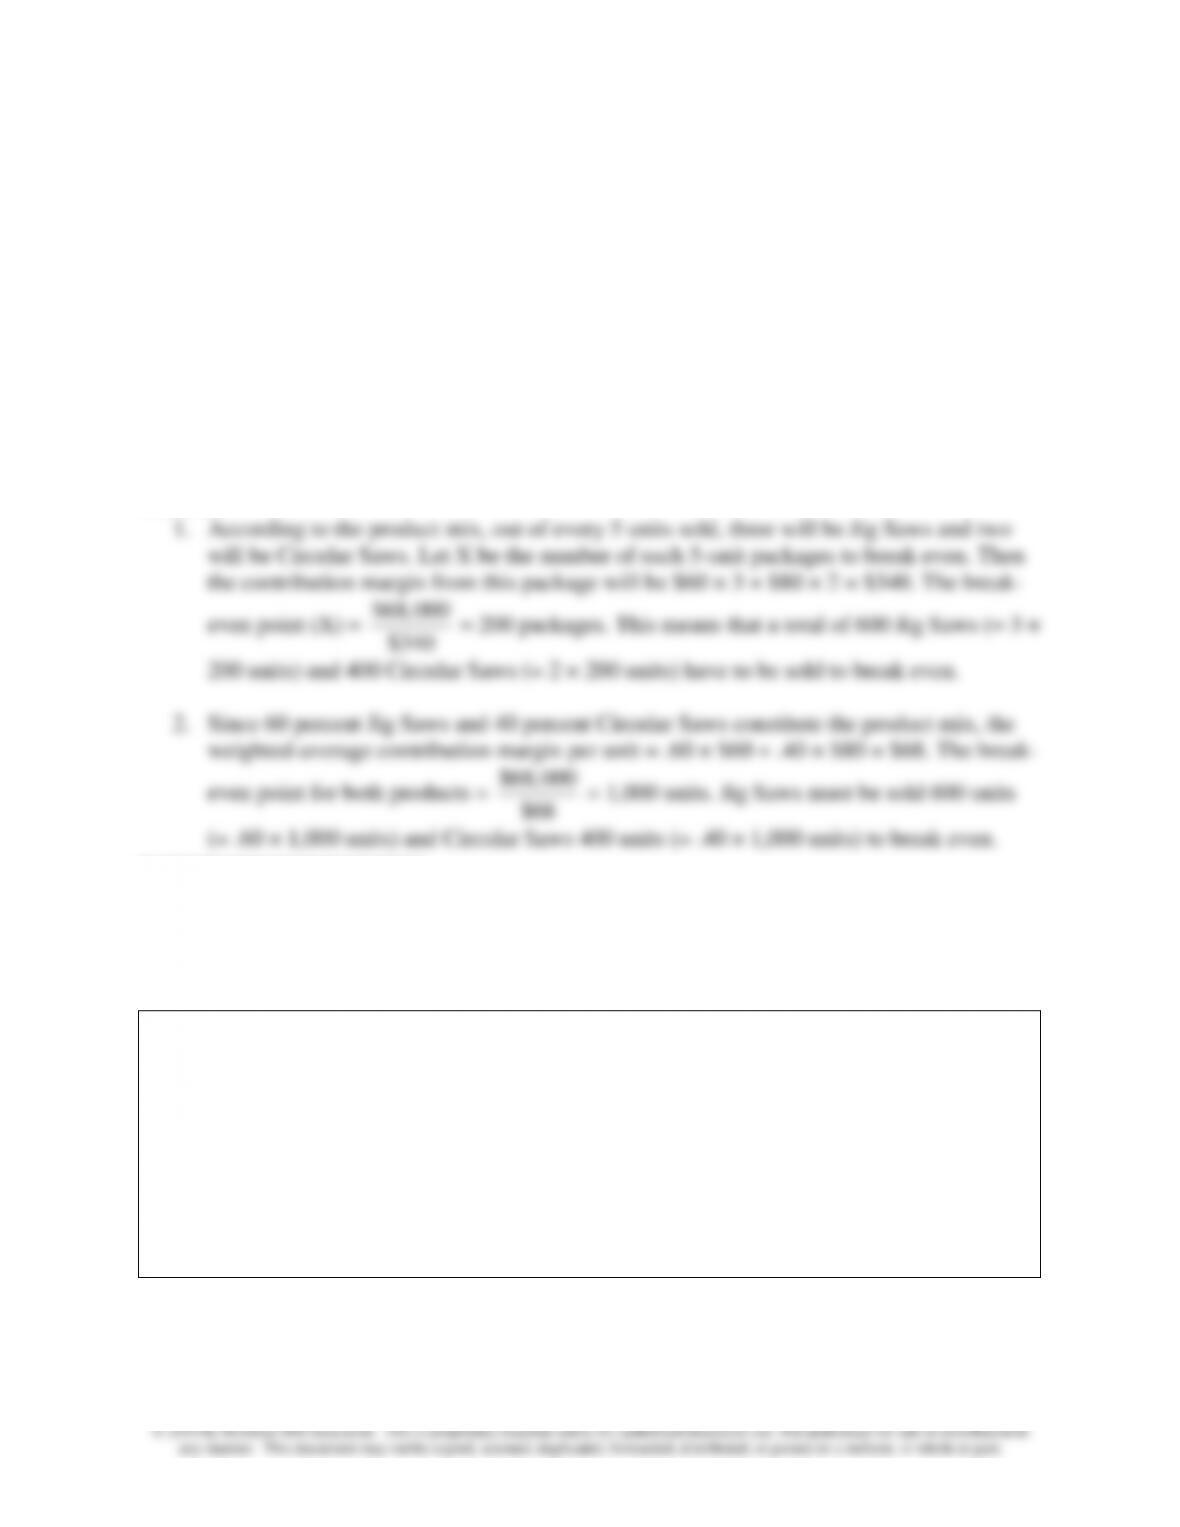
The Power Tool Division of ABC Hardware introduces a second product, Circular Saw, whose
unit price and unit variable cost are $200 and $120, respectively. The total fixed cost is increased
to $68,000. The manager of ABC Hardware estimates that Jig Saws and Circular Saws will sell
in a 3:2 ratio.
Required: Calculate the break-even volume in units using
1. fixed product mix method, and
2. weighted-average contribution margin method.
Solution:
======================
♦ When more complicated cost structures are considered, the basic setup developed so far must
be adapted to deliver relevant information for decision making.
Example 3: Consider the fixed cost that follows a step-cost pattern over the relevant
range as machine capacity is limited. If the break-even calculation results in a required
volume that is within the existing capacity, no further consideration is needed.
If, on the other hand, the required volume exceeds the existing capacity, then additional
fixed cost must be incurred to bring up the capacity, and a new break-even volume will
be calculated. The new volume must be within the now higher capacity to be viable, or
another iteration of calculations ensues.

Chapter 03 – Fundamentals of Cost-Volume-Profit Analysis
3-12
LO 3-5 Understand the assumptions and limitations of CVP analysis.
♦ CVP analysis relies on certain assumptions that may limit the applicability of the results for
decision making.
• The limitations are due to the assumptions made, not inherent to the method of CVP
analysis itself.
• It is usually assumed that unit variable cost and unit price are constant for all levels of
volume.
• Simplifying assumptions are easier to deal with, but can be relaxed to incorporate more
realistic situations.
• The more important the decision, the more the manager will want to ensure that the
assumptions made are suitable.
• The degree of sensitivity of the decisions to the assumptions made dictates caution
about the results and the need for considering alternative assumptions.

Chapter 03 – Fundamentals of Cost-Volume-Profit Analysis
3-13
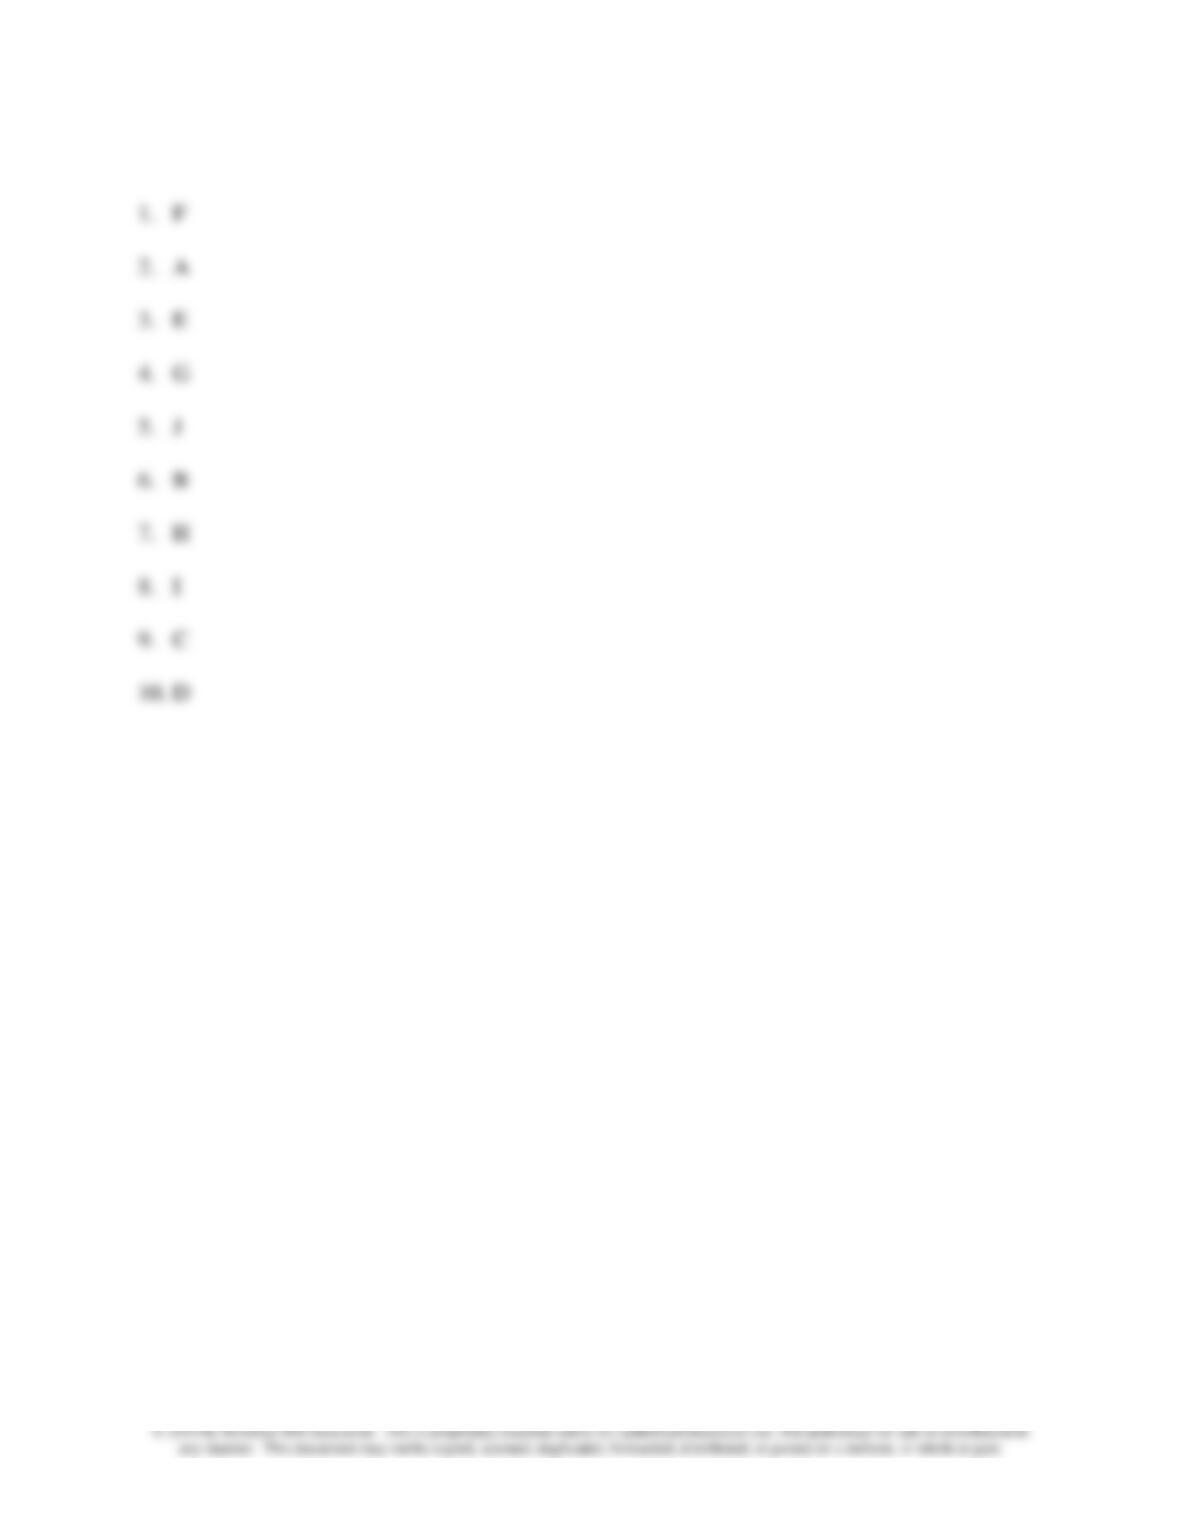
Matching
A.
Break-even point
F.
Profit equation
B.
Contribution margin ratio
G.
Profit-volume analysis
C.
Cost-volume-profit analysis
H.
Total contribution margin
D.
Margin of safety
I.
Unit contribution margin
E.
Operating leverage
J.
Cost structure
_____ 1. Total revenues (TR) – Total costs (TC).
_____ 2. The volume level at which profits equal zero.
_____ 3. The extent to which an organization’s cost structure is made up of fixed costs.
_____ 4. A version of the CVP analysis using a single profit line.
_____ 5. The proportion of an organization’s fixed and variable costs to its total costs.
_____ 6. The contribution margin expressed as a percentage of sales revenue.
_____ 7. Total costs – Total variable costs.
_____ 8. Unit price – Unit variable cost.
_____ 9. Studies the relations among revenues, costs, and volume and their effect on profit to
help managers make decisions.
_____ 10. The excess of projected or actual sales over the break-even volume.
Chapter 03 – Fundamentals of Cost-Volume-Profit Analysis
3-14
Answers

Chapter 03 – Fundamentals of Cost-Volume-Profit Analysis
3-15
Multiple Choice
The following information is for questions 1 – 4.
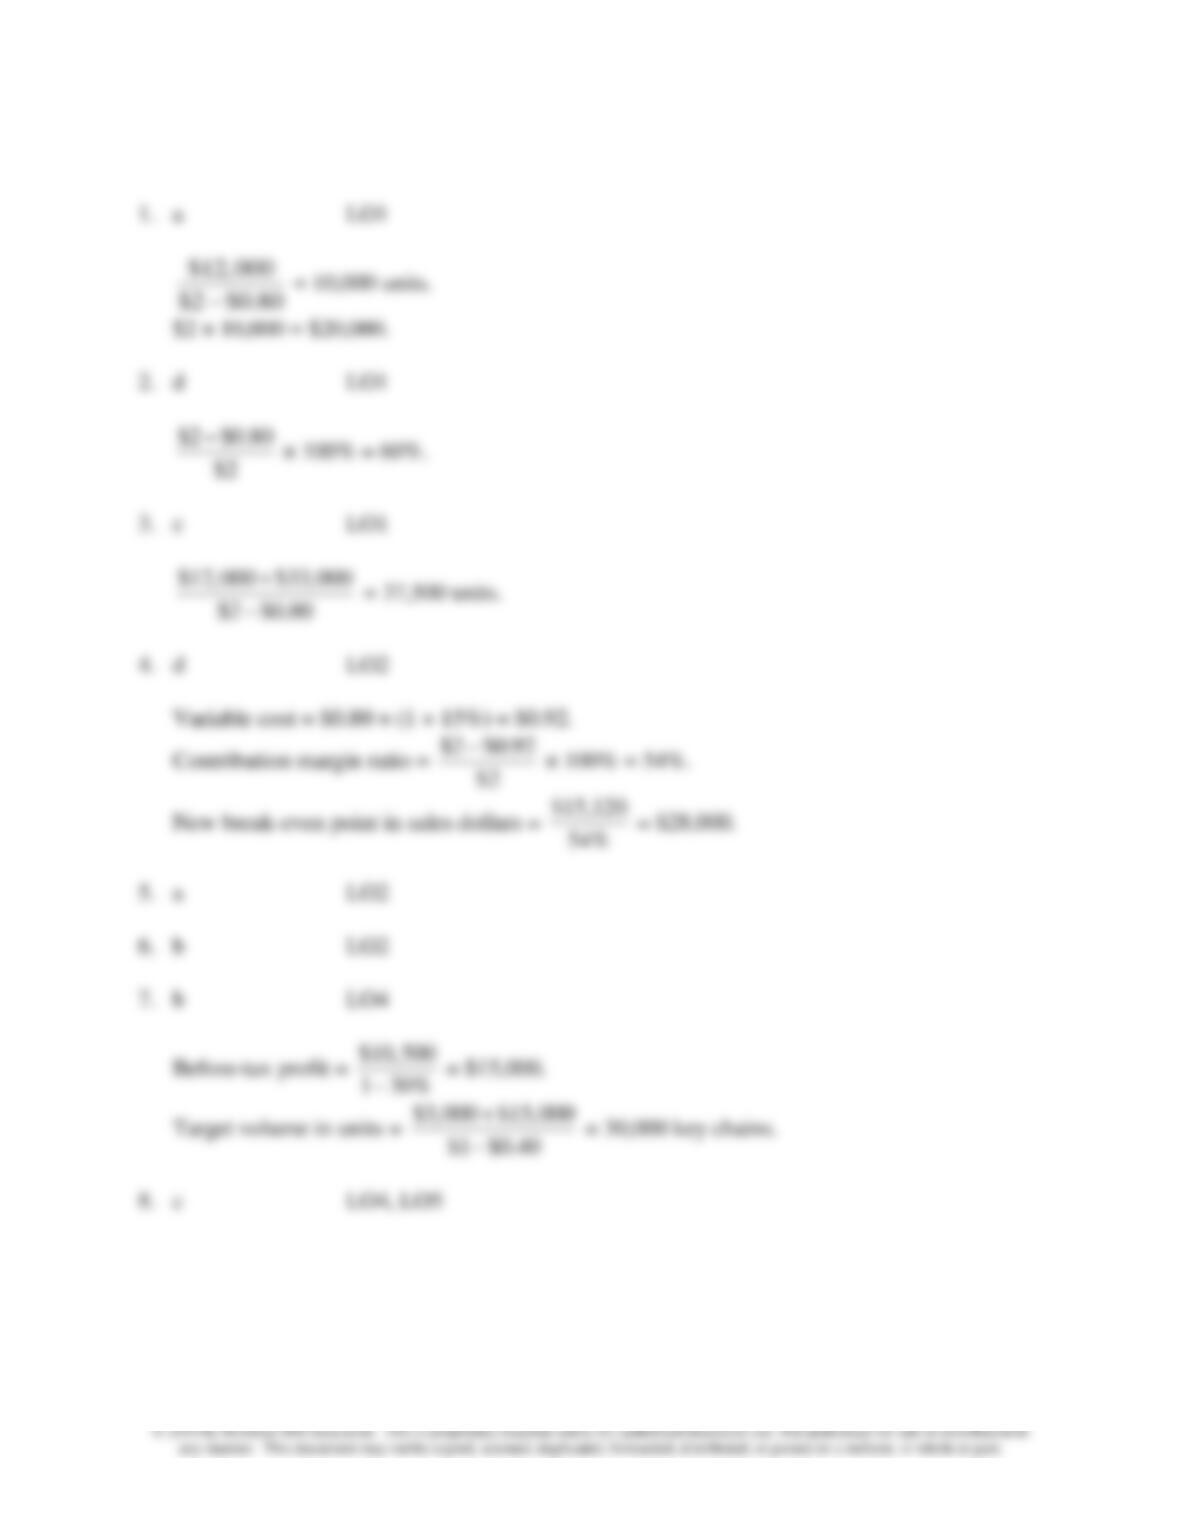
Company A currently sells a product for $2 each. Fixed cost and unit variable cost are $12,000
and $0.80, respectively.
1. What is the break-even point in units and in sales dollars, respectively?
a. 10,000 units and $20,000.
b. 12,000 units and $24,000.
c. 10,000 units and $15,000.
d. 20,000 units and $20,000.
2. What is the contribution margin ratio?
a. 20%.
b. 30%.
c. 40%.
d. 60%.
3. To reach a target profit of $33,000, how many units of output should be sold?
a. 22,500 units.
b. 31,750 units.
c. 37,500 units.
d. 42,000 units.
4. If variable cost per unit is increased by 15%, fixed cost is increased to $15,120, and the unit
price remains the same, what is the new break-even point in sales dollars?
a. $22,000.
b. $24,000.
c. $26,000.
d. $28,000.
5. Relative to companies with low operating leverage, a company with high operating leverage
a. Is more sensitive to economic fluctuations.
b. Has a high proportion of variable costs.
c. Experiences a smaller break-even volume.
d. Has a low contribution margin per unit.
6. The excess of actual or projected sales over the break-even sales is known as
a. Contribution margin.
b. Margin of safety.
c. Gross margin.
d. Target profit.

Chapter 03 – Fundamentals of Cost-Volume-Profit Analysis
3-16
7. A company produces key chains. The data include price $1, unit variable cost $0.40, monthly
fixed cost $3,000 and tax rate 30%. The owner wants to earn an after-tax profit of $10,500
per month. How many key chains must be produced and sold to meet that goal?
a. 24,000.
b. 30,000.
c. 32,000.
d. 36,000.
8. When more than one product is involved,
a. The CVP method reaches its limit.
b. No particular assumption is needed to calculate the break-even volume.
c. A fixed product mix will produce a unique break-even solution.
d. Weighted-average product mix method can be used.
9. A start-up company manufactures two products: X is sold for $5 with variable cost of $3
each; Y is sold for $8 with variable cost of $4 each. An annual fixed cost of $10,000 is
projected. The marketing department estimates a 3:1 ratio between X and Y. How many units
of X must be sold to break even for the first year of operation?
a. 3,000.
b. 3,600.
c. 1,000.
d. 1,500.
10. CVP analysis
a. Requires certain assumptions to be made.
b. Is inherently limited by its applicability.
c. Usually assumes unit variable cost to be constantly changing.
d. Does not allow for alternative assumptions.
11. In October, Fashionable Clothing manufactured 2,000 items with the following financial
statement amounts:
Direct materials $12,000, Sales $48,000, Direct labor $16,000, Depreciation $3,600, Rent
$1,500, and Variable overhead $9,000.
How much is contribution margin per unit?
a. $5.50.
b. $2.95.
c. $3.40.
d. $4.10.
12. Which of the following statements regarding margin of safety is correct?
a. The margin of safety indicates the risk of losing money.
b. The break-even sales volume is not considered.
c. Margin of safety is expressed in sales dollars only.
d. The higher the fixed costs, the lower the margin of safety.
Chapter 03 – Fundamentals of Cost-Volume-Profit Analysis
3-17
Answers
Chapter 03 – Fundamentals of Cost-Volume-Profit Analysis
3-18
© 2014 by McGraw-Hill Education. This is proprietary material solely for authorized instructor use. Not authorized for sale or distribution in
any manner. This document may not be copied, scanned, duplicated, forwarded, distributed, or posted on a website, in whole or part.
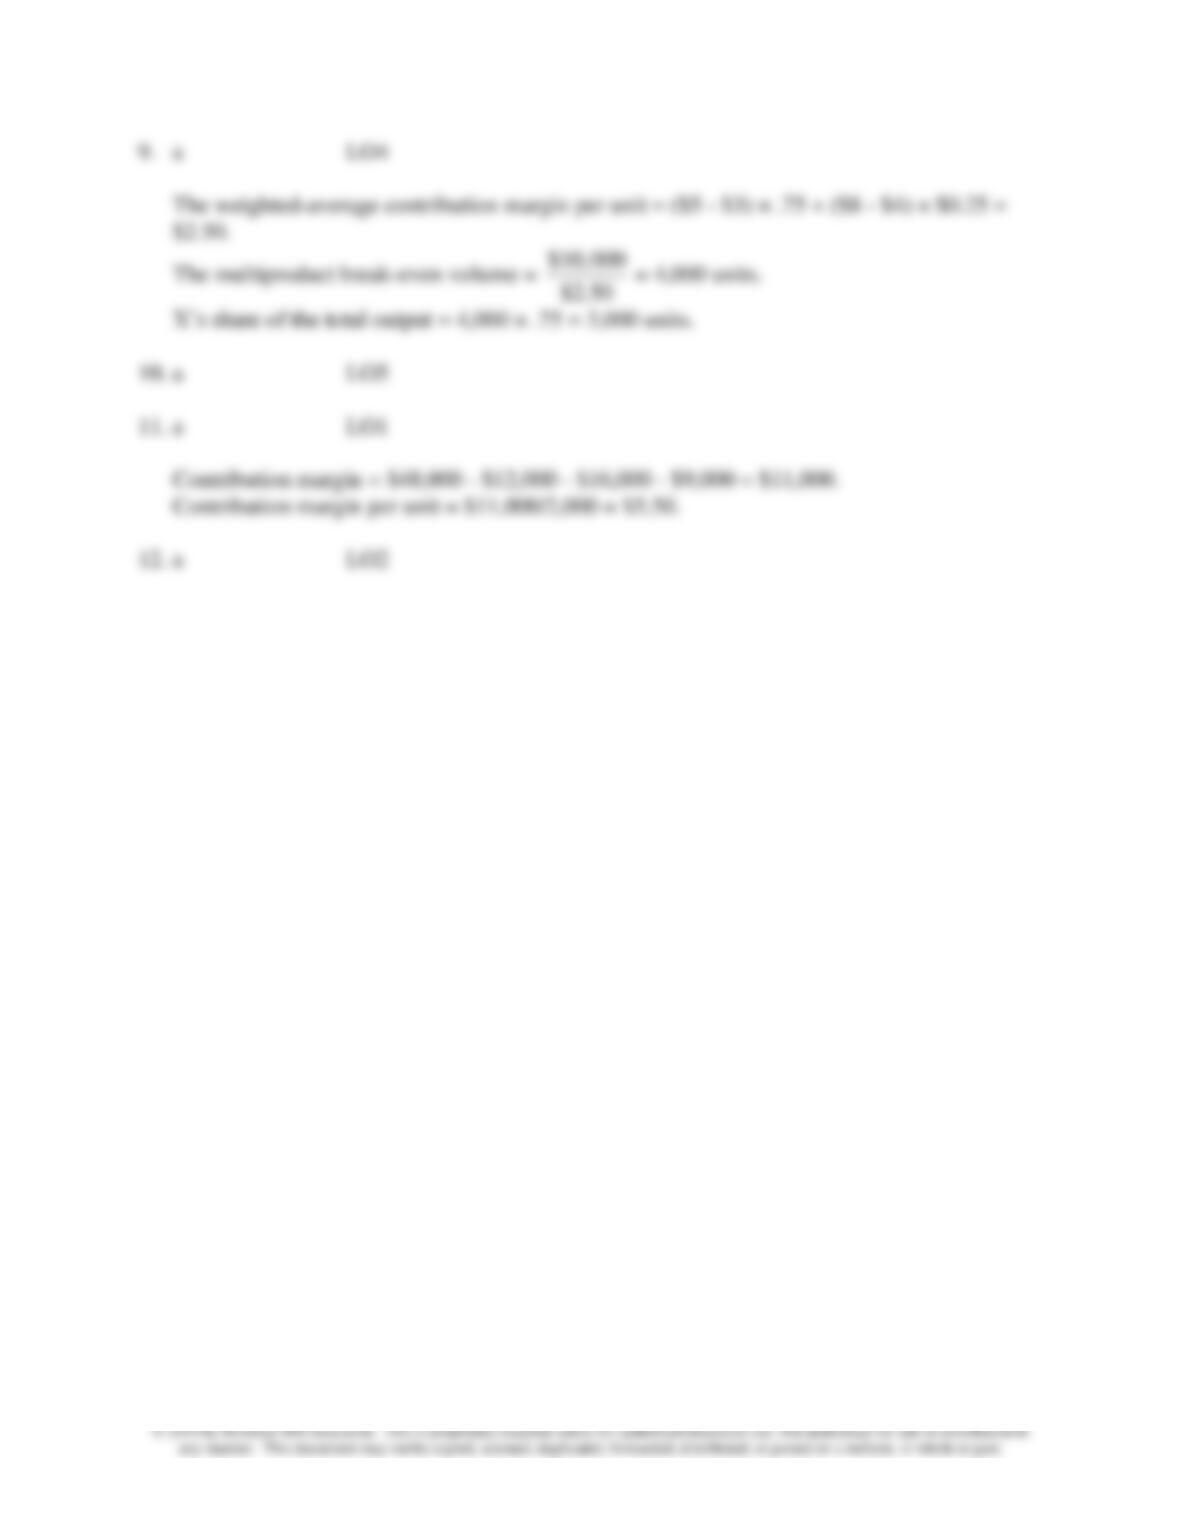
9. a LO4
The weighted-average contribution margin per unit = ($5 – $3) × .75 + ($8 – $4) × $0.25 =
$2.50.
The multiproduct break-even volume =
$10,000
$2.50
= 4,000 units.
X’s share of the total output = 4,000 × .75 = 3,000 units.
10. a LO5
11. a LO1
Contribution margin = $48,000 – $12,000 – $16,000 – $9,000 = $11,000.
Contribution margin per unit = $11,000/2,000 = $5.50.
12. a LO2