
Chapter 18 – Performance Measurement to Support Business Strategy
18–11
LO 18-6 Identify examples of nonfinancial performance measures and
discuss the potential for improved performance resulting from
improved activity management.
♦ Performance measures must be based on the organization’s responsibilities, goals, and
strategies, which are likely to be different for each organization.
• Customer satisfaction measures are important not as an end, but because the
organization believes there is a link between satisfied customers and firm profitability.
• Customer satisfaction measures reflect the organization’s performance on several
internal factors, including quality control and delivery performance.
• Quality control
– Objective: To increase customer satisfaction with the product, reduce the costs
of dealing with customer complaints, and reduce the costs of repairing products or
providing a new service.
– Measures: Number of customer complaints, number of service calls, and number
or returns.
• Delivery performance
– Objective: To deliver goods and services when promised.
– Measures: Percentage of on-time deliveries and percentage of deliveries
damaged.
• Bookings and purchase orders are a leading indicator of revenues that have to be
measured off the book because companies do not record them as sales.
• Market share must be measured relative to market size (i.e., its growth). If the market
grows faster than the company’s increasing sales, the company is experiencing a decline
in market share.
♦ An organization must evaluate its internal functional process performance while serving
external customers.
• Many activities are performed throughout the product life cycle. The level of efficiency
of processing activities affects the organization’s overall performance in meeting its
responsibilities to other stakeholders.
Chapter 18 – Performance Measurement to Support Business Strategy
18–12
• Exhibit 18.7 presents several internal functional performance measures used by
organizations. Many internal performance measures relate to the organization’s
performance with respect to its customers as well.
• Manufacturing cycle time represents the time involved in processing, moving, storing,
and inspecting products and materials. It is the total time taken to produce a good or
service.
• It is believed that a product’s service, quality, and costs are all related to cycle time.
• Manufacturing cycle efficiency measures the efficiency of the total manufacturing
cycle.
Manufacturing cycle
efficiency for one unit
=
Processing time
Processing time + Moving time + Storing time + Inspection time
.
This formula calculates a percentage representing the time actually spent processing the
unit. The higher the percentage, the less the time (and costs) that needs to be spent on
nonvalue-added activities.
Example 3: Tom operates a computer store that accepts custom orders for desktop
computers. Customers can choose from a variety of components such as motherboards,
CPUs, hard drives, DRAMs, graphics cards, sound cards, etc.
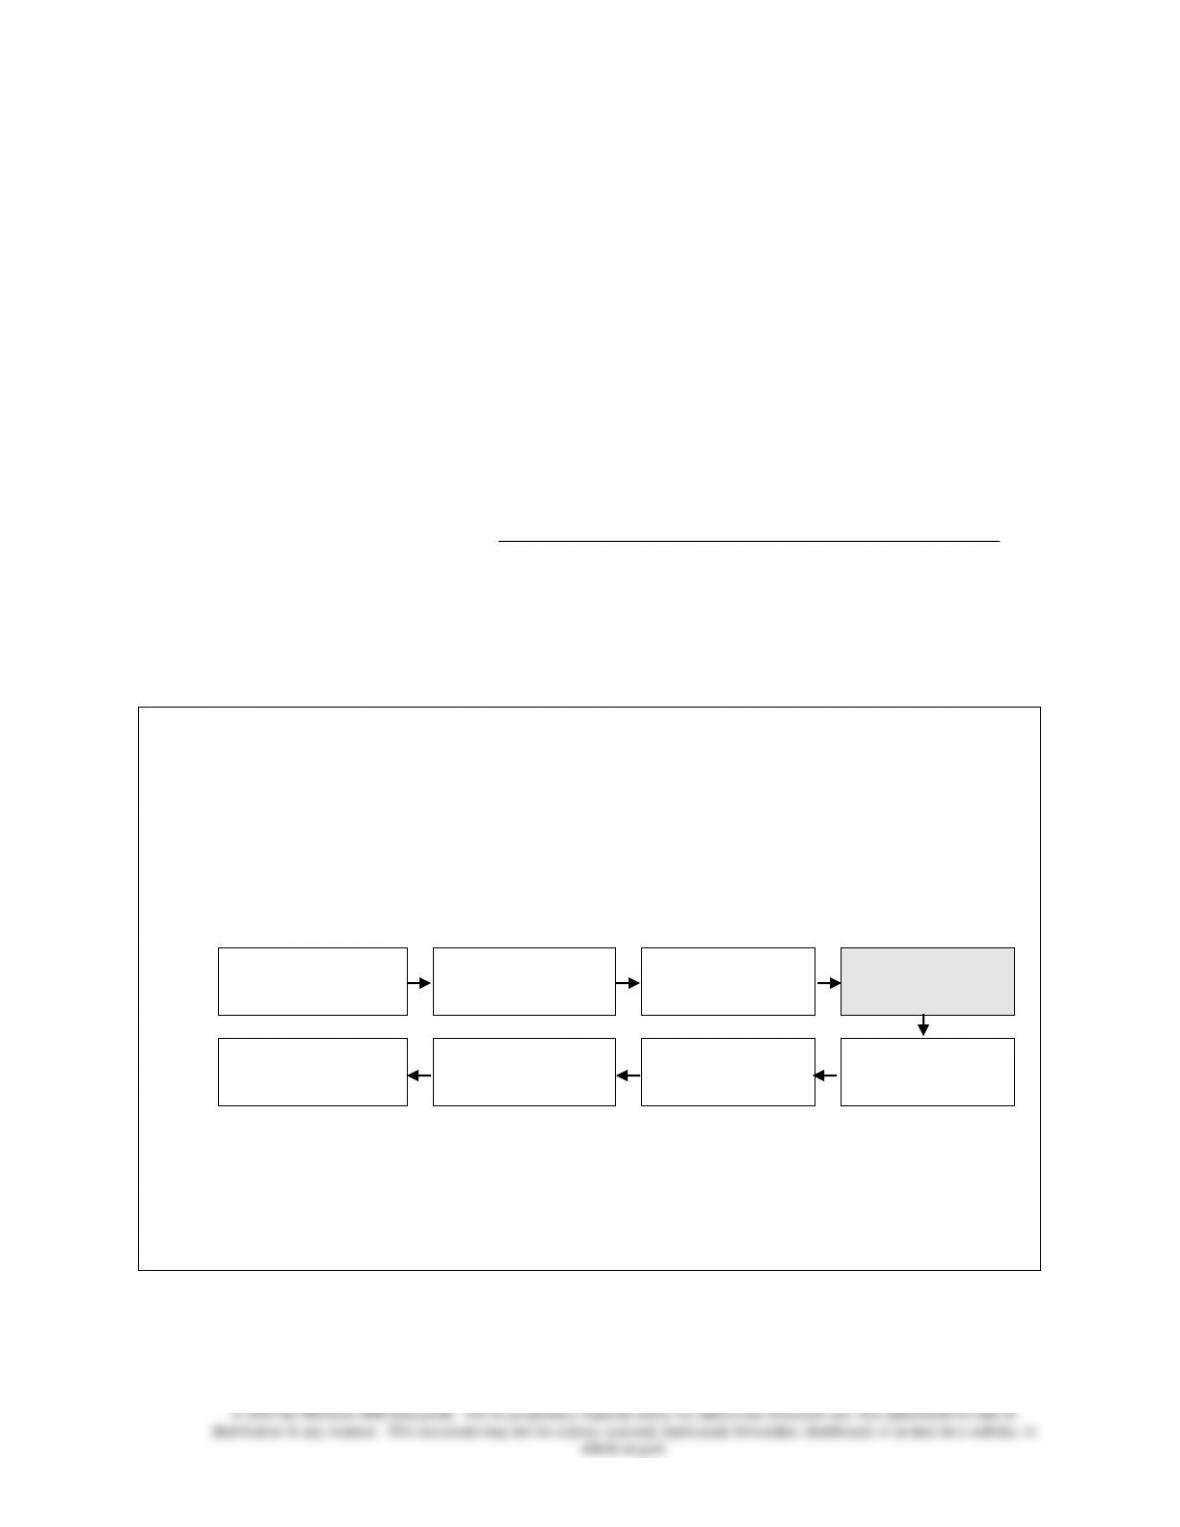
The steps needed to fulfill each order (i.e., one individual computer) and the time it
takes are:
Discuss and finalize
specifications
(1 hour)
Gather components
into a kit
(1 hour)
Wait in the queue
(1/2 hour)
Assemble
(3 hours)
Deliver
(48 hours)
Package
(1/2 hour)
Test
(1 hour)
Wait in the queue
(1/2 hour)
The total manufacturing cycle time is 55.5 hours, out of which the processing time is
only 3 hours (assemble). So the manufacturing cycle efficiency for a typical order is
0.055 (= 3 hours ÷ 55.5 hours).

Chapter 18 – Performance Measurement to Support Business Strategy
18–13
• Productivity is a measure that expresses the efficient conversion of inputs into outputs.
Partial productivity measures the relation between output and a single input, or
Partial productivity
=
Output (quantity or value)
Single input such as labor (quantity or value)
.
• Partial productivity measures are closely related to the manufacturing efficiency
variances (discussed in Chapter 16).
• Recall that efficiency variance is the difference between budgeted and actual results
arising from differences between the inputs that were budgeted per unit of output and the
inputs actually used.
• The efficiency variance is a good basis for assessing how a manufacturing plant is doing
as compared to engineering standards; if these standards do not change over time, they
are also a basis for assessing whether the plant is improving.
• Partial productivity is an absolute measure that can be used to compare different
business units and, when publicly available data permit it, to allow benchmarking against
competitors. Both quantity and value should be evaluated to ensure comparability.
• One approach for comparing the productivity of business units that use a different mix
of inputs (or even different inputs) is to calculate total factor productivity, a ratio of the
value of output to the value of all key inputs.
======================
Demonstration Problem
ChemUSA operates two highly automated chemical processing plants: East Plant and West Plant.
The same production process takes place in the two plants and turns material X into chemical
compound Y. In order to evaluate their productivity measures, the managers of ChemUSA have
the accounting department gather comparative operating and financial data in the follow table.
East Plant
West Plant
This year
Last year
This year
Last year
Inputs
X
30,000 lb @ $75
29,000 lb @ $73
50,000 lb @ $72
52,000 lb @ $71
Labor
4,000 h @ $15
3,740 h @$14
6,050 h @ $14
6,180 h @ $13
Overhead
$3,150,000
$2,878,000
$5,480,000
$5,672,500
Outputs
Y
26,500 lb
24,650 lb
43,100 lb
44,200 lb
Value
$7,380,000
$6,763,500
$11,089,300
$11,428,300

Chapter 18 – Performance Measurement to Support Business Strategy
18–14
Required:
Determine relevant partial productivity and total factor productivity measures for both plants
and compare the results.
Solution:
The accounting department recommends the calculation of two partial productivity measures
corresponding to the use of material input (X) and labor input (hours), respectively.
Material partial productivity = Output in pounds (lbs.) ÷ Input in pounds (lbs.)
Labor partial productivity = Output in pounds (lbs.) ÷ Input in labor hours.
In addition, total factor productivity is also calculated and includes as key inputs material (X),
labor and overhead. That is,
Total factor productivity =
Output value
Input value (costs of material, labor and overhead)
.
The results are presented in the following table:
East Plant
West Plant
This year
Last year
This year
Last year
Material partial productivity
0.88a
0.85
0.86
0.85
Labor partial productivity
6.625b
6.59
7.12
7.15
Total factor productivity
1.35c
1.34
1.21
1.21
a 0.88 = 26,500 ÷ 30,000
b 6.625 = 26,500 ÷ 4,000
c 1.35 = $7,380,000 ÷ ($75 × 30,000 + $15 × 4,000 + $3,150,000)
West Plant has a higher capacity than East Plant and enjoys lower input costs for both
material and labor for the two years studied. Because of process improvements over the years,
the managers are pleased with higher material partial productivity at both plants.
However, West Plant suffers a setback in terms of labor partial productivity while its total
factor productivity stays the same. The managers would like to find out more about the labor
practices (recruitment, training, retention, etc.) at West Plant and encourage East Plant to
continue its pace for improvement.
======================
♦ Organizations should manage by using activity data rather than cost data to identify problems,
to suggest an approach to solve problems, and to prioritize improvement efforts.

Chapter 18 – Performance Measurement to Support Business Strategy
18–15
• Organizations find value in knowing the amount of time it takes to complete a sequence
of activities.
• By eliminating long cycle times, companies can reduce costs, improve quality, and add
value to customers.
• Not all companies see a performance improvement because they fail to link the
measures to the firm’s goals.
• Companies often make four mistakes when trying to measure nonfinancial performance.
(1) Not linking measures to strategy.
(2) Not validating the links.
(3) Not setting the right performance targets.
(4) Measuring incorrectly.
•Using a business model that identifies the connections between the measures and the
firm’s goals helps avoid these problems.
♦ Objective performance measures are such that different people can look at them and agree that
the method used to calculate the measure is correct, even though the choice of the measures is in
dispute.
• Subjective performance measures are such that two managers can view the same set of
facts and come to different conclusions.
• Subjective measures allow managers to consider many factors, including those outside
the employee’s control, that could distort an objective measure.
LO 18-7 Explain why employee involvement is important in an effective
performance measurement system.
♦ Nonfinancial measures have the advantage that they are more likely to be understandable by
employees directly involved in operations.
• The measures used to evaluate performance reflect each unit’s understanding of its
contribution to the organization.
• Line employees are thus encouraged to participate in performance improvement
activities.

Chapter 18 – Performance Measurement to Support Business Strategy
18–16
• Suggestion boxes, worker circles, and team meetings are ways for employees to suggest
ideas for improvements.
• Worker involvement is important for three reasons:
(1) When workers take on real decision-making authority, their commitment to the
organization and its objectives increases.
(2) When decision-making responsibility lies with workers closer to the customer,
workers are more responsive to customer concerns and can make informed decisions.
(3) Giving decision-making responsibility to workers uses their skills and knowledge and
motivates them to further develop those skills and knowledge in an effort to improve
the organization’s performance.
• Companies need to evaluate their own performance in getting workers involved and
committed.
• Exhibit 18.10 lists performance measures that organizations can use to assess their
accomplishments in terms of worker involvement and commitment.
• Worker involvement and commitment measures include
(1) Worker development (percentage of workers in mentor programs),
(2) Worker empowerment (percentage of workers authorized to issue credit),
(3) Worker recognition (percentage of workers recognized by awards),
(4) Worker recruitment (percentage of employment offers accepted),
(5) Worker promotion (percentage of positions filled from within the organization), and
(6) Worker succession planning (percentage of eligible positions filled through
succession planning).
• Increasing the percentages on these measures demonstrate the organization’s attempt to
increase worker involvement and commitment to it.
• Effective worker involvement presents three challenges for management.
(1) Management must create a system that conveys the organization’s objectives and
critical success factors to all members.
(2) The measures the organization uses to evaluate individual performance determine the
system’s success in promoting goal congruence. These measures must
– promote the desired behavior,
– be comprehensive,
– support the achievement of organization objectives, and