
Chapter 11 – Service Department and Joint Cost Allocation
11-1
Chapter 11
Service Department and Joint Cost Allocation
Learning Objectives
1. Explain why service costs are allocated.
2. Allocate service department costs using the direct method.
3. Allocate service department costs using the step method.
4. Allocate service department costs using the reciprocal method.
5. Use the reciprocal method for decisions.
6. Explain why joint costs are allocated.
7. Allocate joint costs using the net realizable value method.
8. Allocate joint costs using the physical quantities method.
9. Explain how cost data are used in the sell-or-process-further decision.
10. Account for by-products.
11. (Appendix) Use spreadsheets to solve reciprocal cost allocation problems.
Chapter Outline
I. SERVICE DEPARTMENT COST ALLOCATION
II. METHODS OF ALLOCATING SERVICE DEPARTMENT COSTS
A. Allocation bases
B. Direct method
1. Allocate information systems department costs
2. Allocate administration department costs
3. Limitations of the direct method
C. Step method
1. Allocate service department costs
2. Limitations of the step method
D. Reciprocal method
• Allocating service department costs
E. Comparison of direct, step, and reciprocal methods

Chapter 11 – Service Department and Joint Cost Allocation
11-2
III. THE RECIPROCAL METHOD AND DECISION MAKING
IV. ALLOCATION OF JOINT COSTS
A. Joint costing defined
B. Reasons for allocating joint costs
V. JOINT COST ALLOCATION METHODS
A. Net realizable value method
• Estimation of net realizable value
B. Physical quantities method
C. Evaluation of joint cost methods
VI. DECIDING WHETHER TO SELL GOODS NOW OR PROCESS THEM
FURTHER
VII. DECIDING WHAT TO DO WITH BY-PRODUCTS
VIII. SUMMARY
IX. APPENDIX: CALCULATION OF THE RECIPROCAL METHOD USING
COMPUTER SPREADSHEETS
Key Concepts
LO 11-1 Explain why service costs are allocated.
♦ In the first stage of the two-stage cost allocation, part of the overhead costs are incurred for
departments that do not produce the service or product directly.
• Service departments provide services to other departments in the organization.
Examples of service departments and what they do:
(1) Personnel, accounting, and purchasing departments provide services to production
departments.
(2) An information systems department provides support for information technology
support to other departments.
(3) A human resources department provides hiring and training services to other
departments.
• User departments use the functions of service departments. For example, the
production department uses the services provided by the information systems and human
resources departments.
• User departments could be other service departments or production or marketing
departments that produce or market the organization’s products.
• As shown in Exhibit 11.1, most user departments make use of all service departments.
Depending on the situation, the service departments also provide service to each other.

Chapter 11 – Service Department and Joint Cost Allocation
11-3
• An intermediate cost center is any cost center whose costs are charged to other
departments in the organization.
• A final cost center is a cost center, such as a production or marketing department,
whose costs are not allocated to another cost center.
• All organizations (service, merchandising, and manufacturing) have production or
marketing departments and service departments.
♦ Three methods to allocate service department overhead costs are:
(1) Direct method,
(2) Step method, and
(3) Reciprocal method.
• Service department costs are allocated for two purposes:
(1) To determine the cost to produce and market products or services.
(2) To encourage operating department managers to monitor service department costs
(cross-department monitoring).
• Each service department is an intermediate cost center whose costs are recorded as
incurred and then distributed to other cost centers.
• An important decision in cost allocation is to choose which allocation base to use. The
usual criteria (cause and effect, reasonableness, and fairness) are still important here.
LO 11-2 Allocate service department costs using the direct method.
♦ Direct method is a cost allocation method that charges costs of service departments to user
departments without making allocations between or among service departments.
• The direct method allocates costs directly to the final users of a service, ignoring
intermediate users.
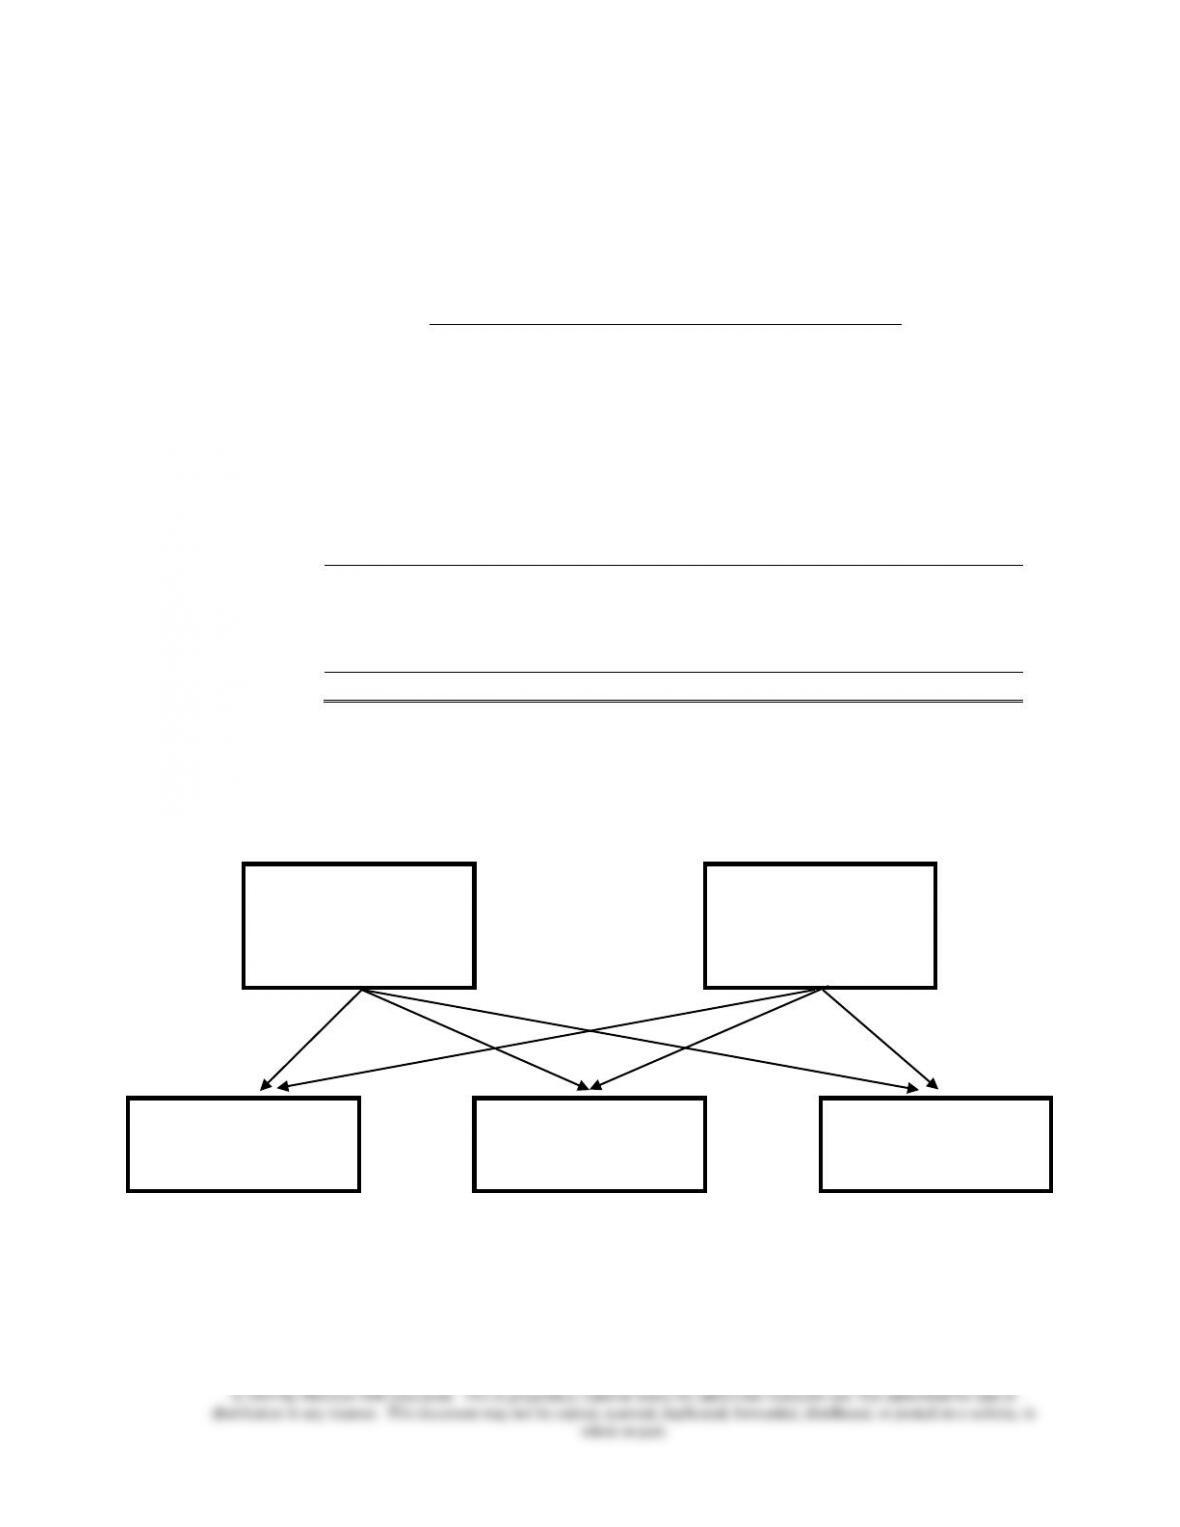
• Exhibit 11.4 is the cost flow diagram that illustrates the direct method.
• Using the direct method, there are no allocations between service departments. It
ignores the costs that the service departments themselves incur when they use services
from other departments. Cross-department monitoring is lost in that regard.

Chapter 11 – Service Department and Joint Cost Allocation
11-4
• The application of the direct method of cost allocation is shown in Exhibit 11.3.
• Exhibit 11.5 shows the flow of costs in T-accounts and the allocations to be recognized
for the departments when the direct method is used.
(1) The direct costs of service departments are first recorded in those service departments
and shown on the debit side of the service department accounts.
(2) Then service department costs are allocated to the user departments.
(3) The user departments also have direct costs (indicated as the direct overhead costs)
that do not have to be allocated to the user departments because they are debited to
the department accounts when incurred.
======================
Demonstration Problem 1
Kirby Industries has two service departments (S1 and S2) and three production departments (P1,
P2, and P3). The following table shows the costs incurred at the two service departments, as well
as the proportion of services provided by the two service departments to the other departments.
Proportion of services provided to:
Costs
incurred
Service
department
S1
S2
P1
P2
P3
$1,000,000
S1
–
20%
30%
40%
10%
260,000
S2
40%
–
20%
15%
25%
For example, service department S1 incurred $1,000,000 while providing 20 percent of its
services to service department S2, 30 percent to production department P1, 40 percent to
production department P2, and 10 percent to production department P3.
For simplicity, the direct costs incurred by the production departments are ignored.
The general manager of Kirby Industries wanted to know how the service department costs can
be allocated to the production departments in order to facilitate performance evaluation.
Required:
Allocate the service department costs to the production departments using the direct method.
Chapter 11 – Service Department and Joint Cost Allocation
11-5
Solution:
The proportion of services to be allocated has to be revised since allocations between the two
service departments are not allowed under the direct method. These are relative usages that
ignore the mutual support between the service departments.
(Revised) Proportion of services to be allocated:
Service
department
S1
S2
P1
P2
P3
S1
–
–
37.5%a
50.0%
12.5%
S2
–
–
33.3%b
25.0%
41.7%
a 37.5% = 30% ÷ (30% + 40% + 10%).
b 33.3% = 20% ÷ (20% + 15% + 25%).
Costs allocated to:
From:
S1
S2
P1
P2
P3
Costs incurred
$1,000,000
$260,000
$0
$0
$0
S1
(1,000,000)
0
375,000c
500,000
125,000
S2
0
(260,000)
86,667d
65,000
108,333
Total
$0
$0
$461,667
$565,000
$233,333
c $375,000 = $1,000,000 × 37.5%.
d $86,667 = $260,000 × 33.3%.
S1
To P1: $375,000
To P2: $500,000
To P3: $125,000
S2
To P1: $86,667
To P2: $65,000
To P3: $108,333
P1
From S1: $375,000
From S2: $86,667
P2
From S1: $500,000
From S2: $65,000
P3
From S1: $125,000
From S2: $108,333
======================

Chapter 11 – Service Department and Joint Cost Allocation
11-6
LO 11-3 Allocate service department costs using the step method.
♦ Step method is the method of service department cost allocation that allocates some service
department costs to other service departments.
• The step method recognizes that some services are provided by one service department
to others.
• The sequence of allocation is determined so that the allocation begins with
(1) the service department that has provided the largest proportion of its total services to
other service departments, or
(2) the service department with the largest cost.
• The percentage of service costs ignored in the step allocation process is minimized by
choosing either of the allocation orders suggested.
• Once an allocation is made from a service department, no further allocations are made
back to that department.
• A service department that provides services to, and receives services from, another
service department has only one of these two relationships recognized.
• Exhibit 11.6 shows the computation of the step method.
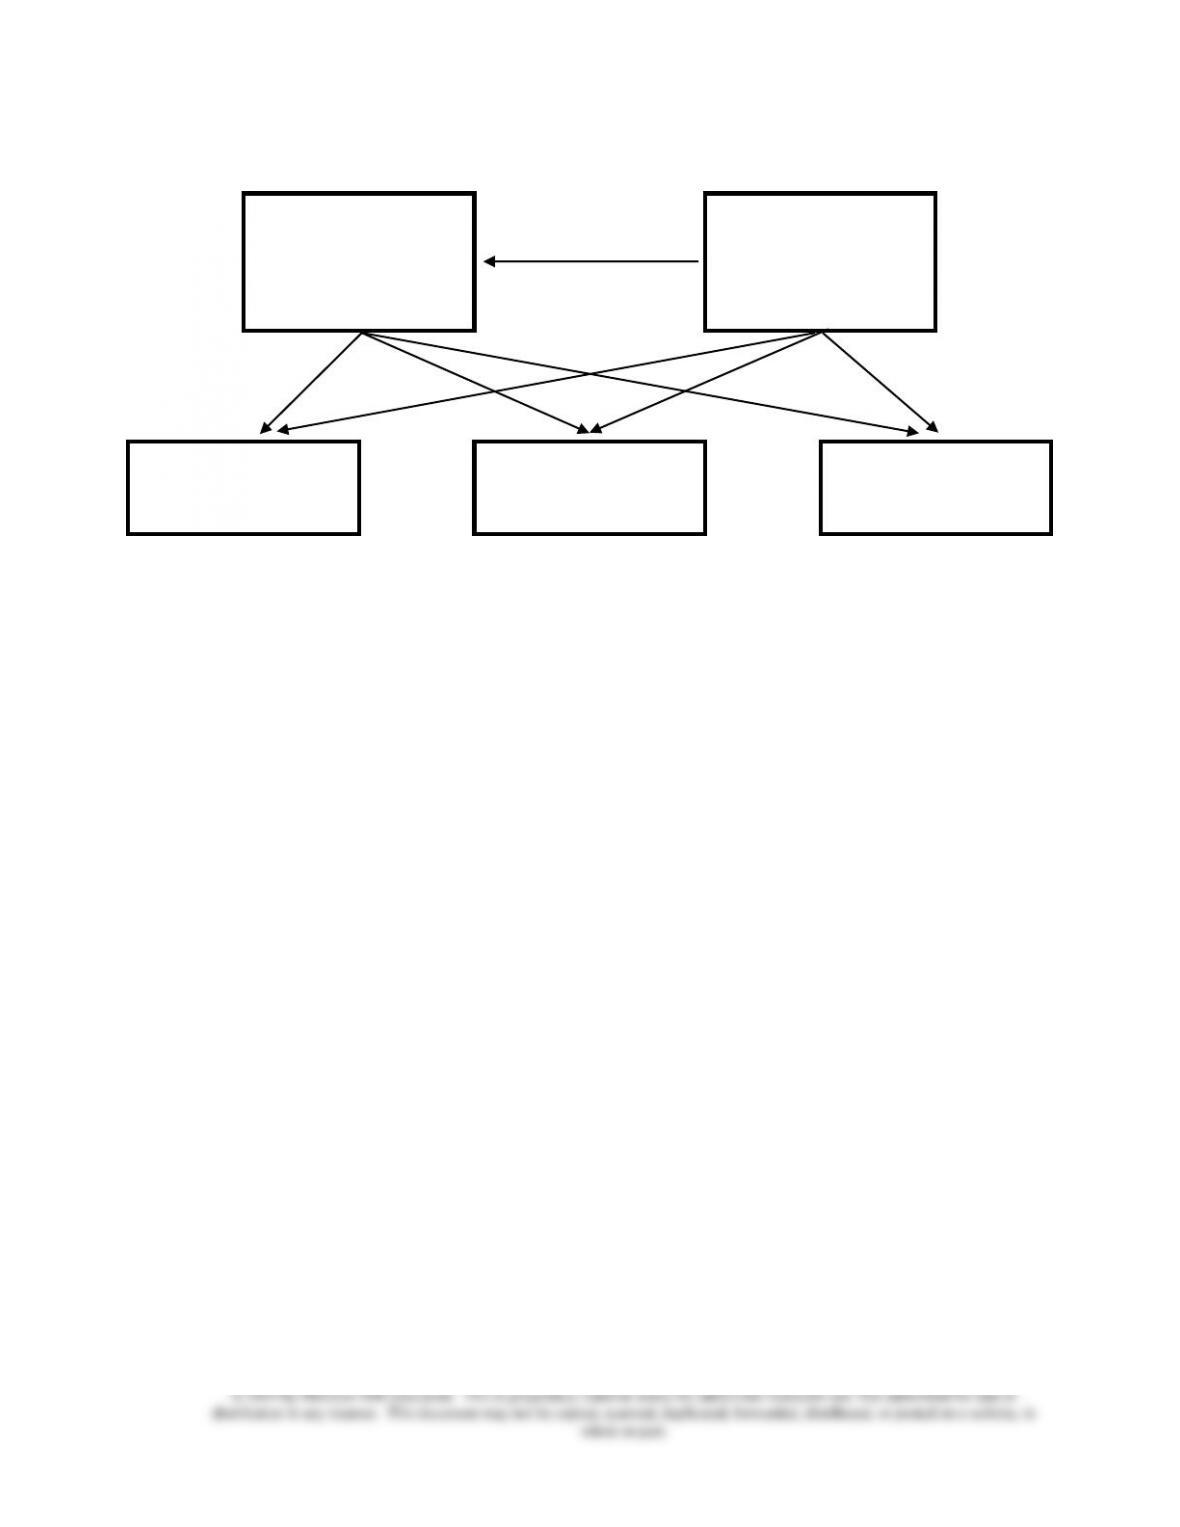
• Exhibit 11.7 is the cost flow diagram for the step method example.
• The flow of costs through the accounts is shown in Exhibit 11.8.
• The step method may result in more reasonable allocations than the direct method
because it recognizes that some service departments use other service departments for
support.
• The step method does not recognize reciprocal services.
• The step method is not necessarily better than the direct method when both the costs
and benefits of using cost allocation are considered. A company already uses the direct
method can find it uneconomical to switch methods.
======================

Chapter 11 – Service Department and Joint Cost Allocation
11-7
Demonstration Problem 2
(Continued from Demonstration Problem 1)
The data were reproduced here.
Proportion of services provided to:
Costs
incurred
Service
department
S1
S2
P1
P2
P3
$1,000,000
S1
–
20%
30%
40%
10%
260,000
S2
40%
–
20%
15%
25%
Required:
Allocate the service department costs to the production departments using the step method
(where the allocation begins with the service department that provides the largest proportion
of its total services to other service departments).
Solution:
Since the service department S2 provides the largest proportion of its services to the other
service department (40 percent vs. S1’s 20 percent), S2’s costs would be allocated first to all
other departments. Once it is done, S1’s costs should not be allocated back to S2.
(Revised) Proportion of services to be allocated:
Service
department
S1
S2
P1
P2
P3
S2
40.0%
–
20.0%
15.0%
25.0%
S1
–
–
37.5%a
50.0%
12.5%
a 37.5% = 30% ÷ (30% + 40% + 10%).
S1’s total costs to be allocated include both the $1,000,000 incurred directly by S1 and the
$104,000 allocated from S2.
Costs allocated to:
From:
S1
S2
P1
P2
P3
Costs incurred
$1,000,000
$260,000
$0
$0
$0
S2
104,000b
(260,000)
52,000
39,000
65,000
S1
(1,104,000)
0
414,000c
552,000
138,000
Total
$0
$0
$466,000
$591,000
$203,000
b $104,000 = $260,000 × 40.0%.
c $414,000 = $1,104,000 × 37.5%.
Chapter 11 – Service Department and Joint Cost Allocation
11-8
S1
To P1: $414,000
To P2: $552,000
To P3: $138,000
S2
To S1: $104,000
To P1: $52,000
To P2: $39,000
To P3: $65,000
$104,000
P1
From S1: $414,000
From S2: $52,000
P2
From S1: $552,000
From S2: $39,000
P3
From S1: $138,000
From S2: $65,000
======================
LO 11-4 Allocate service department costs using the reciprocal method.
♦ Reciprocal method is the method to allocate service department costs that recognizes all
services provided by any service department, including services provided to other service
departments.
• The reciprocal method is identical to the actual process by which services are
exchanged among departments within organizations.
• The total costs of each service department are expressed as:
Total service
department
costs
=
Direct costs of
the service
department
+
Cost allocated
to the service
department
• There is a single equation for each of the service departments and there is a single
unknown (the total cost of the service department) for each service department in the
organization.
• The system of equations is solved simultaneously using matrix algebra. For this reason,
the reciprocal method is also called the simultaneous solution method.
• In the case with two service departments, define the unknowns S1 and S2 to be the total
service department costs for the two service departments. Then the simultaneous
equations can be set up as

Chapter 11 – Service Department and Joint Cost Allocation
11-9
S1= Direct costs of the first service department + α × S2, and
S2 = Direct costs of the second service department + β × S1, where
α = Proportion of services provided by the second service department to the first.
β = Proportion of services provided by the first service department to the second.
• The reciprocal method accounts for cost flows in both directions among service
departments that provide services to each other.
• Exhibit 11.9 shows the computation of the reciprocal method
• Both the step method and the direct method could understate the cost of running service
departments because these methods omit costs of certain services consumed by one
service department that were provided by other service departments.
• When there are only two service departments, simple algebra can be used to solve the
allocation problem.
• Exhibit 11.10 is the cost flow diagram for the reciprocal method.
• The flow of costs through the accounts is shown in Exhibit 11.11.
======================
Demonstration Problem 3
(Continued from Demonstration Problem 1)
The data were reproduced here.
Proportion of services provided to:
Costs
incurred
Service
department
S1
S2
P1
P2
P3
$1,000,000
S1
–
20%
30%
40%
10%
260,000
S2
40%
–
20%
15%
25%
Required:
Allocate the service department costs to the production departments using the reciprocal
method.

Chapter 11 – Service Department and Joint Cost Allocation
11–10
Solution:
Define S1 and S2 to be the total service department costs for departments S1 and S2,
respectively.
The service department S1 incurred $1,000,000 for providing services to other departments.
The service department S2 provided 40 percent of its services to S1. Together, the total
service department costs for S1 can be expressed as:
S1 = $1,000,000 + .4 × S2.
The service department S2 incurred $260,000 for providing services to other departments.
The service department S1 provided 20 percent of its services to S2. Together, the total
service department costs for S2 can be expressed as:
S2 = $260,000 + .2 × S1.
Next, insert S1 information into S2. That is,
S2 = $260,000 + .2 × [$1,000,000 + .4 × S2].
Then,
S2 = $260,000 + $200,000 + .08 × S2.
.92 × S2 = $460,000.
S2 = $500,000.
S1 = $1,200,000.
The original service proportions will apply.
Proportion of services to be allocated:
Service
department
S1
S2
P1
P2
P3
S1
–
20%
30%
40%
10%
S2
40%
–
20%
15%
25%
Costs allocated to:
From:
S1
S2
P1
P2
P3
Costs incurred
$1,000,000
$260,000
$0
$0
$0
S1
(1,200,000)
240,000a
360,000
480,000
120,000
S2
200,000b
(500,000)
100,000
75,000
125,000
Total
$0
$0
$460,000
$555,000
$245,000