
Chapter 10 – Fundamentals of Cost Management
10–11
• Since the traditional income statement only shows resources supplied, a more
informative report for managing capacity costs will include the following in an activity-
based income statement (see Exhibit 10.11):
Resources
used
Unused
Resource
capacity
Resources
supplied
Sales revenue
(Traditional
income
statement
presents only
this column
without
activity and
cost hierarchy
information.)
$xx
Costs
Unit-related costs
(List items)
Batch-related costs
(List items)
Product and customer sustaining costs
(List items)
Capacity sustaining costs
(List items)
Total operating costs
xx
Operating profits
$xx
• The activity-based income statement categorizes costs into the cost hierarchies.
Managers can look at the amount of costs in each cost hierarchy and find ways to manage
those resources effectively.
• The activity-based income statement shows managers how much of the resources for
each type of cost are unused. Managers can investigate to determine how much of the
unused capacity can be saved by changing the production process.
• Some unused resource capacity is a good thing because it can be used for ad hoc
training, leisure, and thinking about ways to improve the work and work environment.
• Some costs have more unused resources than others. Unit-related costs often show little
or no unused resources. Capacity-related costs usually have unused resources unless the
company is operating at full capacity.
LO 10-6 Design cost management systems to assign capacity costs.
♦ The importance of managing capacity costs increases with the relative proportion of these costs
in an organization’s cost structure.
♦ Allocation of fixed operating costs (supervision, depreciation, maintenance, and so on) to
products depends on how the allocation base (the denominator number in terms of “capacity”) is
defined.

Chapter 10 – Fundamentals of Cost Management
10–12
• There are four different definitions of capacity as the allocation base:
(1) Theoretical capacity: The amount of production possible under ideal conditions with
no time for maintenance, breakdowns, or absenteeism.
(2) Practical capacity: The amount of production possible assuming only the expected
downtime for scheduled maintenance and normal breaks and vacations.
(3) Normal activity: The long-run expected volume produced.
(4) Actual activity: The actual volume produced for the period.
Example 3: Rent A Car (RAC), Inc. operates a fleet of rental cars that, if booked all
year round non-stop, can provide a theoretical capacity of 150,000 miles per year. With
scheduled maintenance and expected breakdowns, the volume drops to 120,000 miles,
the practical capacity. RAC acquires and replaces vehicles based on marketing data and
a long-run expected volume of about 100,000 miles, which is the normal activity.
Over the last three years, the actual volumes were 100,000 miles, 85,000 miles, and
105,000 miles, for year 1, year 2, year 3, respectively. Given an annual fixed operating
cost of $150,000, the following table shows capacity and cost driver rate for different
definitions of capacity.
Definition
Capacity
(miles)
Fixed operating
cost rate per mile
Theoretical capacity
150,000
$1.00
Practical capacity
120,000
1.25
Normal activity
100,000
1.50
Actual activity – Year 1
96,000
1.56
Actual activity – Year 2
90,000
1.67
Actual activity – Year 3
85,000
1.76
If RAC uses the normal volume to calculate the fixed operating cost rate, the costing
system will charge operations $1.50 per mile. In Year 2, for example, the system would
charge $135,000 (= $1.50 per mile × 90,000 miles). The unused capacity of $15,000 (=
$150,000 actual fixed costs – $135,000 fixed costs applied) was a period charge that
can serve as a warning sign for managers as the declining trend continues.
If RAC uses the actual volumes instead, the reported product costs will fluctuate as the
volume shifts from year to year. Also, the cost of unused capacity, $15,000 in the case
of Year 2, will be hidden from the managers as it is included in each mile of service.

Chapter 10 – Fundamentals of Cost Management
10–13
• Using actual activity leads to information that can distort pricing decisions.
• Since theoretical capacity is difficult to achieve, managers using it as a basis for pricing
are in danger of not recovering the costs.
• A business usually acquires more capacity than it expects to use possibly because
(1) the expansion in the future would have been taken care of, and
(2) the (seasonal) demand tends to fluctuate.
• For case (1) above, since the business purchases the capacity for its own use (not for
customers), the better cost system would use practical capacity (or some measure of long-
term volume) to prevent overstating the cost of serving customers.
• When case (2) prevails, the excess capacity is to benefit the customers in peak demand.
Therefore, the better allocation base is normal (or actual) volume in which the customers
pay for the unused capacity.
• A variation of case (2) occurs when there are seasonal differences in demand. For RAC,
that means summer months (or weekends) will see peak demand and the capacity is
reserved to serve the summer (or weekend) market. In this case, the best solution is to
assign the cost of unused capacity to summer (or weekend) customers who will benefit
the most from the excess capacity.
• Pricing depends not only on costs but also on market conditions, including what
competitors are likely to do. The alternative use for the unused capacity may also play a
role.
LO 10-7 Describe how activities that influence quality affect costs and
profitability.
♦ Total quality management (TQM) systems are developed to support quality initiatives. Unless
the cost accounting systems are also designed to support these initiatives, companies are likely to
find that TQM has little economic benefit.
• A separation of cost and quality systems risks sending managers wrong signals about
the value of quality programs.
• For the implementation of TQM to be effective, fives changes must be made to the
traditional managerial accounting systems.
Chapter 10 – Fundamentals of Cost Management
10–14
(1) The information should include problem-solving data that come from both financial
and nonfinancial reports.
(2) The workers (line employees) themselves should collect the information and use it to
get feedback and solve problems.
(3) The information should be available quickly so workers can get feedback quickly.
(4) Information should be more detailed than that found in traditional managerial
accounting systems.
(5) Rewards should be based on quality and customer satisfaction measures of
performance to obtain quality.
♦ When designing a cost management system to support quality programs, it is necessary to
know what view of quality the system is designed to support.
• The external view is represented by customer expectations of quality, the customer’s
anticipated level of product or service (including tangible and intangible features).
• Tangible features include performance, taste, and functionality. Intangible features
include how the product’s salespeople treat customers and the time required to deliver the
product to the customer after ordering it.
• The external view is everything about the product that the customer values. It is about
all aspects of a product’s purchase and use.
• Customer expectations impose costs on the firm and these costs have to be considered
in making decisions.
• When products or services are so new or so different, customers may not even know
what to expect.
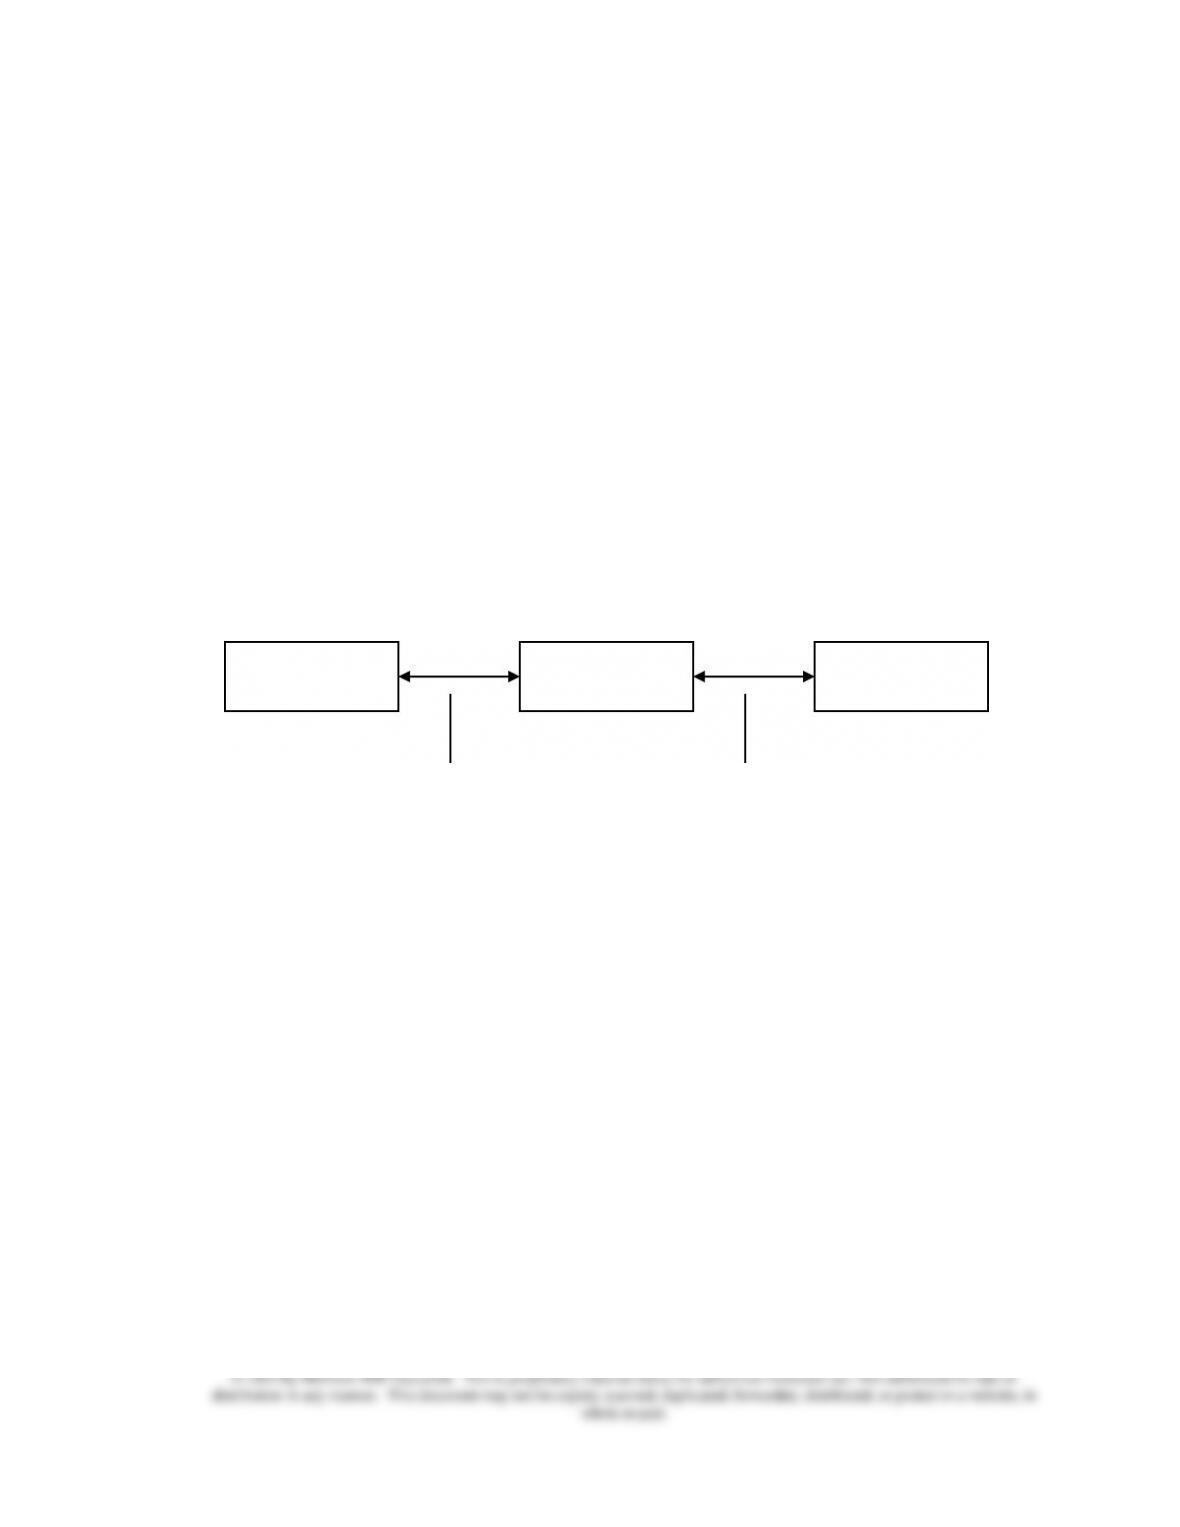
Customer
expectations
Design
specifications
Actual product
performance
External view:
Are customer
expectations met in
designing the product?
Internal view:
Does the product
delivered meet design
specifications?

Chapter 10 – Fundamentals of Cost Management
10–15
• The internal view of quality is represented by conformance to specifications, the
degree to which a product or service performs as it is designed (or specified) to do.
• Conformance to specification is not sufficient. The specifications can be such that a
product that is 100% within specifications finds no buyer at any price.
• There must be a link between the specifications for the product and the expectations
customers have for them.
LO 10-8 Compare the costs of quality control to the costs of failing to
control quality.
♦ Quality is something the customer values and the firm expends resources on to ensure.
• The cost of quality system is designed to help managers make decisions about quality. It
is based on the idea that a tension exists between incurring costs to ensure that products
meet the company’s definition of quality and the cost incurred by not meeting that
definition.
• Conformance costs: Costs of ensuring that quality conforms to the firm’s requirements.
(1) Prevention costs are incurred to prevent defects in the products or services from
being produced, including materials inspection, processing control (process
inspection), process control (equipment inspection), quality training, machine
inspection, and product design.
(2) Appraisal costs (also called detection costs) are incurred to detect individual units of
products that do not conform to specifications, including end-of–process sampling and
field testing.
• Nonconformance costs: Costs of failing to control quality.
(1) Internal failure costs are incurred when nonconforming products and services are
detected before being delivered to customers, including scrap, rework, and
reinspection / retesting.
(2) External failure costs are incurred when nonconforming products and services are
detected after being delivered to customers, including warranty repairs, product
liability, marketing costs, and lost sales.
• Exhibit 10.16 summarizes the four main classifications of quality costs.
Chapter 10 – Fundamentals of Cost Management
10–16
• The ultimate goal in implementing a quality improvement program is to achieve zero
defects while incurring minimal costs of quality.
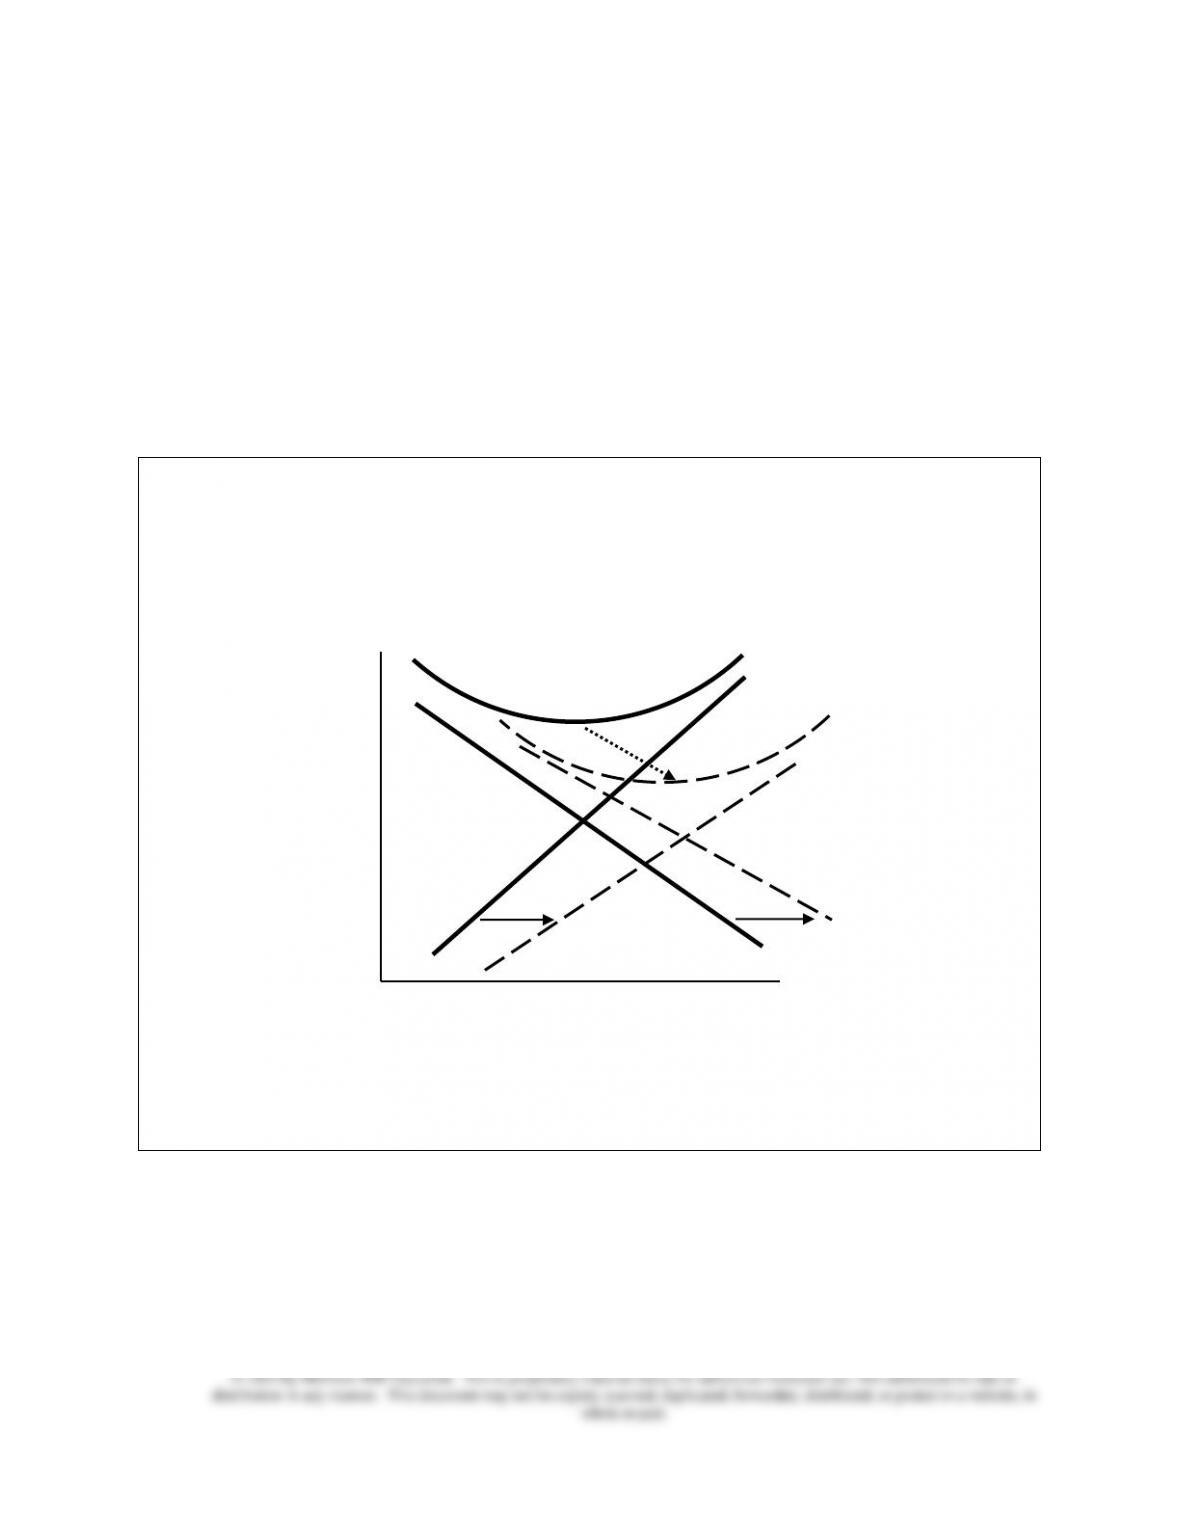
• Managers must make trade-offs between the four cost categories (see Exhibit 10.17),
and total costs of quality must be reduced over time.
• As competition heats up and the costs of technology decrease, both the conformance
and nonconformance curves shift to the right. Over time, the optimal level of quality
increases.
Example 4: The interaction between conformance and nonconformance costs of quality
causes both costs to shift to the right that may result in improved quality level and
lower total quality costs.
Because of the shift, the optimal quality-cost combination moves from point A to point
B, allowing for better quality while reducing the total costs of quality.
• Costs of quality are often expressed as a percentage of sales. Exhibit 10.18 shows a
sample cost of quality report and how such information can be used to reduce the overall
cost of quality.
• The cost of quality report can be a valuable decision-making aid for managers, but it is
only effective if all quality costs are measured and reported.
Conformance costs
Nonconformance costs
Total costs of quality
Quality
Costs
A
B