Unlock document.
This document is partially blurred.
Unlock all pages and 1 million more documents.
Get Access
Problem 3-26 (60 minutes)
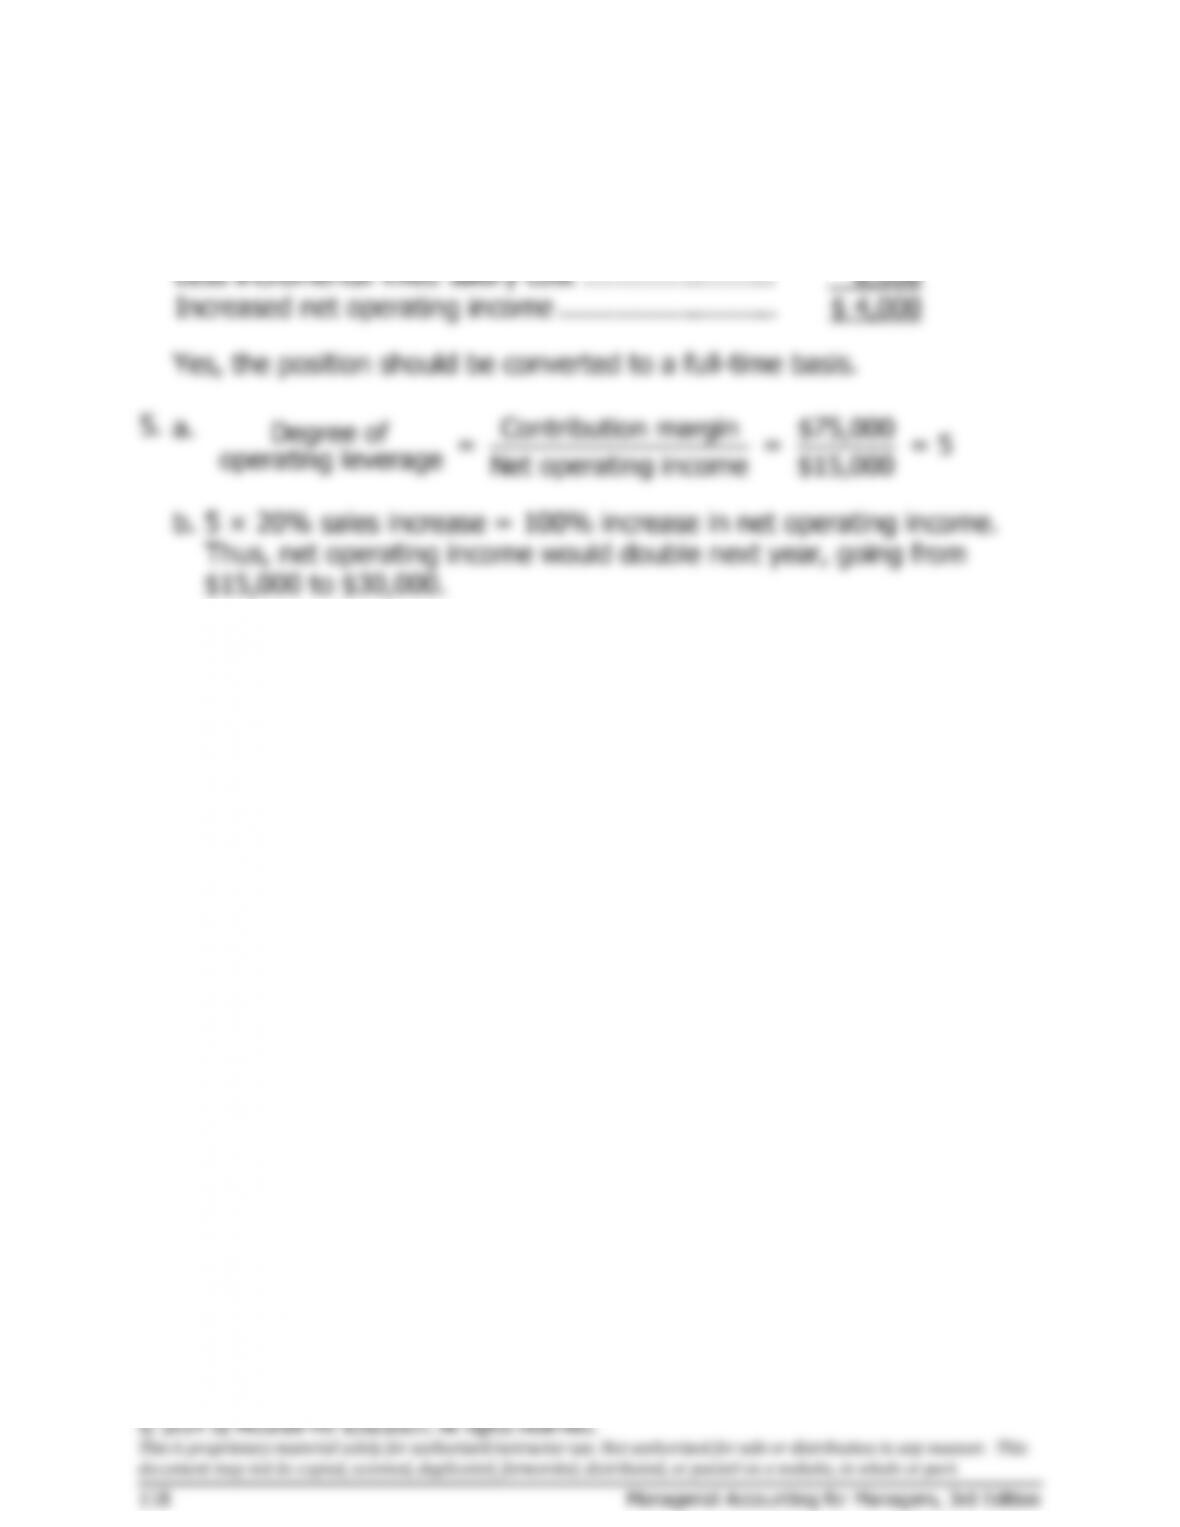
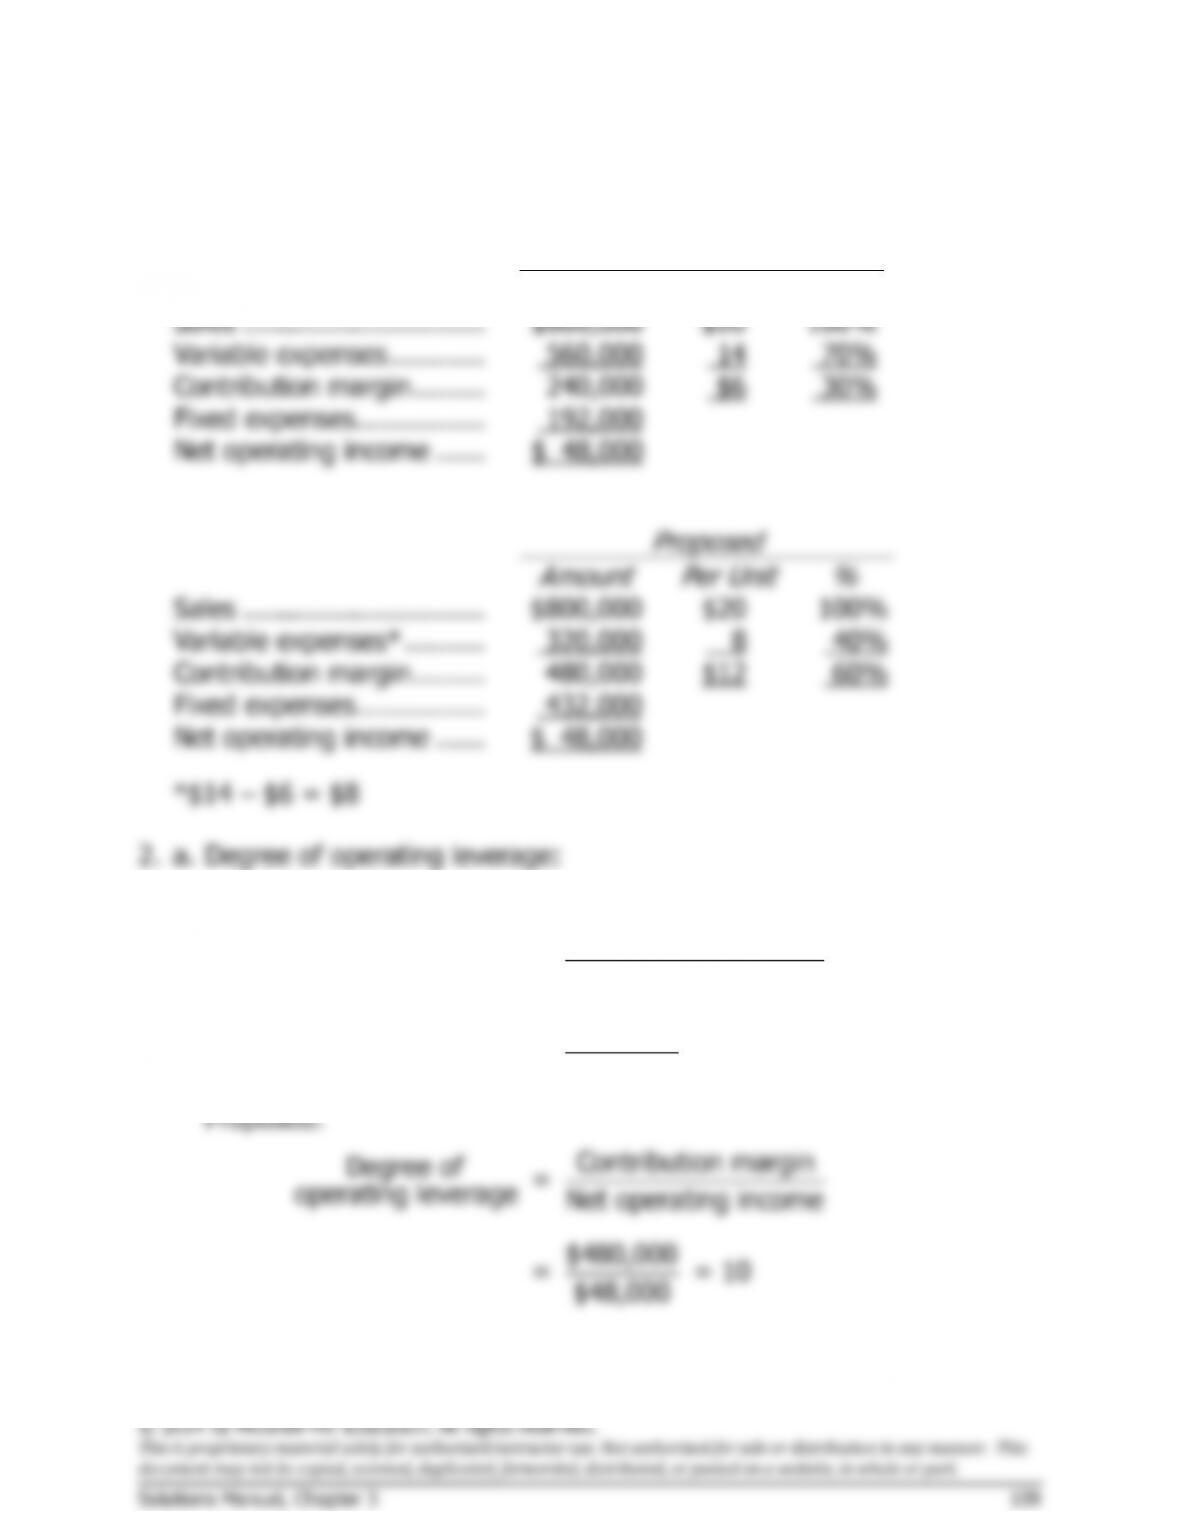
1. The income statements would be:
Present
Amount
Per Unit
%
Sales ..............................
$800,000
$20
100%
Variable expenses ............
560,000
14
70%
Contribution margin .........
240,000
$6
30%
Fixed expenses ................
192,000
Net operating income ......
$ 48,000
Proposed
Amount
Per Unit
%
Sales ..............................
$800,000
$20
100%
Variable expenses* ..........
320,000
8
40%
Contribution margin .........
480,000
$12
60%
Fixed expenses ................
432,000
Net operating income ......
$ 48,000
*$14 – $6 = $8
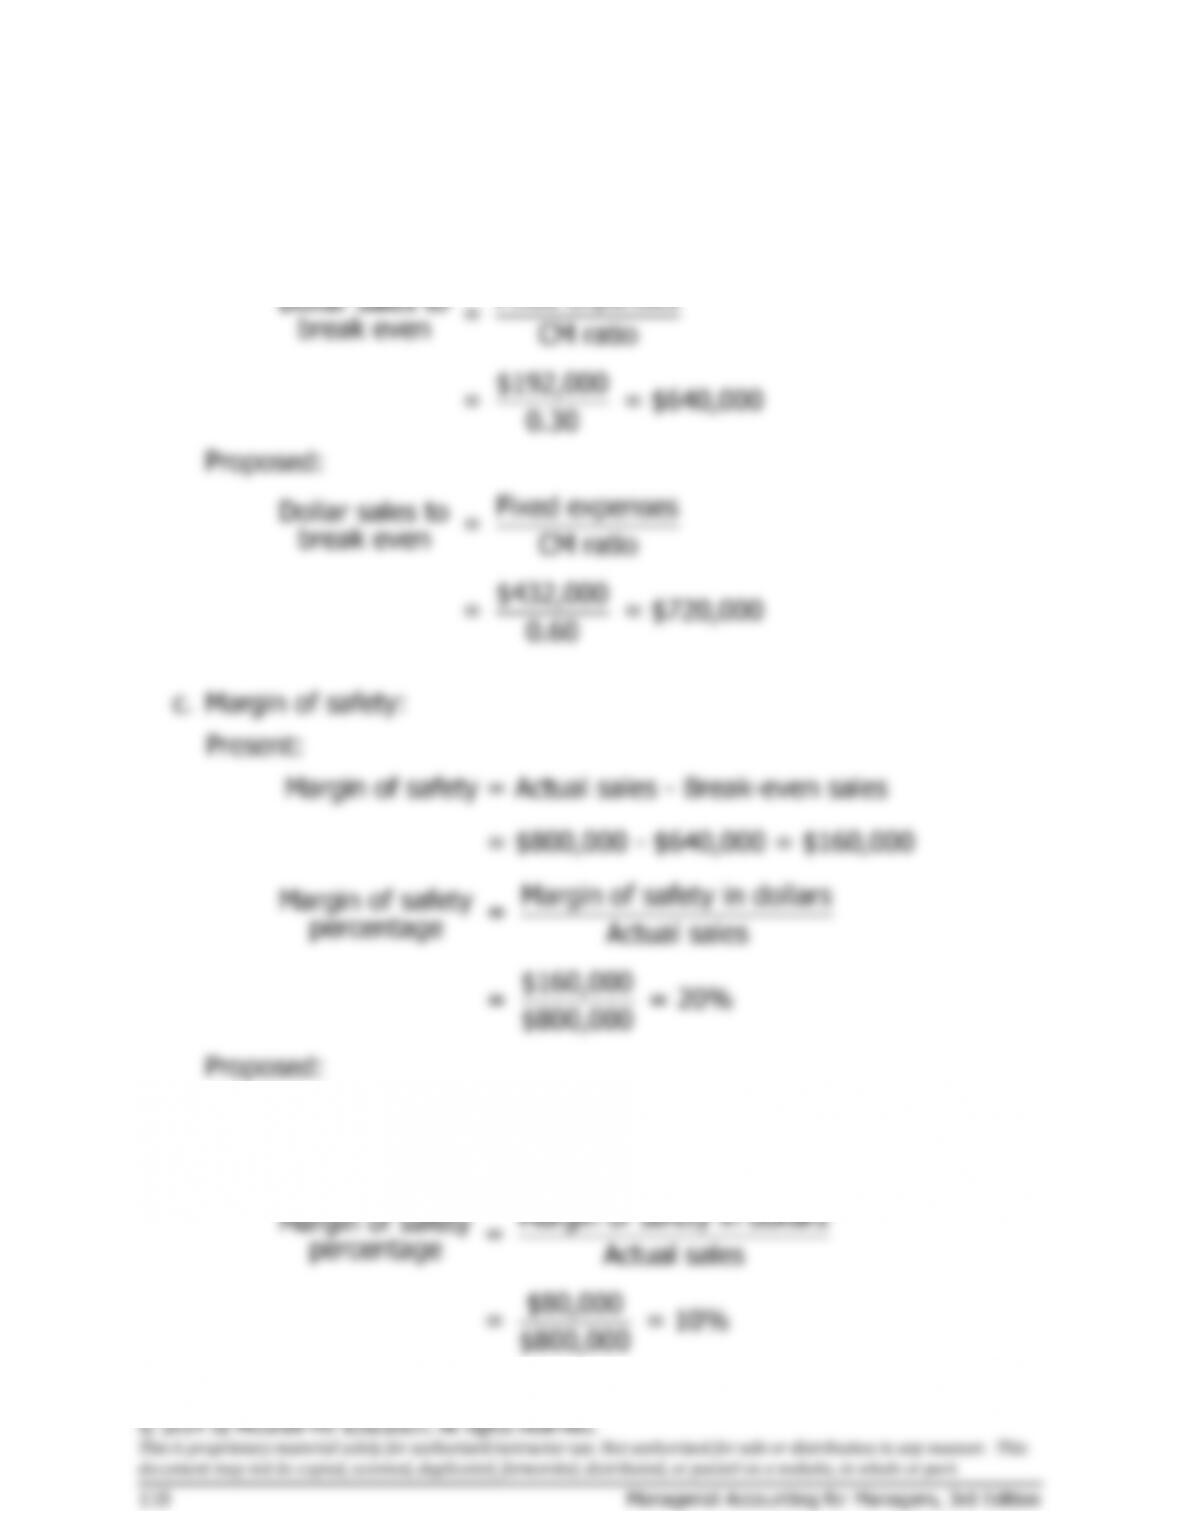
2. a. Degree of operating leverage:
Present:
Contribution margin
Degree of
=
operating leverage Net operating income
$240,000
= = 5
$48,000
Problem 3-26 (continued)
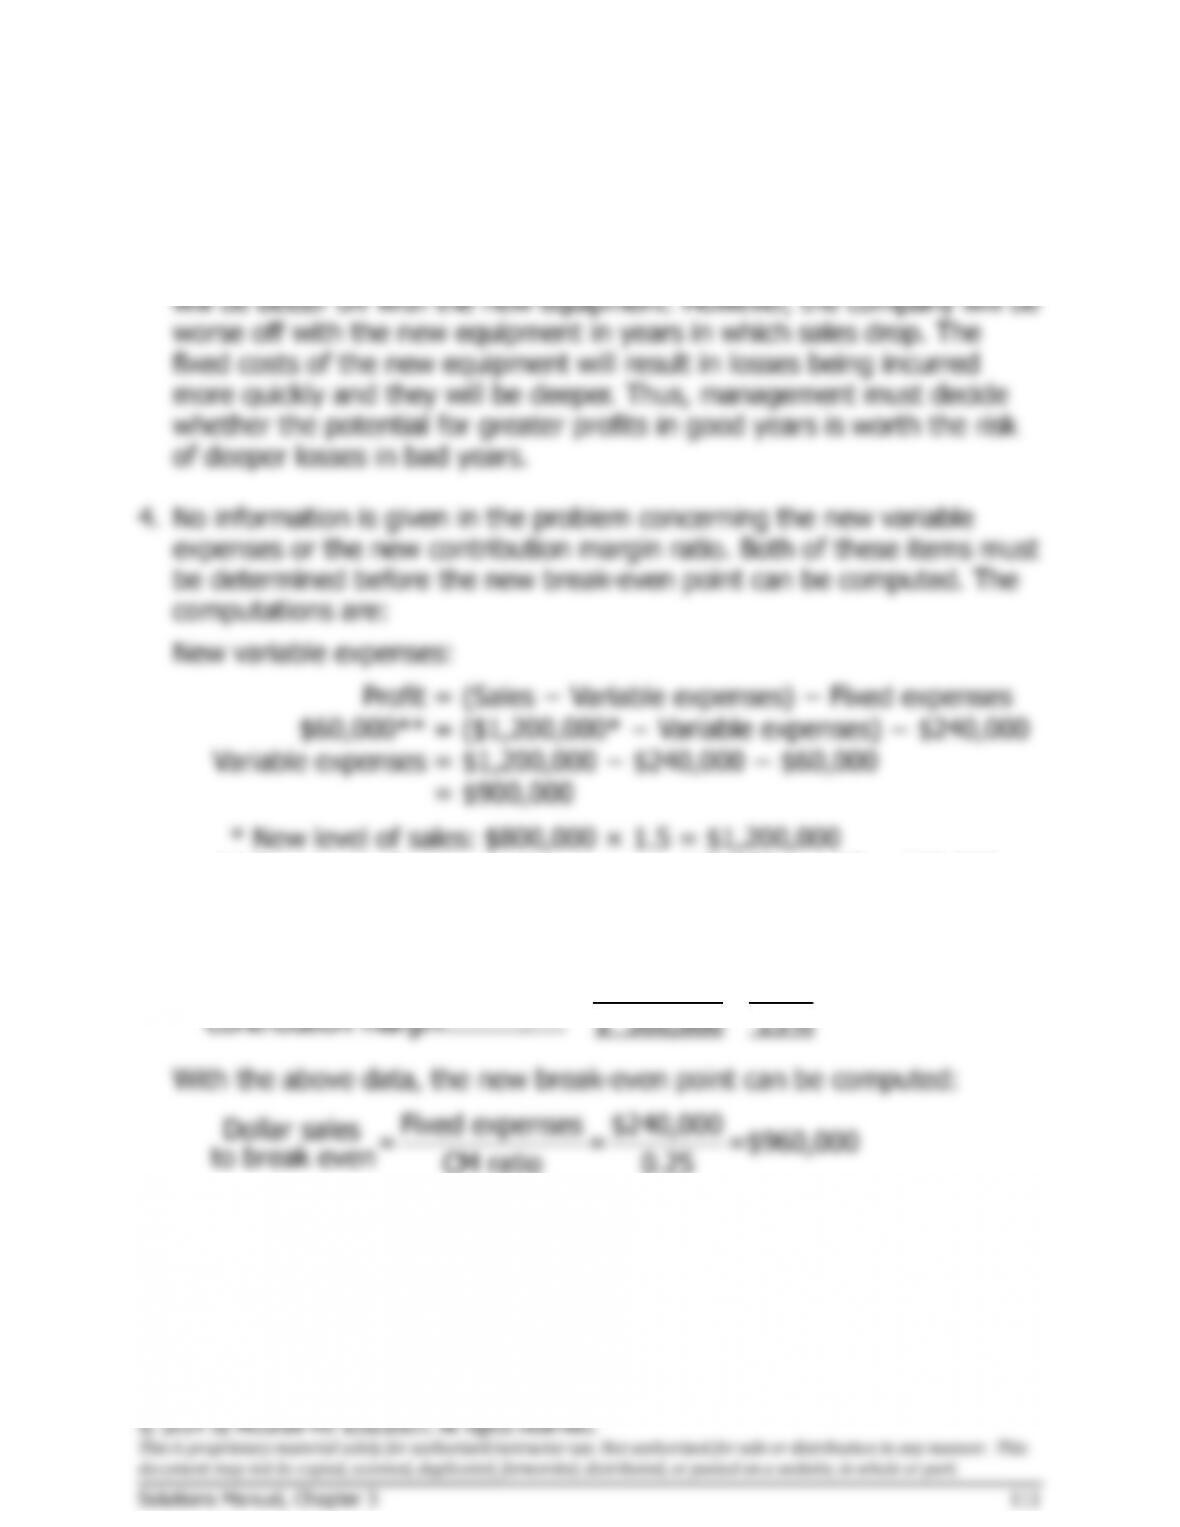
3. The major factor would be the sensitivity of the company’s operations to
cyclical movements in the economy. Because the new equipment will
increase the CM ratio, in years of strong economic activity, the company
Problem 3-27 (30 minutes)
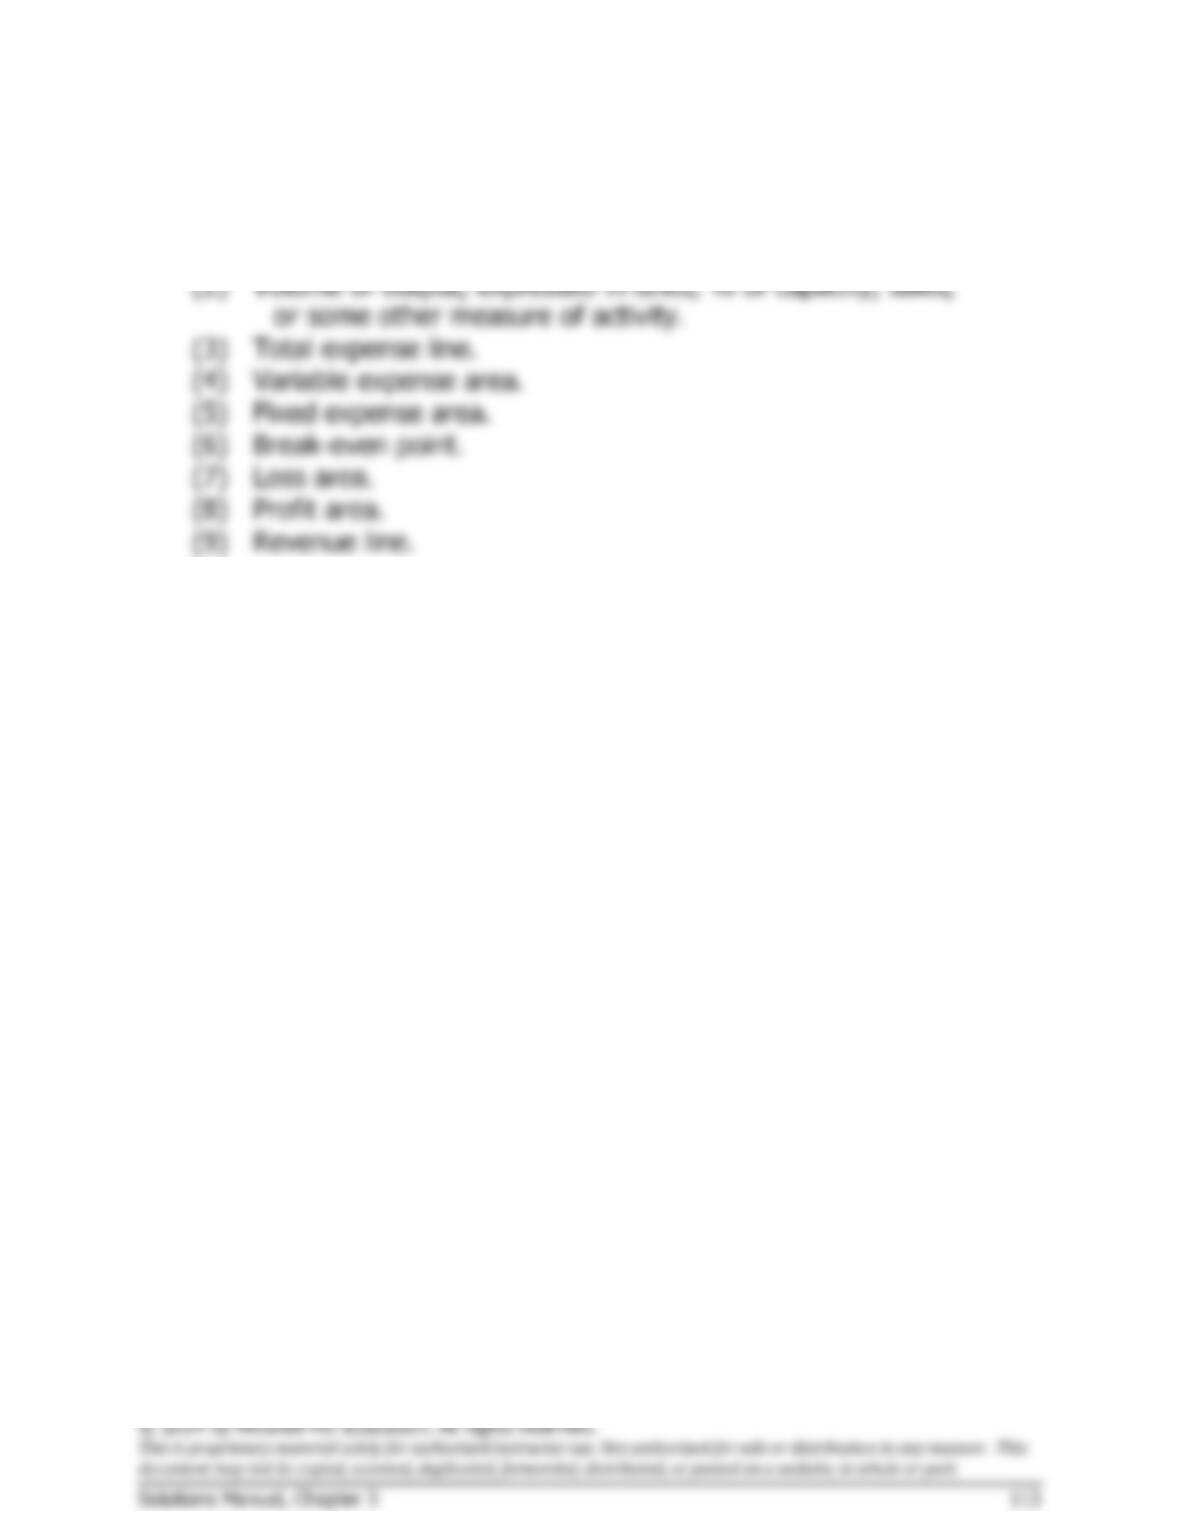
1. The numbered components are as follows:
(1)
Dollars of revenue and costs.
(2)
Volume of output, expressed in units, % of capacity, sales,
or some other measure of activity.
(3)
Total expense line.
(4)
Variable expense area.
(5)
Fixed expense area.
(6)
Break-even point.
(7)
Loss area.
(8)
Profit area.
(9)
Revenue line.
Problem 3-28 (60 minutes)
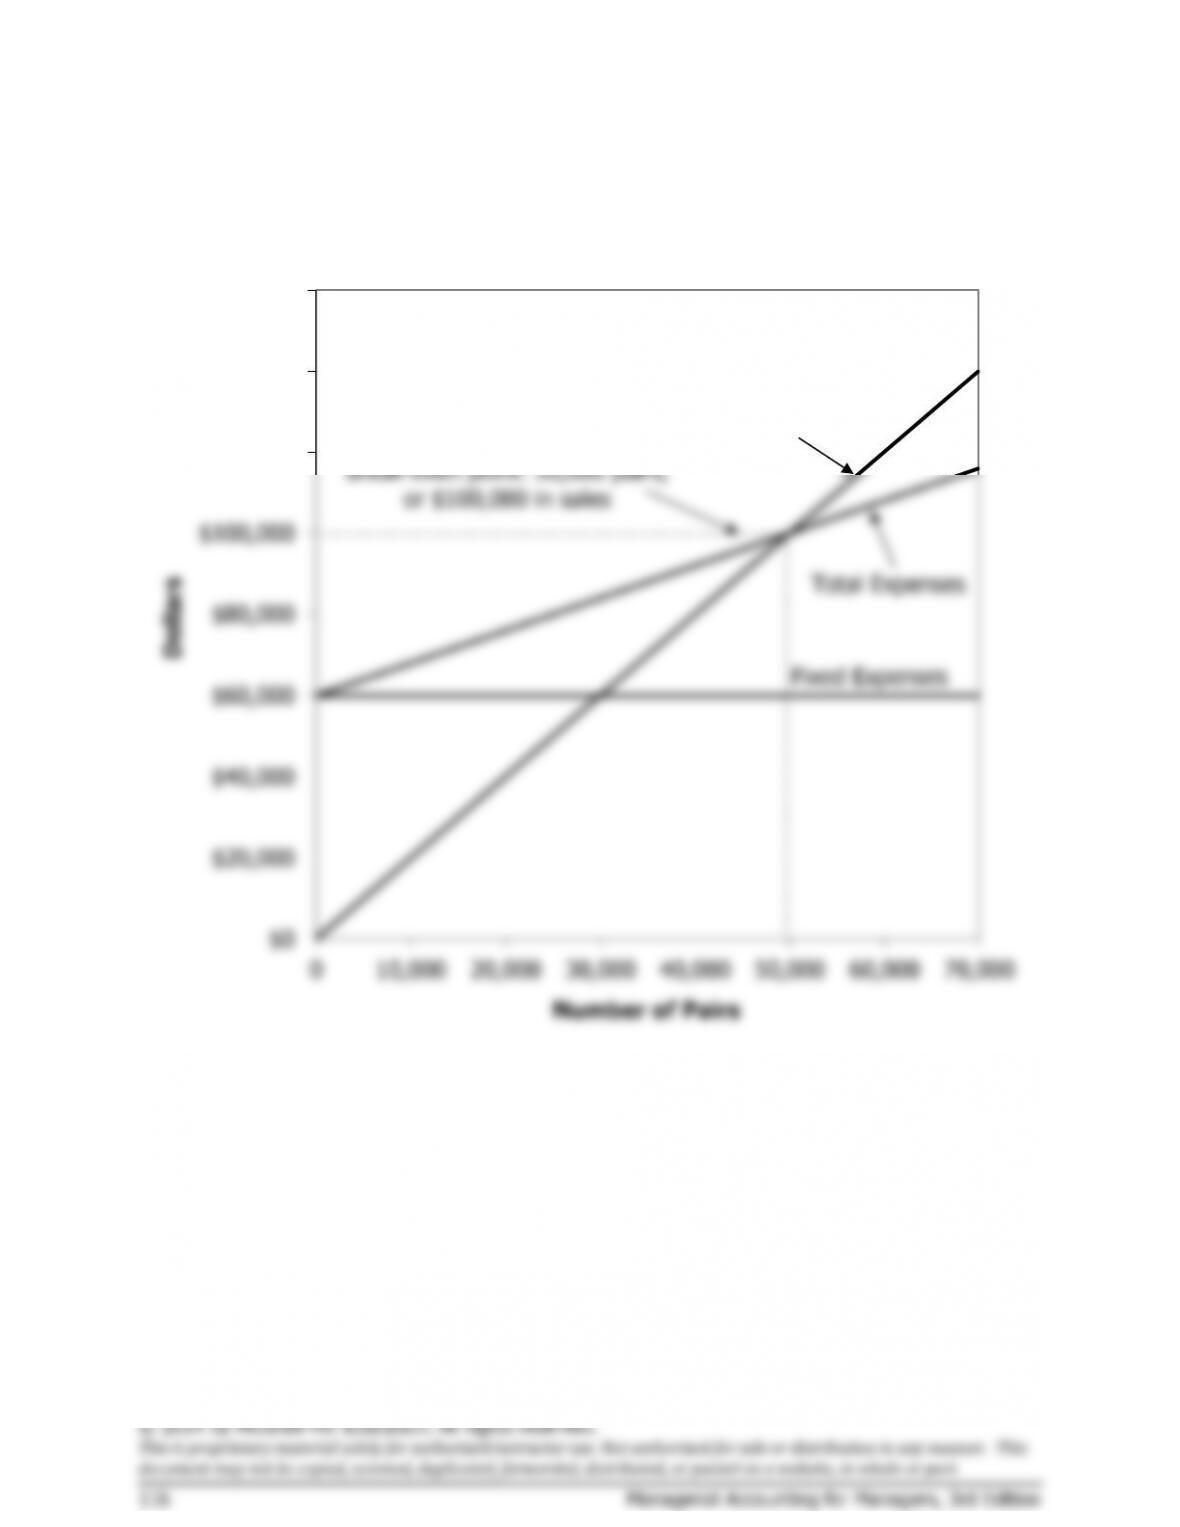
1.
Profit
= Unit CM × Q − Fixed expenses
$0
= ($2.00 − $0.80) × Q − $60,000
$0
= ($1.20) × Q − $60,000
$1.20Q
= $60,000
Q
= $60,000 ÷ $1.20 per pair
Q
= 50,000 pairs
50,000 pairs × $2 per pair = $100,000 in sales.
Alternative solution:
Fixed expenses $60,000
Unit sales = = =50,000 pairs
to break even CM per unit $1.20 per pair
Fixed expenses $60,000
Dollar sales = = =$100,000 in sales
to break even CM ratio 0.60
2. See the graph on the following page.
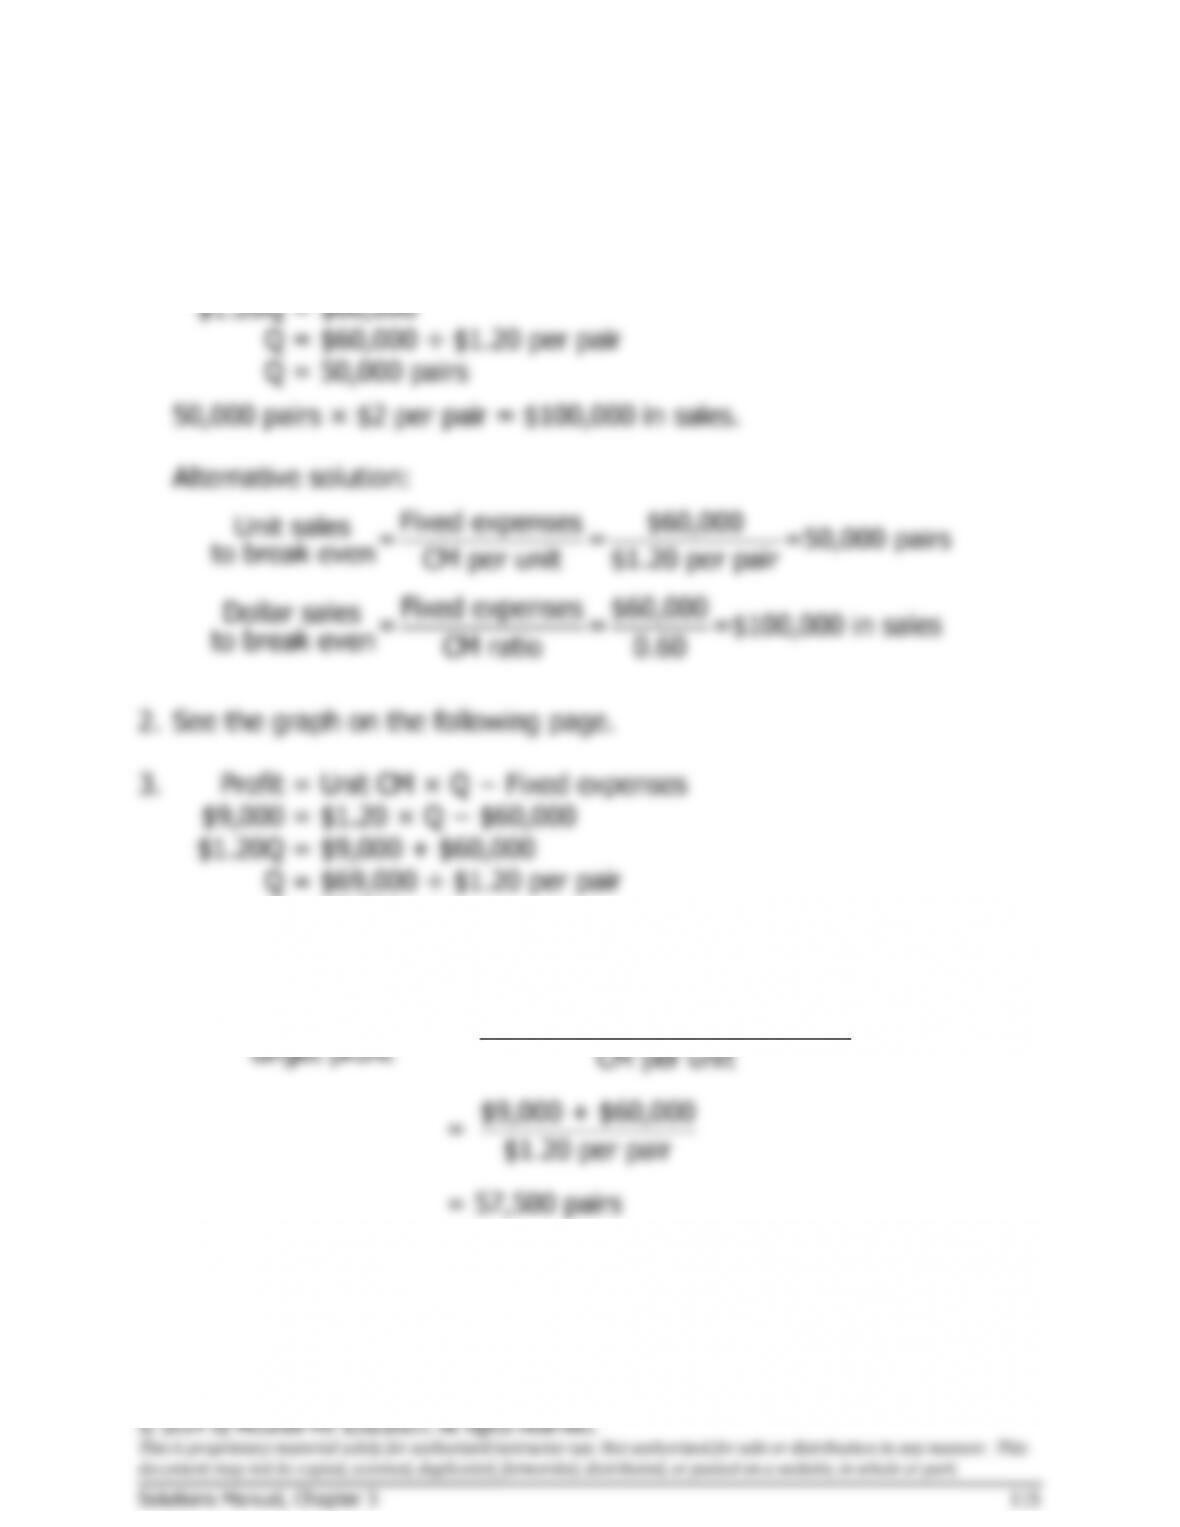
3.
Profit
= Unit CM × Q − Fixed expenses
$9,000
= $1.20 × Q − $60,000
$1.20Q
= $9,000 + $60,000
Q
= $69,000 ÷ $1.20 per pair
Q
= 57,500 pairs
Alternative solution:
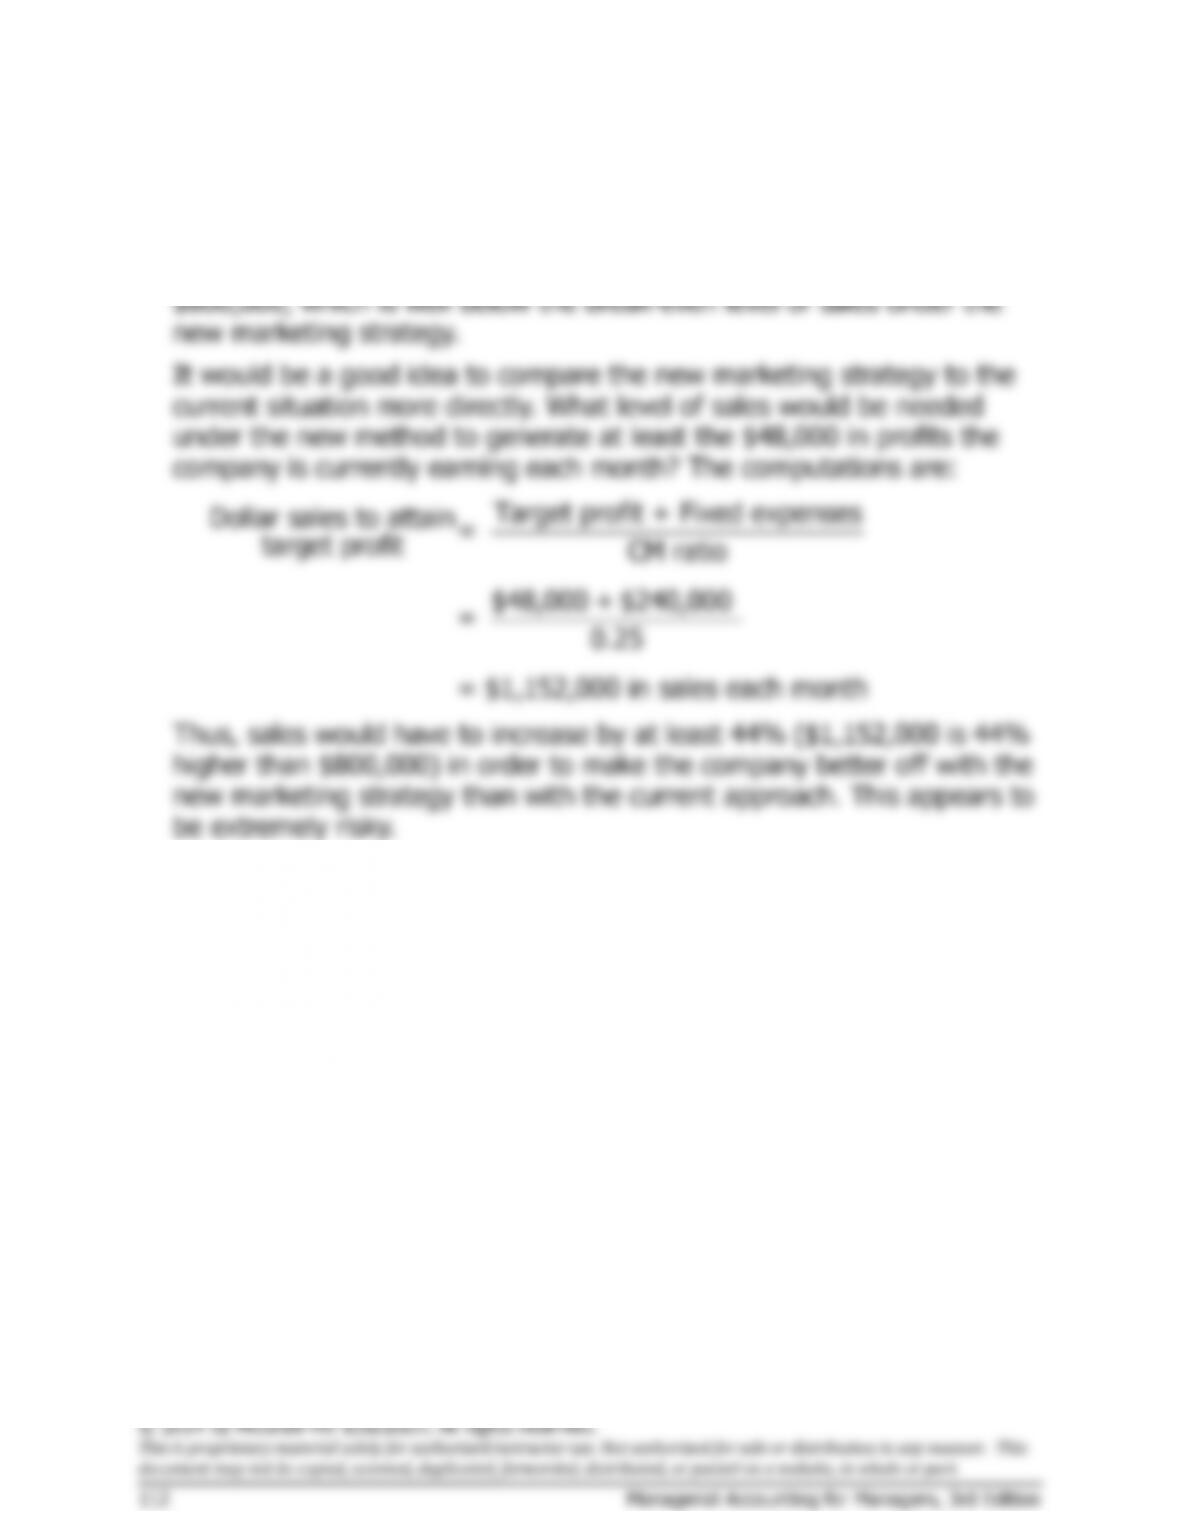
Target profit + Fixed expenses
Unit sales to attain =
target profit CM per unit
$9,000 + $60,000
= 57,500 pairs
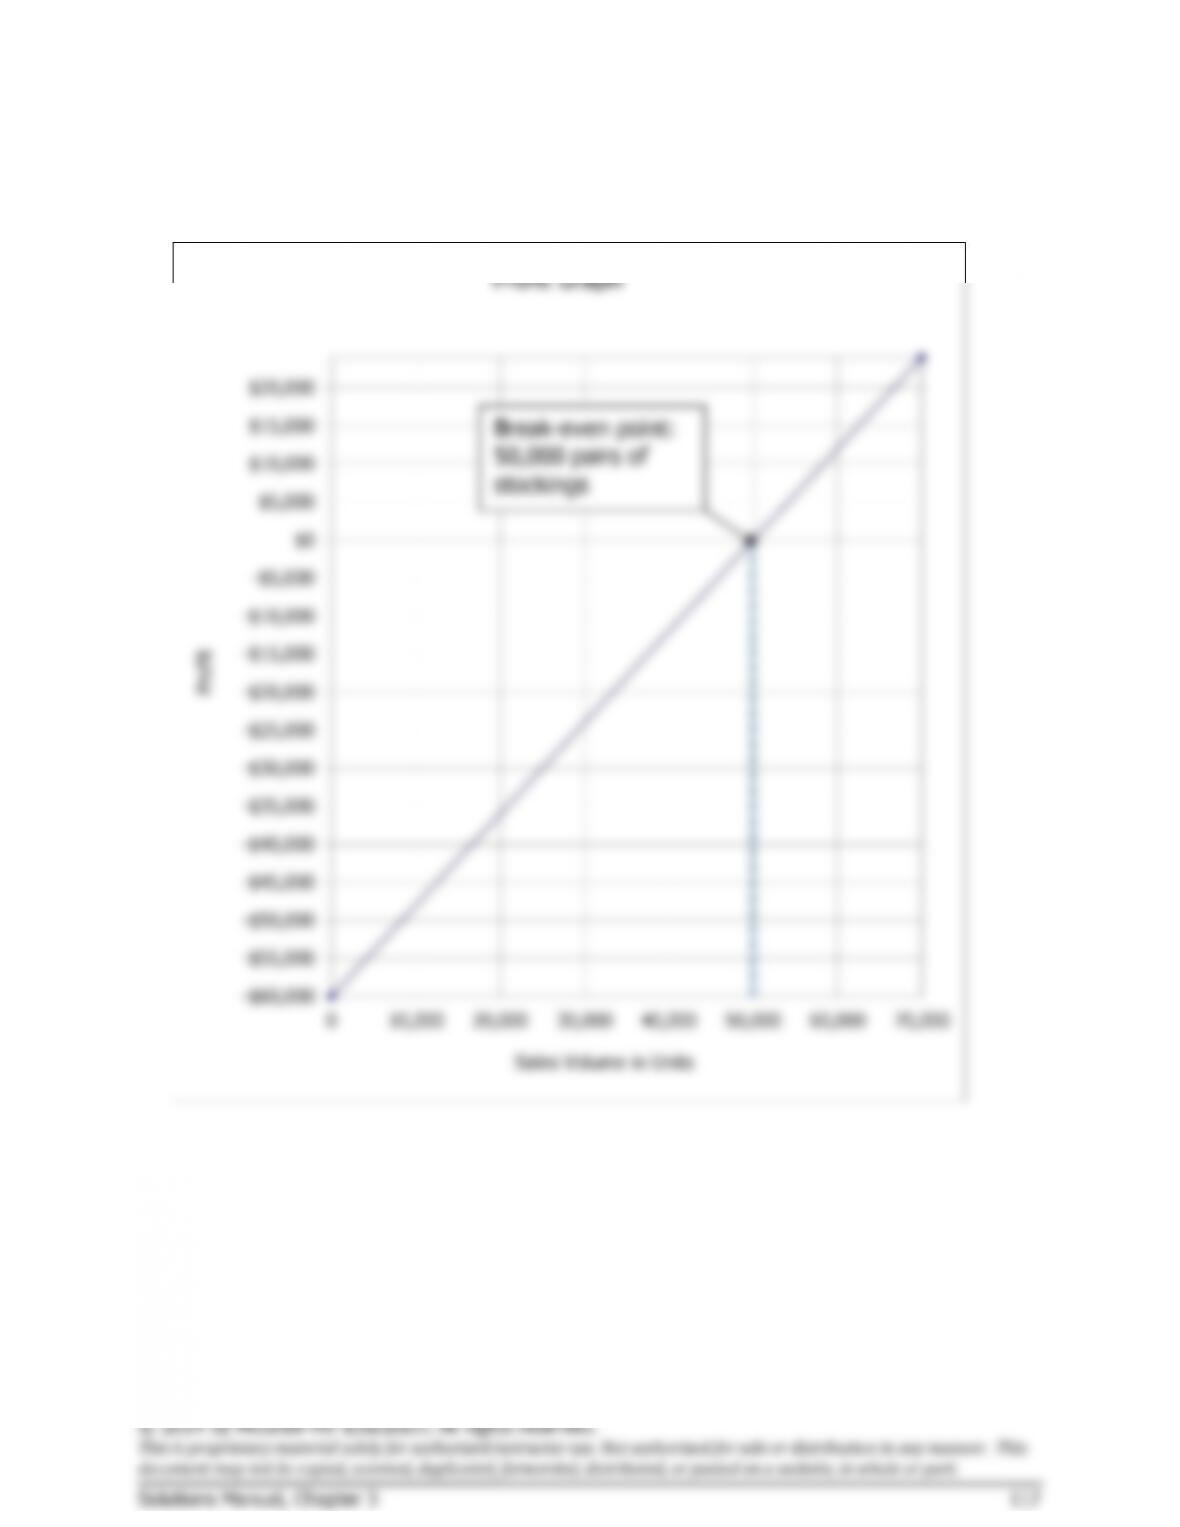
Problem 3-28 (continued)
Profit graph:
-$60,000
-$55,000
-$50,000
-$45,000
-$40,000
-$35,000
-$30,000
-$25,000
-$20,000
-$15,000
-$10,000
-$5,000
$0
$5,000
$10,000
$15,000
$20,000
0 10,000 20,000 30,000 40,000 50,000 60,000 70,000
Profit
Sales Volume in Units
Profit Graph
Break-even point:
50,000 pairs of
stockings