Unlock document.
This document is partially blurred.
Unlock all pages and 1 million more documents.
Get Access
Appendix B
Profitability Analysis
Solutions to Questions
B-1 Absolute profitability measures the
B-2 Relative profitability involves ranking
trade-offs are necessary when a constraint
exists. Otherwise, they are not necessary.
prevents a business from attaining more profits
is its constraint. The constraint might be a
production constraint, it might be managerial
least one constraint. The same is true for almost
all nonprofit organizations, which generally seek
B-4 The absolute profitability of a segment
is measured by the difference between the
B-5 The relative profitability of a segment is
constrained resource required by the segment.
Consequently, to measure relative profitability,
B-6 A volume trade-off decision involves
trading off units of one product for another. In
constrained resource required by one unit of the
product.
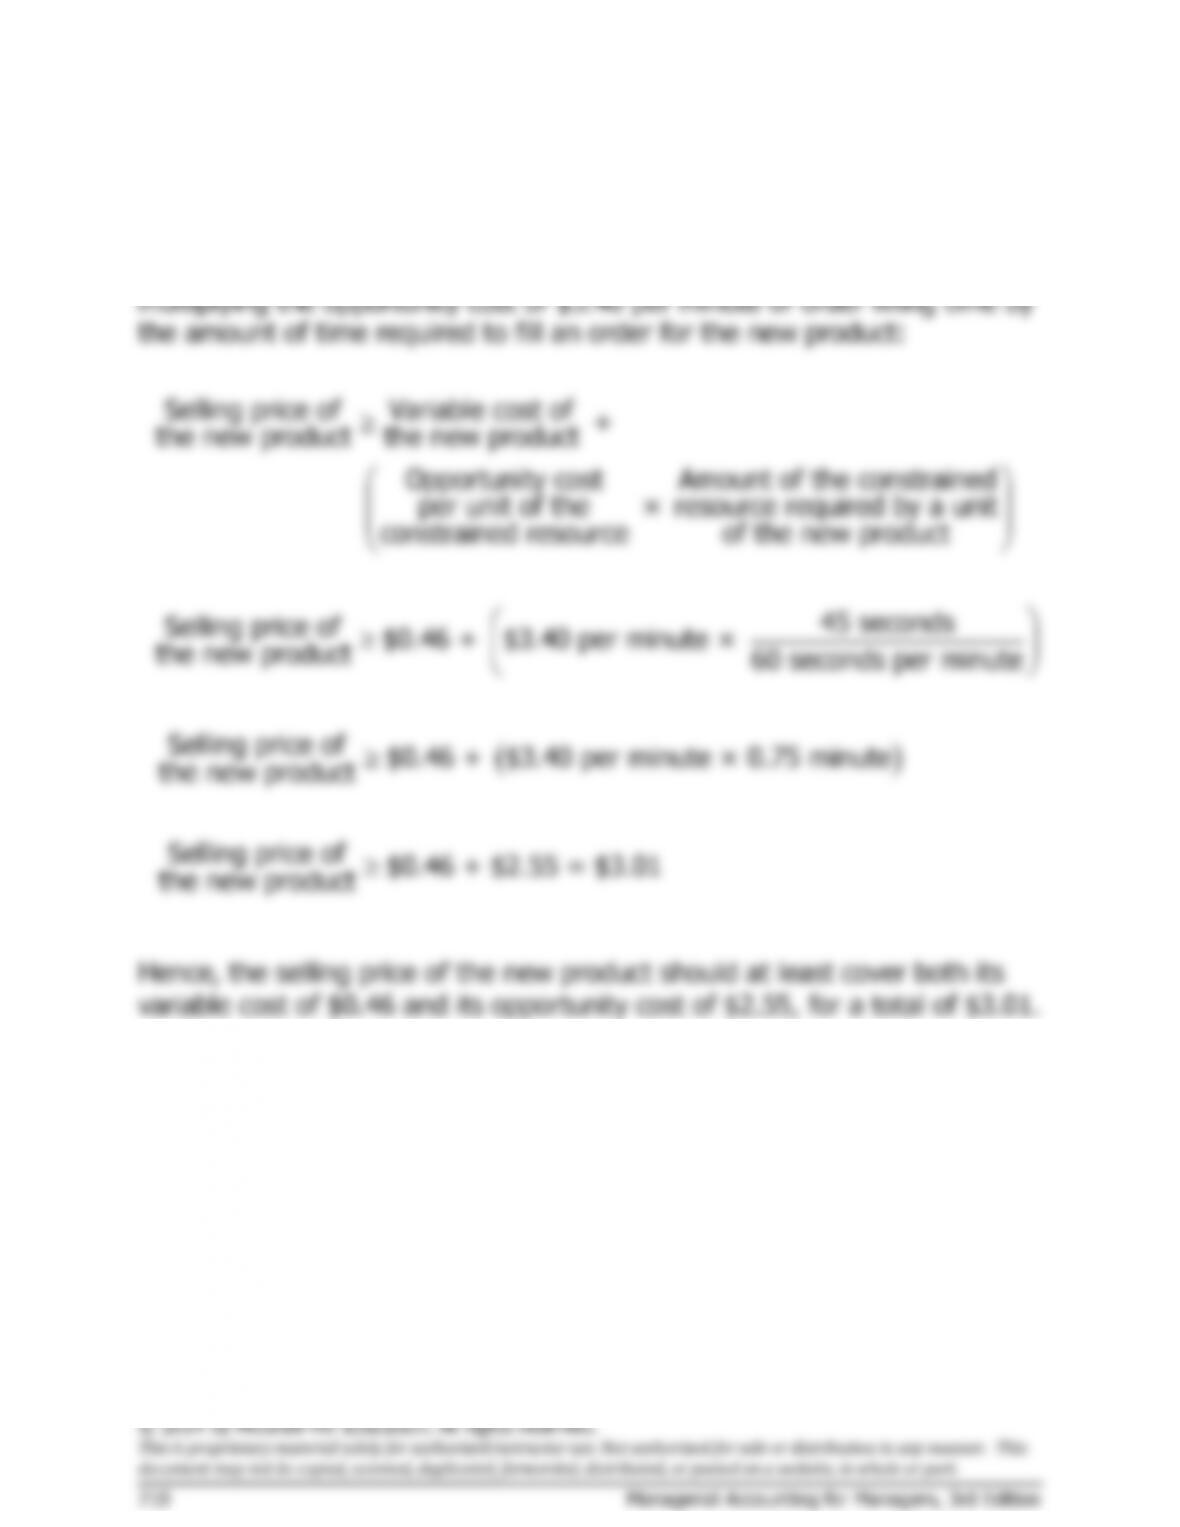
determined by multiplying the opportunity cost
per unit of the constrained resource by the
costs of the product. Exactly how much of the
avoidable fixed costs should be covered by each
unit is difficult to determine
a priori
because the
.
Exercise B-1 (30 minutes)
1. This exercise can be solved by first computing the profitability index of
each new ride and then ranking the rides based on that profitability
index:
Net Present
Value
(A)
Safety
Engineer
Time
Required
(B)
Profitability
Index
(A) ÷ (B)
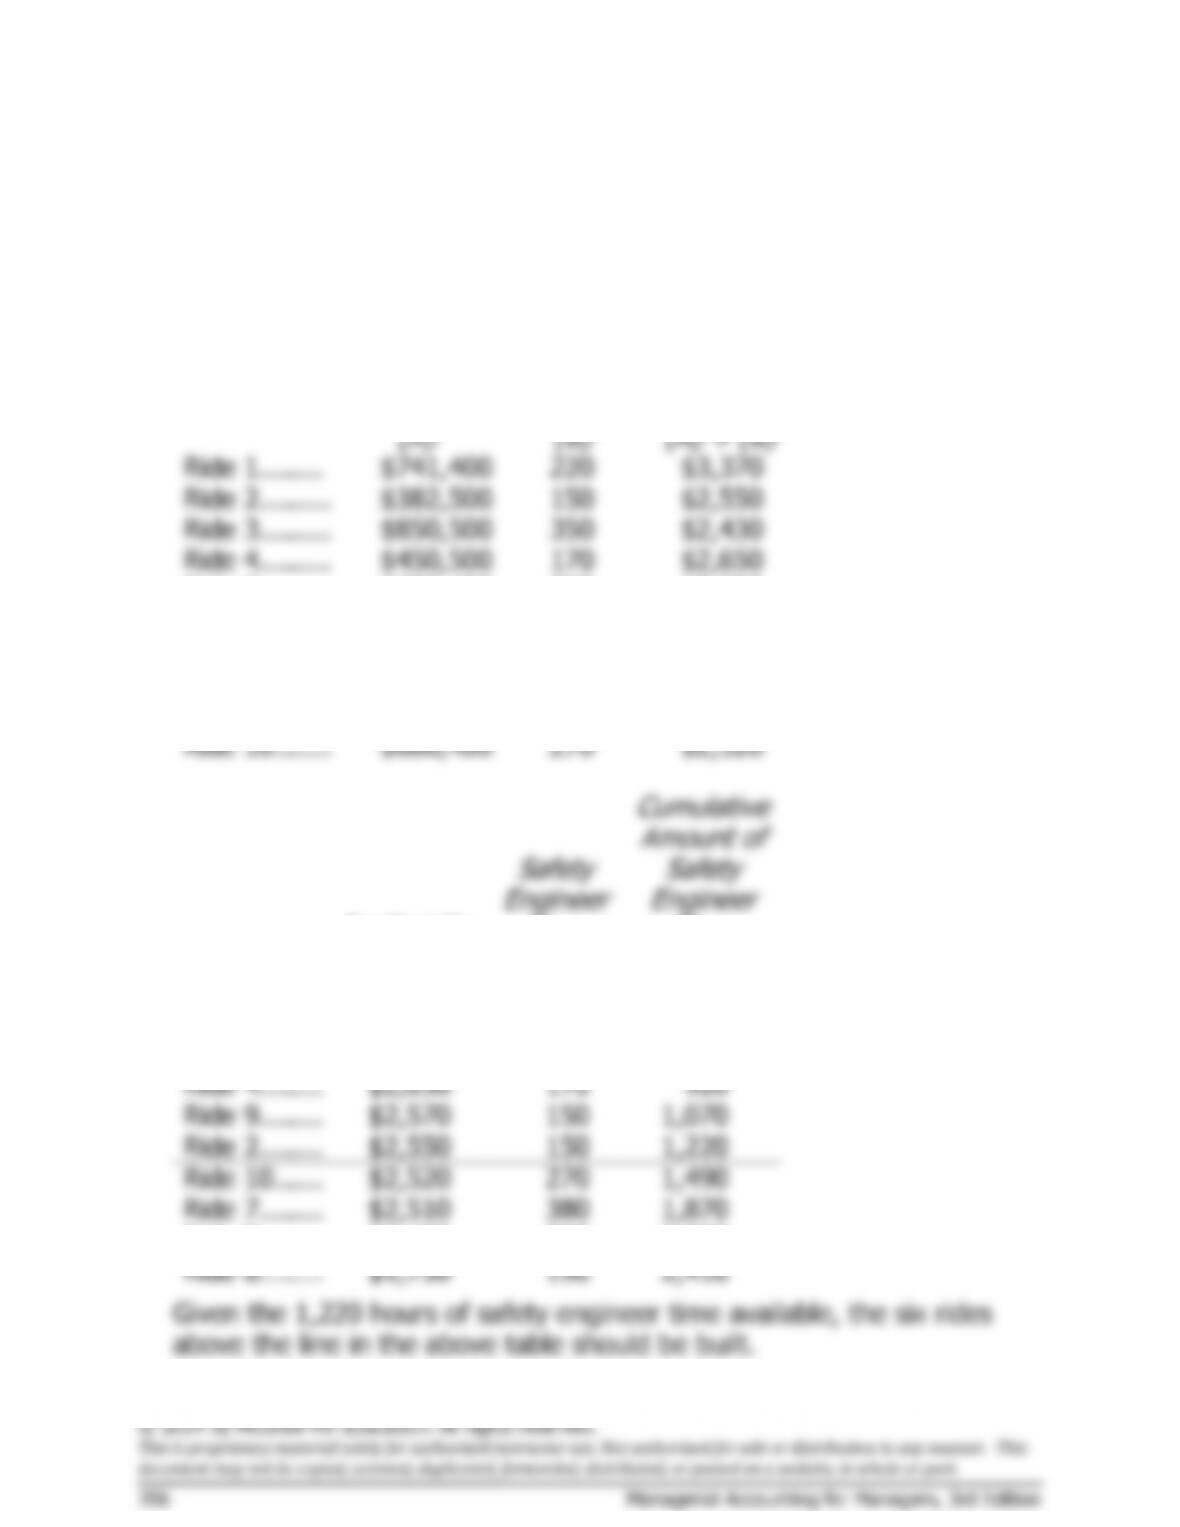
Ride 1........
$741,400
220
$3,370
Ride 2..............................
$382,500
150
$2,550
Ride 3..............................
$850,500
350
$2,430
Ride 4..............................
$450,500
170
$2,650
Ride 5..............................
$620,400
220
$2,820
Ride 6..............................
$1,004,400
310
$3,240
Ride 7..............................
$953,800
380
$2,510
Ride 8..............................
$332,500
190
$1,750
Ride 9..............................
$385,500
150
$2,570
Ride 10 ............................
$680,400
270
$2,520
Profitability
Index
Safety
Engineer
Time
Required
Cumulative
Amount of
Safety
Engineer
Time
Required
Ride 1........
$3,370
220
220
Ride 6........
$3,240
310
530
Ride 5........
$2,820
220
750
Ride 4........
$2,650
170
920
Ride 9........
$2,570
150
1,070
Ride 2........
$2,550
150
1,220
Ride 10 ......
$2,520
270
1,490
Ride 7........
$2,510
380
1,870
Ride 3........
$2,430
350
2,220
Ride 8........
$1,750
190
2,410
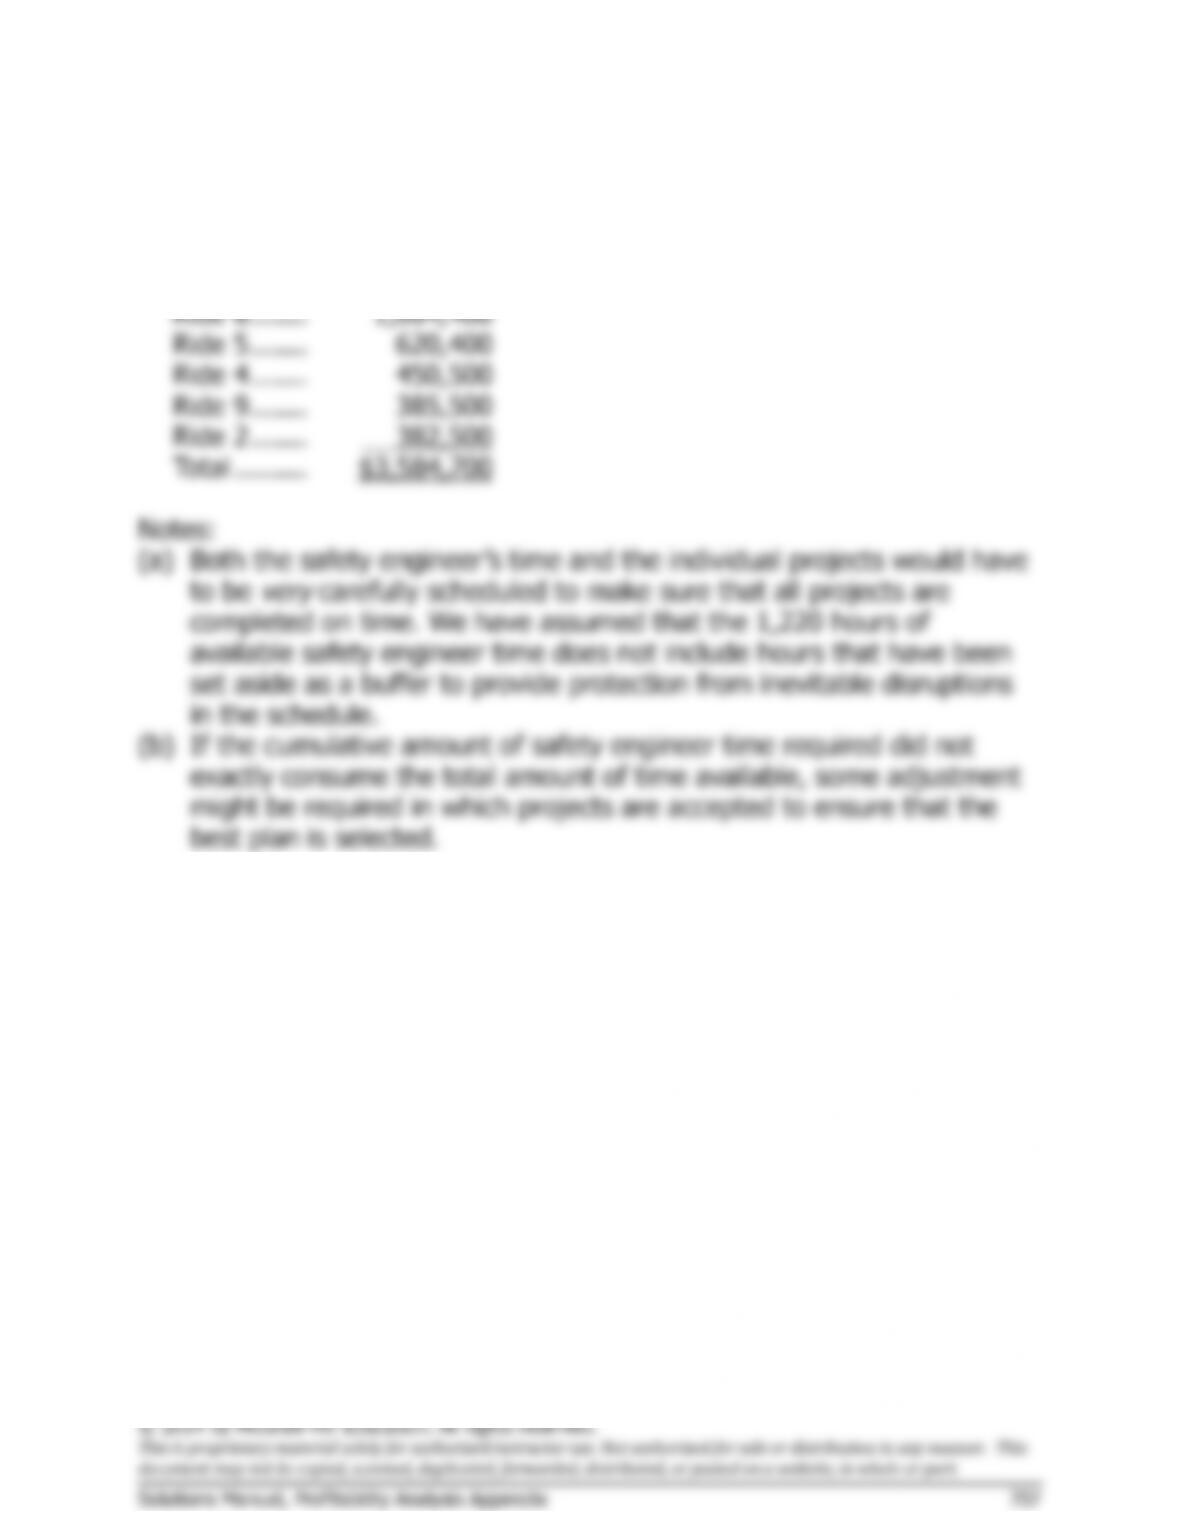
Given the 1,220 hours of safety engineer time available, the six rides
above the line in the above table should be built.
Exercise B-2 (30 minutes)
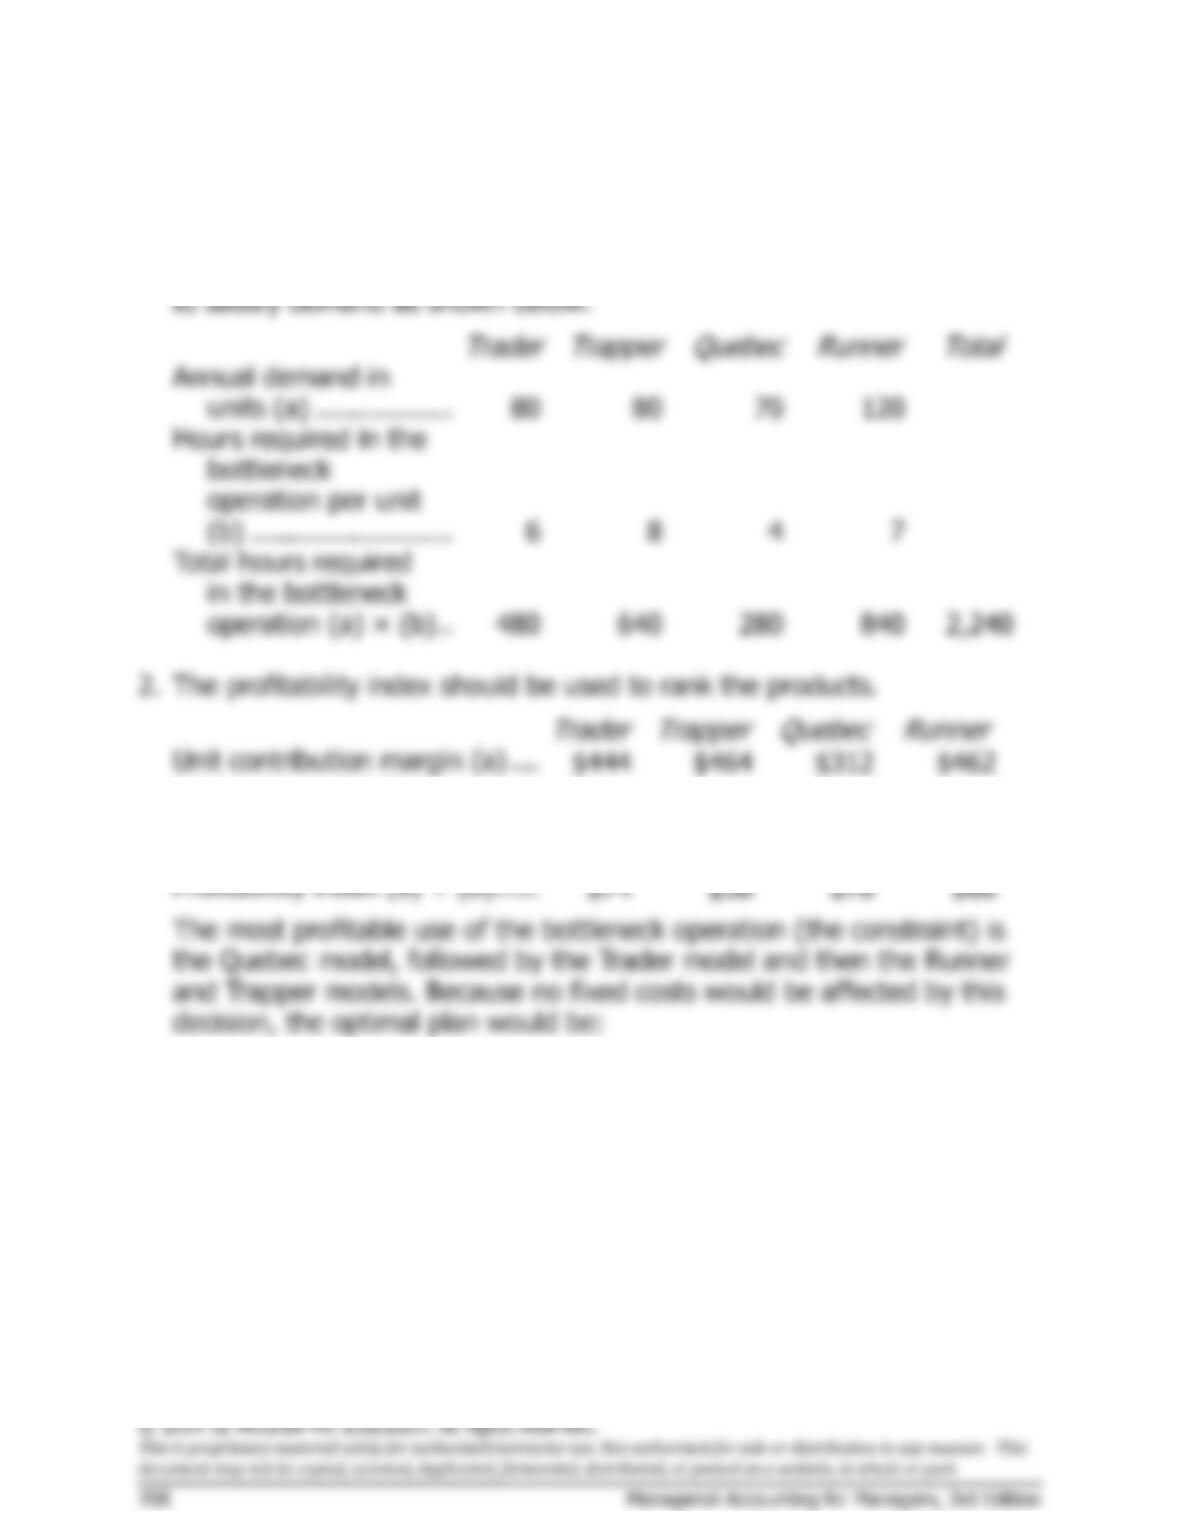
1. There is not enough capacity in the bottleneck operation to satisfy
demand for all four products. The total amount of time available in the
bottleneck operation is 1,800 hours, but 2,240 hours would be required
Problem B-4 (60 minutes)
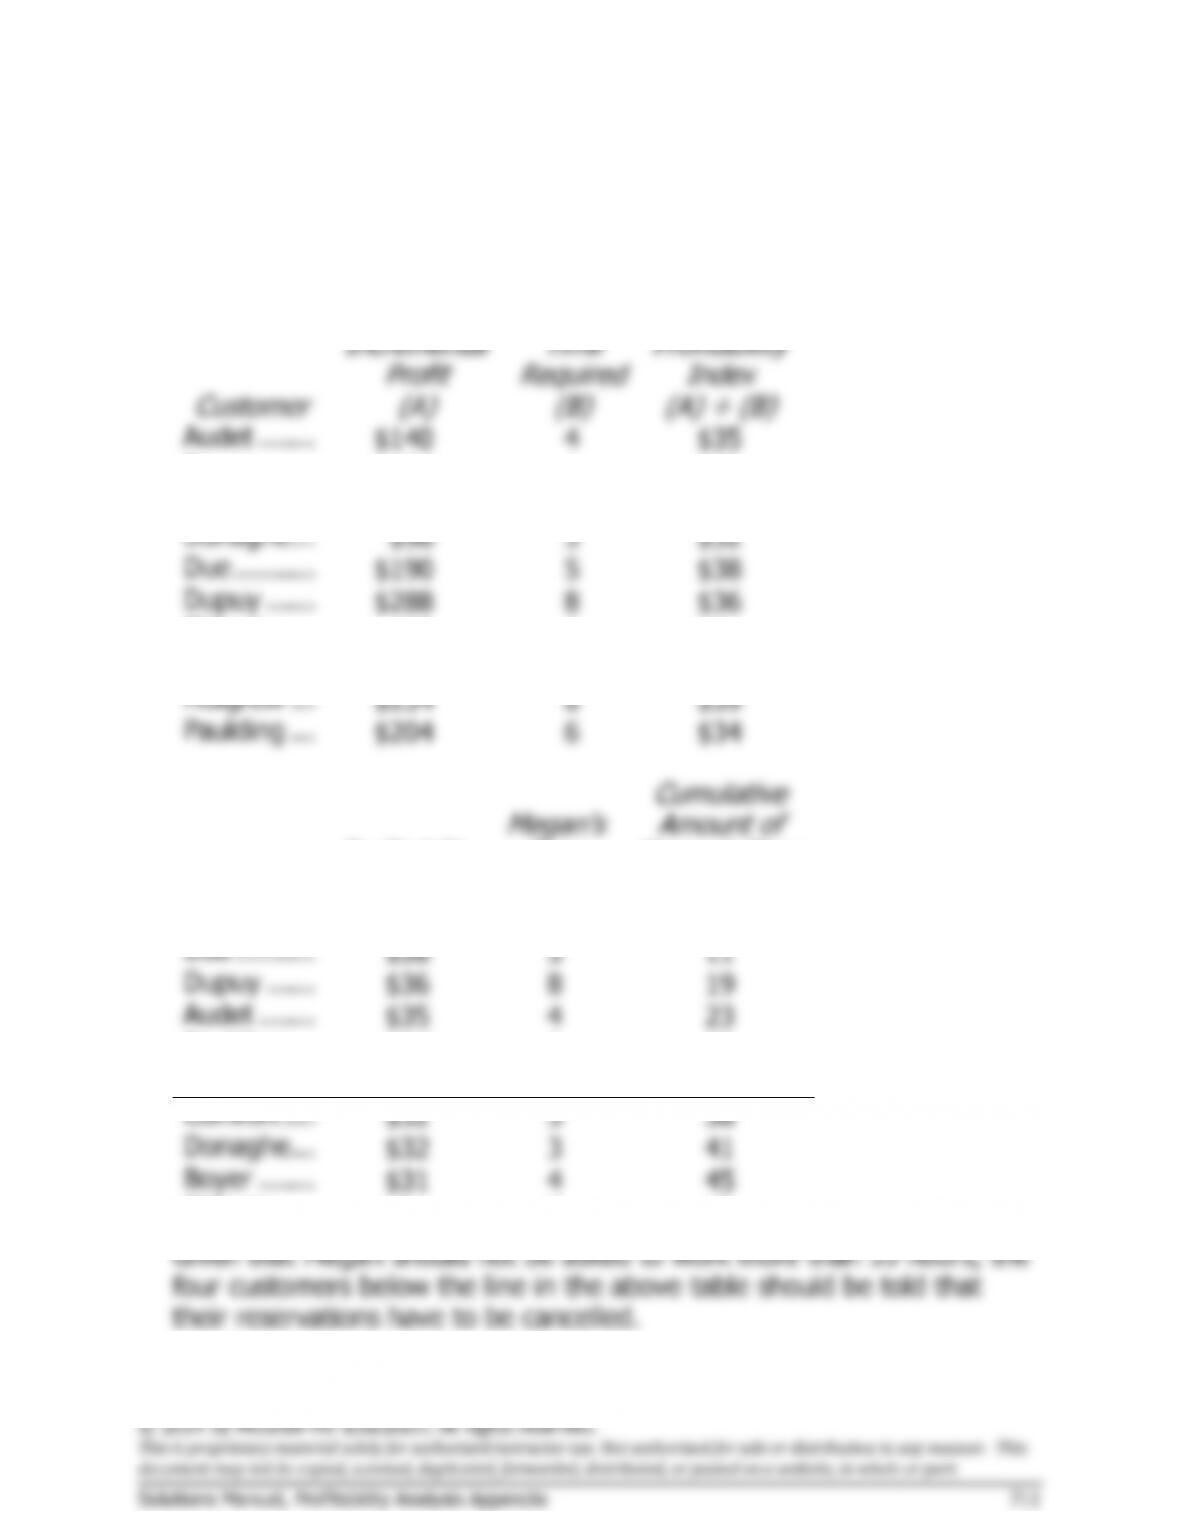
1. This problem can be solved by first computing the profitability index of
each customer and then ranking the customers based on that
profitability index:
Customer
Incremental
Profit
(A)
Megan’s
Time
Required
(B)
Profitability
Index
(A) ÷ (B)
Audet .......
$140
4
$35
Boyer .......
$124
4
$31
Comfort ....
$160
5
$32
Donaghe ...
$96
3
$32
Due ..........
$190
5
$38
Dupuy ......
$288
8
$36
Ebberts .....
$93
3
$31
Imm .........
$136
4
$34
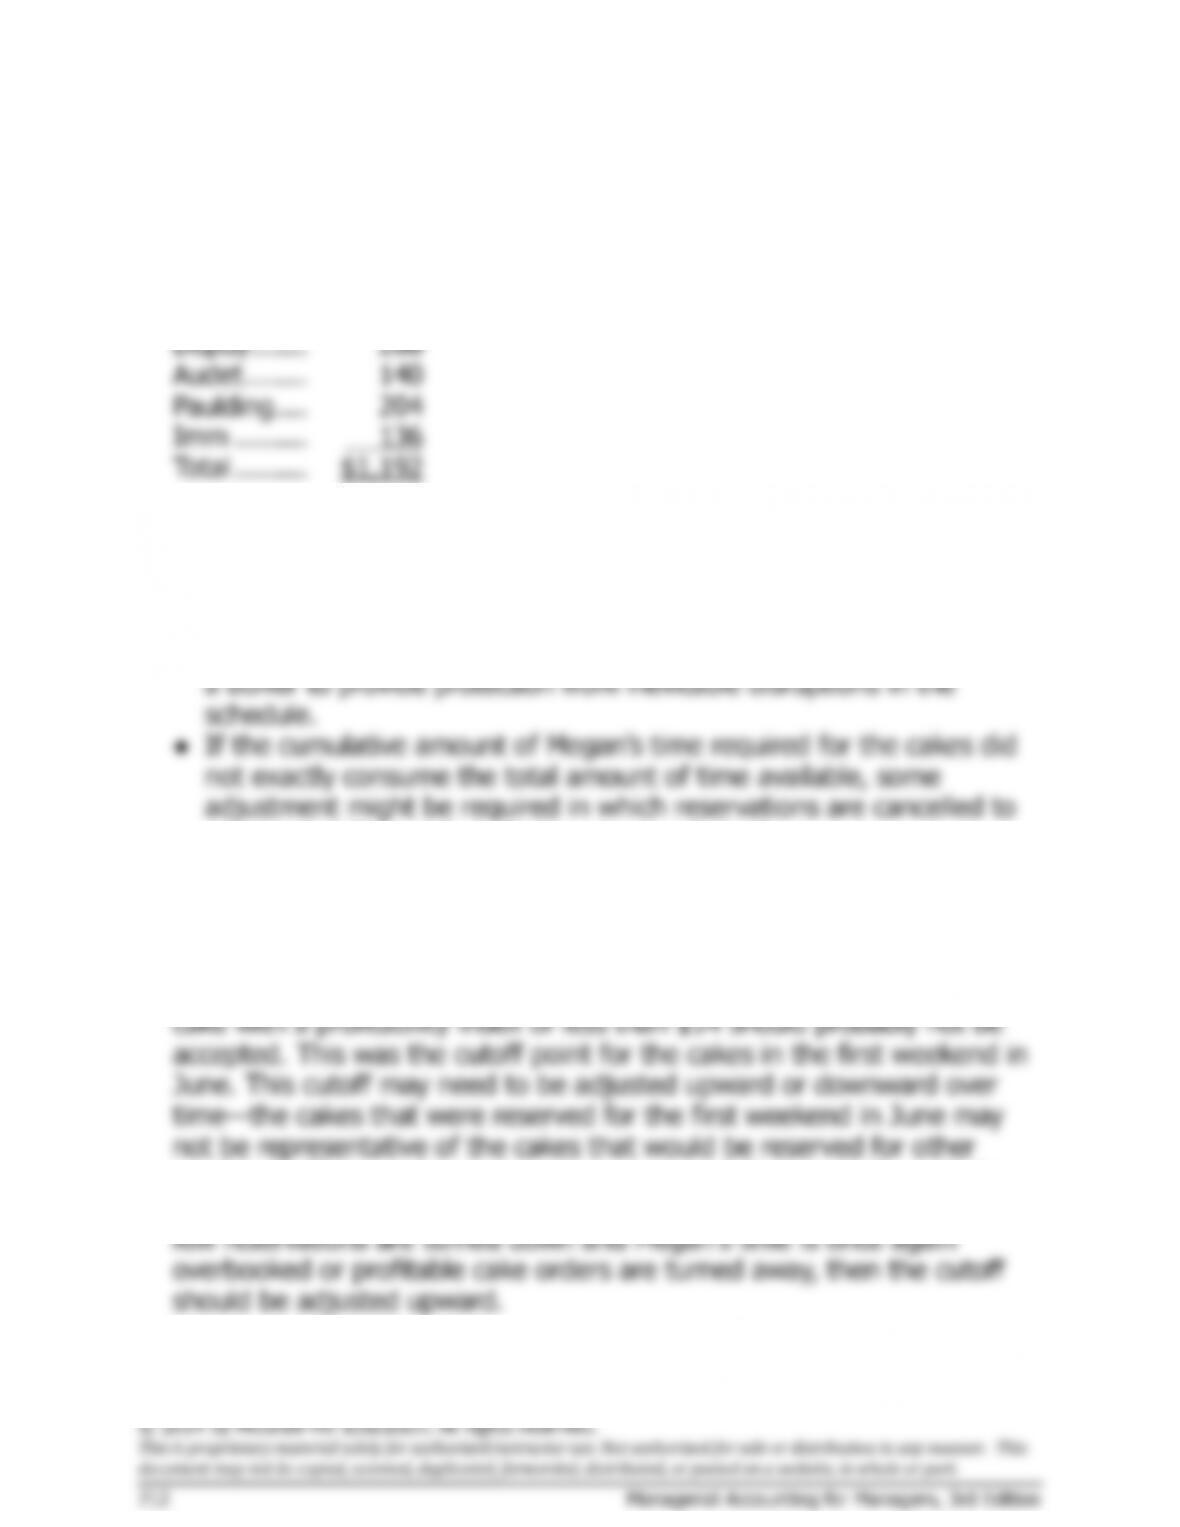
Mulgrew ...
$234
6
$39
Paulding ...
$204
6
$34
Customer
Profitability
Index
Megan’s
Time
Required
Cumulative
Amount of
Megan’s Time
Required
Mulgrew ...
$39
6
6
Due ..........
$38
5
11
Dupuy ......
$36
8
19
Audet .......
$35
4
23
Paulding ...
$34
6
29
Imm .........
$34
4
33
Comfort ....
$32
5
38
Donaghe ...
$32
3
41
Boyer .......
$31
4
45
Ebberts .....
$31
3
48