Unlock document.
This document is partially blurred.
Unlock all pages and 1 million more documents.
Get Access
Student Name:
Class:
Department Department
A B Total
536,250 288,750 825,000
4,200 2,800 7,000
532,050 285,950 818,000
45,000 15,000 60,000
200,000 115,000 315,000
500 500 1,000
200,500 115,500 316,000
1,500 500 2,000
199,000 115,000 314,000
244,000 130,000 374,000
41,000 11,000 52,000
203,000 119,000 322,000
329,050 166,950 496,000
100,000 50,000 150,000
15,000 5,000 20,000
660 20 680
40 80 120
115,700 55,100 170,800
213,350 111,850 325,200
9,000 6,000 15,000
24,000 12,000 36,000
4,000 2,000 6,000
26,000 14,000 40,000
910 490 1,400
3,250 1,750 5,000
3,600 2,400 6,000
325 175 500
71,085 38,815 109,900
142,265 73,035 215,300
300
500
215,100
Correct!
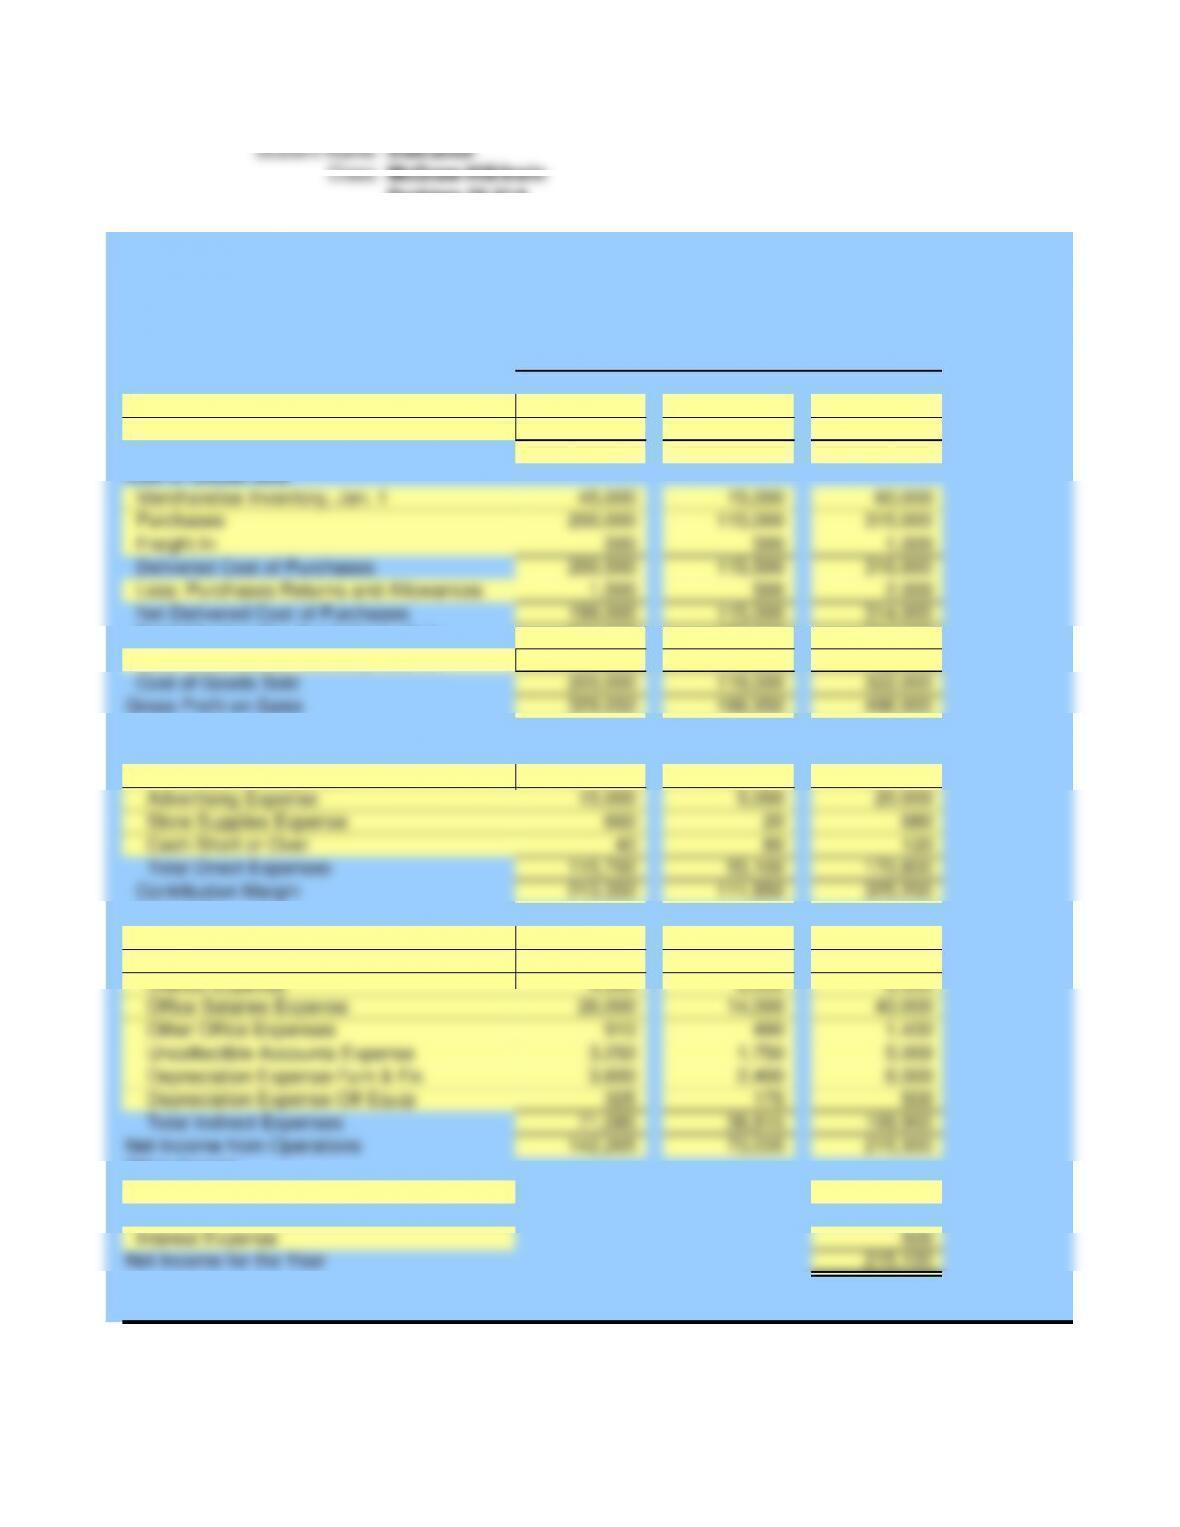
Less Merchandise Inventory, Dec. 31
Total Merchandise Available for Sale
Sales Returns and Allowances
Sales
Net Delivered Cost of Purchases
Freight In
Cost of Goods Sold
Problem 25.01A
McGraw-Hill/Irwin
Net Sales
Income Statement
New2U
Instructor
Store Supplies Expense
Operating Expenses
Year Ended December 31, 2013
Operating Revenues
Purchases
Merchandise Inventory, Jan. 1
Less: Purchases Returns and Allowances
Delivered Cost of Purchases
Gross Profit on Sales
Cost of Goods Sold
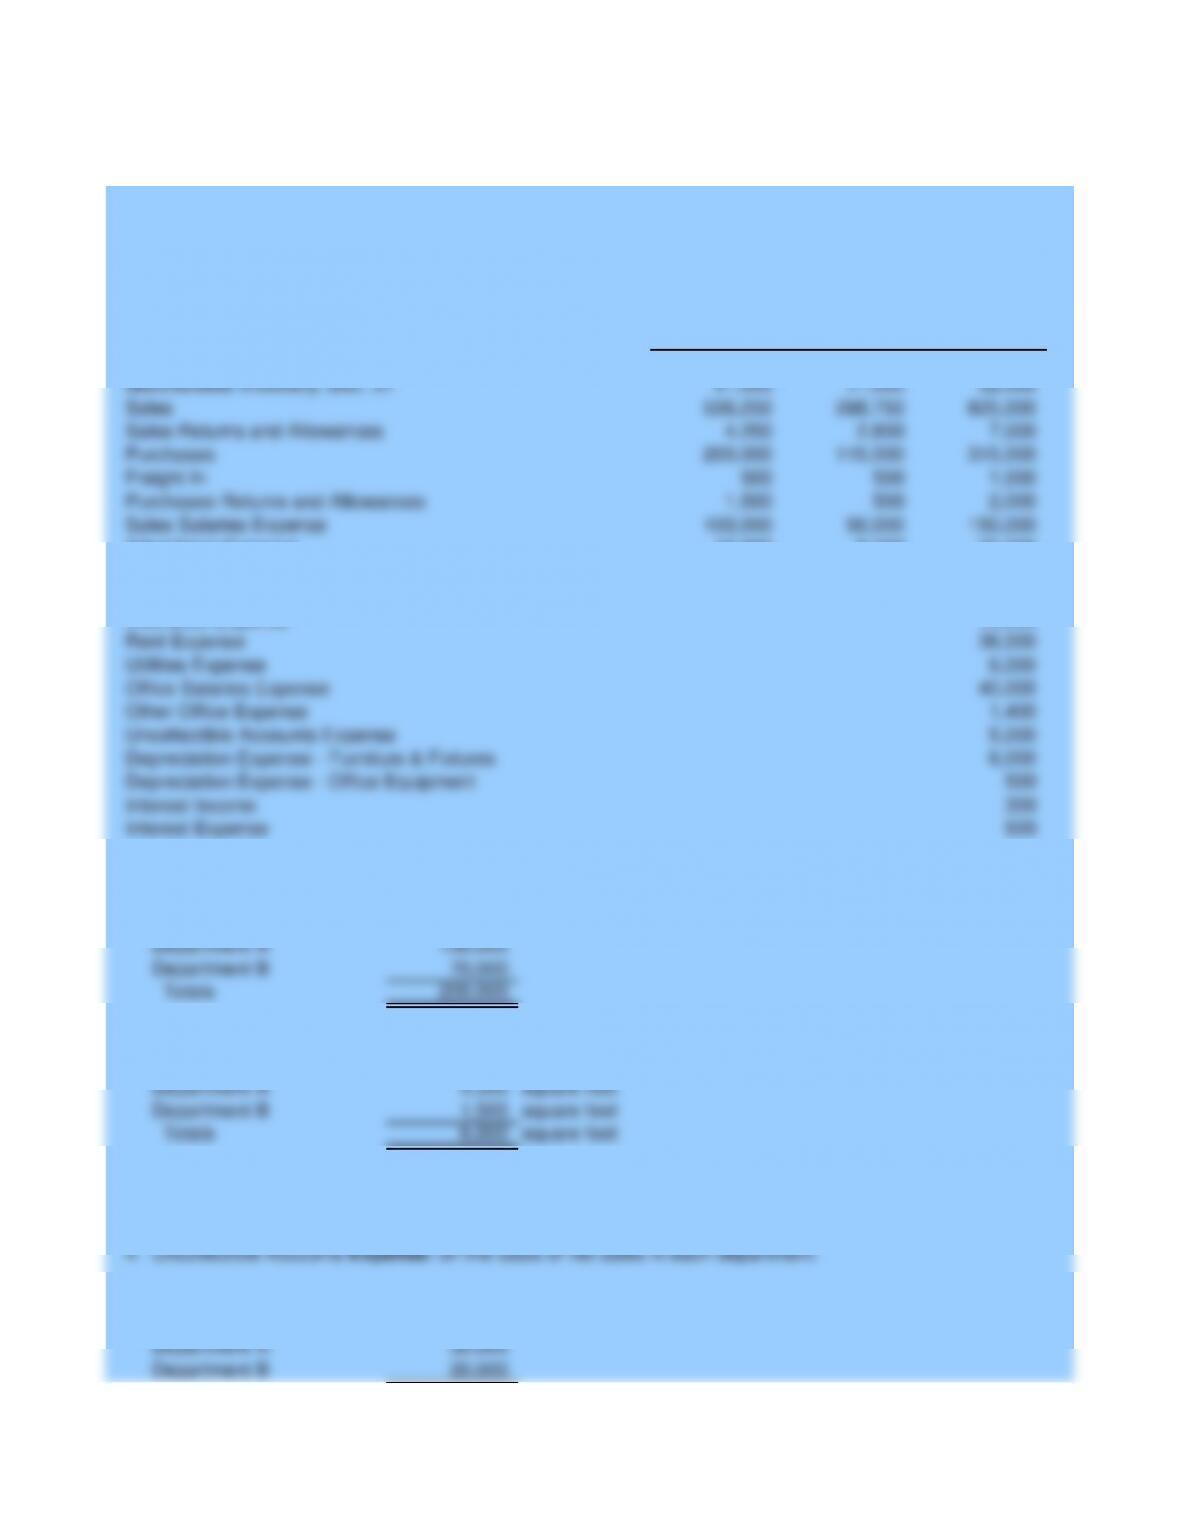
Utilities Expense
Rent Expense
Insurance Expense
Contribution Margin
Total Direct Expenses
Cash Short or Over
Net Income from Operations
Other Office Expenses
Total Indirect Expenses
Advertising Expense
Sales Salaries Expense
Direct Expenses
Depreciation Expense-Off Equip
Depreciation Expense-Furn & Fix
Uncollectible Accounts Expense
Office Salaries Expense
Indirect Expenses
Net Income for the Year
Interest Expense
Other Expense
Interest Income
Other Income
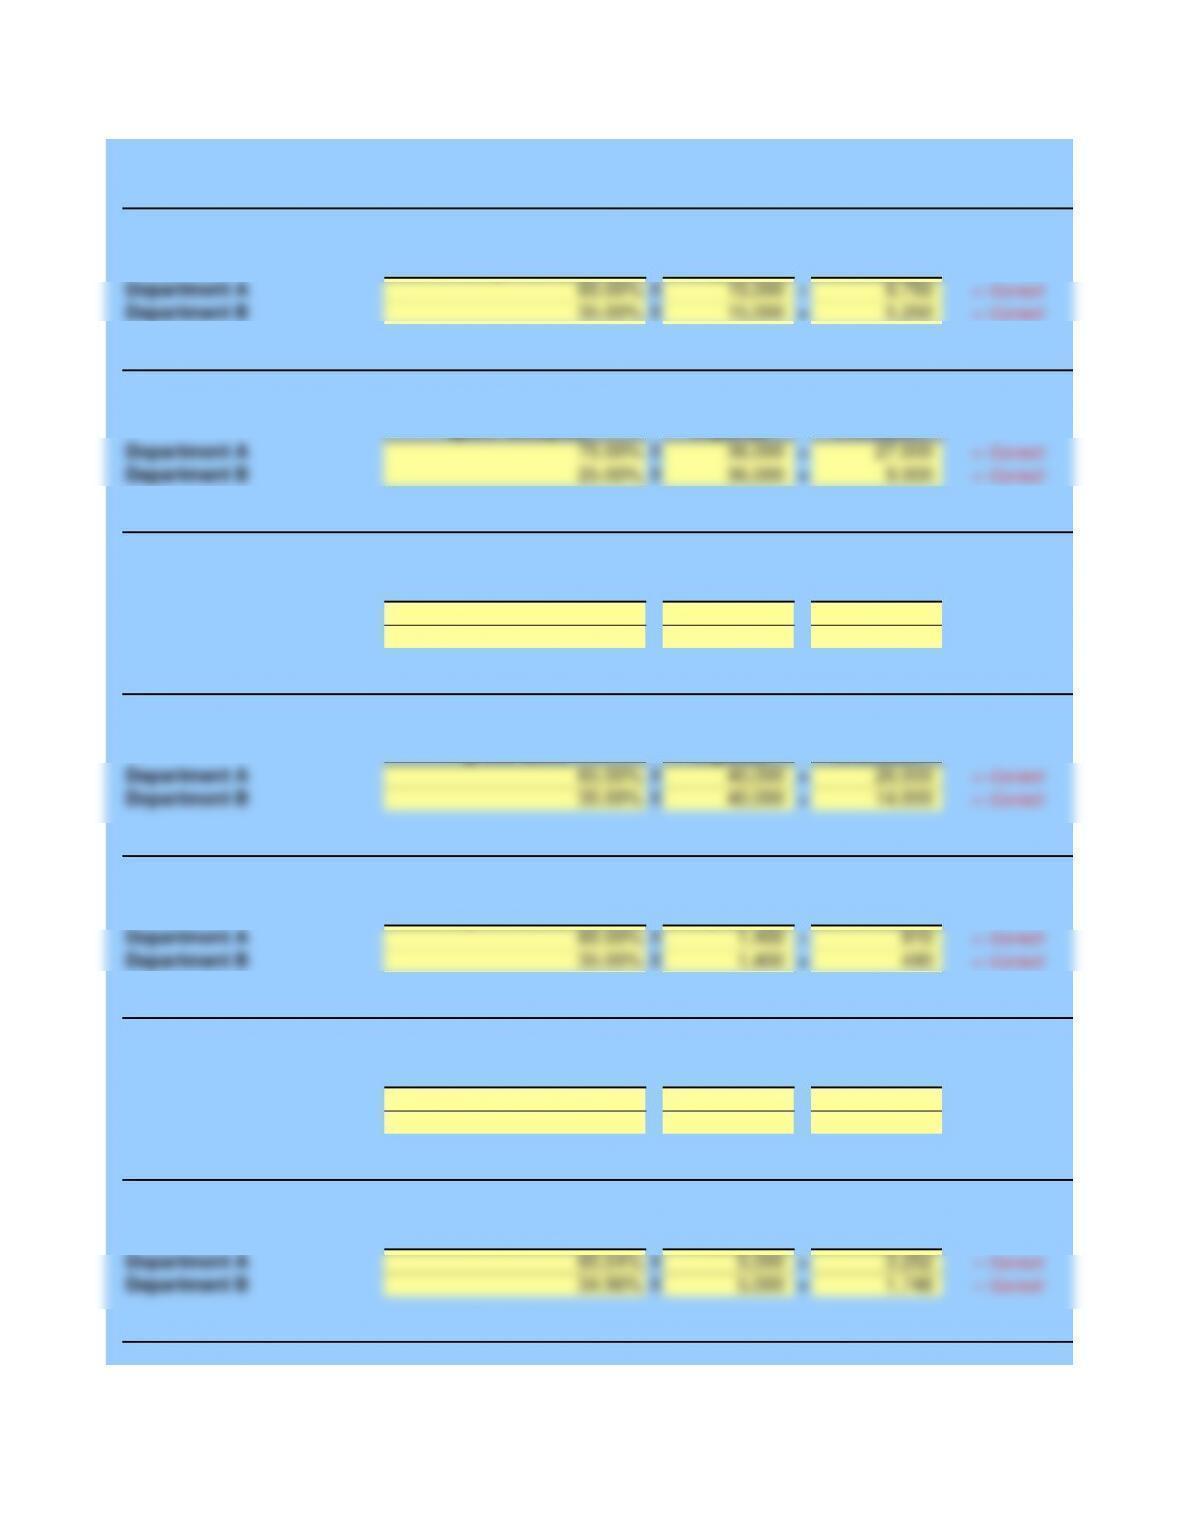
Insurance Department
Expense Allocation
Department A X 15,000 = 9,750 <--Correct!
Department B X 15,000 = 5,250 <--Correct!
Rent Department
Expense Allocation
Department A X 36,000 = 27,000 <--Correct!
Department B X 36,000 = 9,000 <--Correct!
Utilities Department
Expense Allocation
Department A X 6,000 = 4,500 <--Correct!
Department B X 6,000 = 1,500 <--Correct!
Office
Salaries Department
Expense Allocation
Department A X 40,000 = 26,000 <--Correct!
Department B X 40,000 = 14,000 <--Correct!
Other
Office Department
Expenses Allocation
Department A X 1,400 = 910 <--Correct!
Department B X 1,400 = 490 <--Correct!
Depreciation
Expense Department
Off. Equip. Allocation
Department A X500 = 325 <--Correct!
Department B X500 = 175 <--Correct!
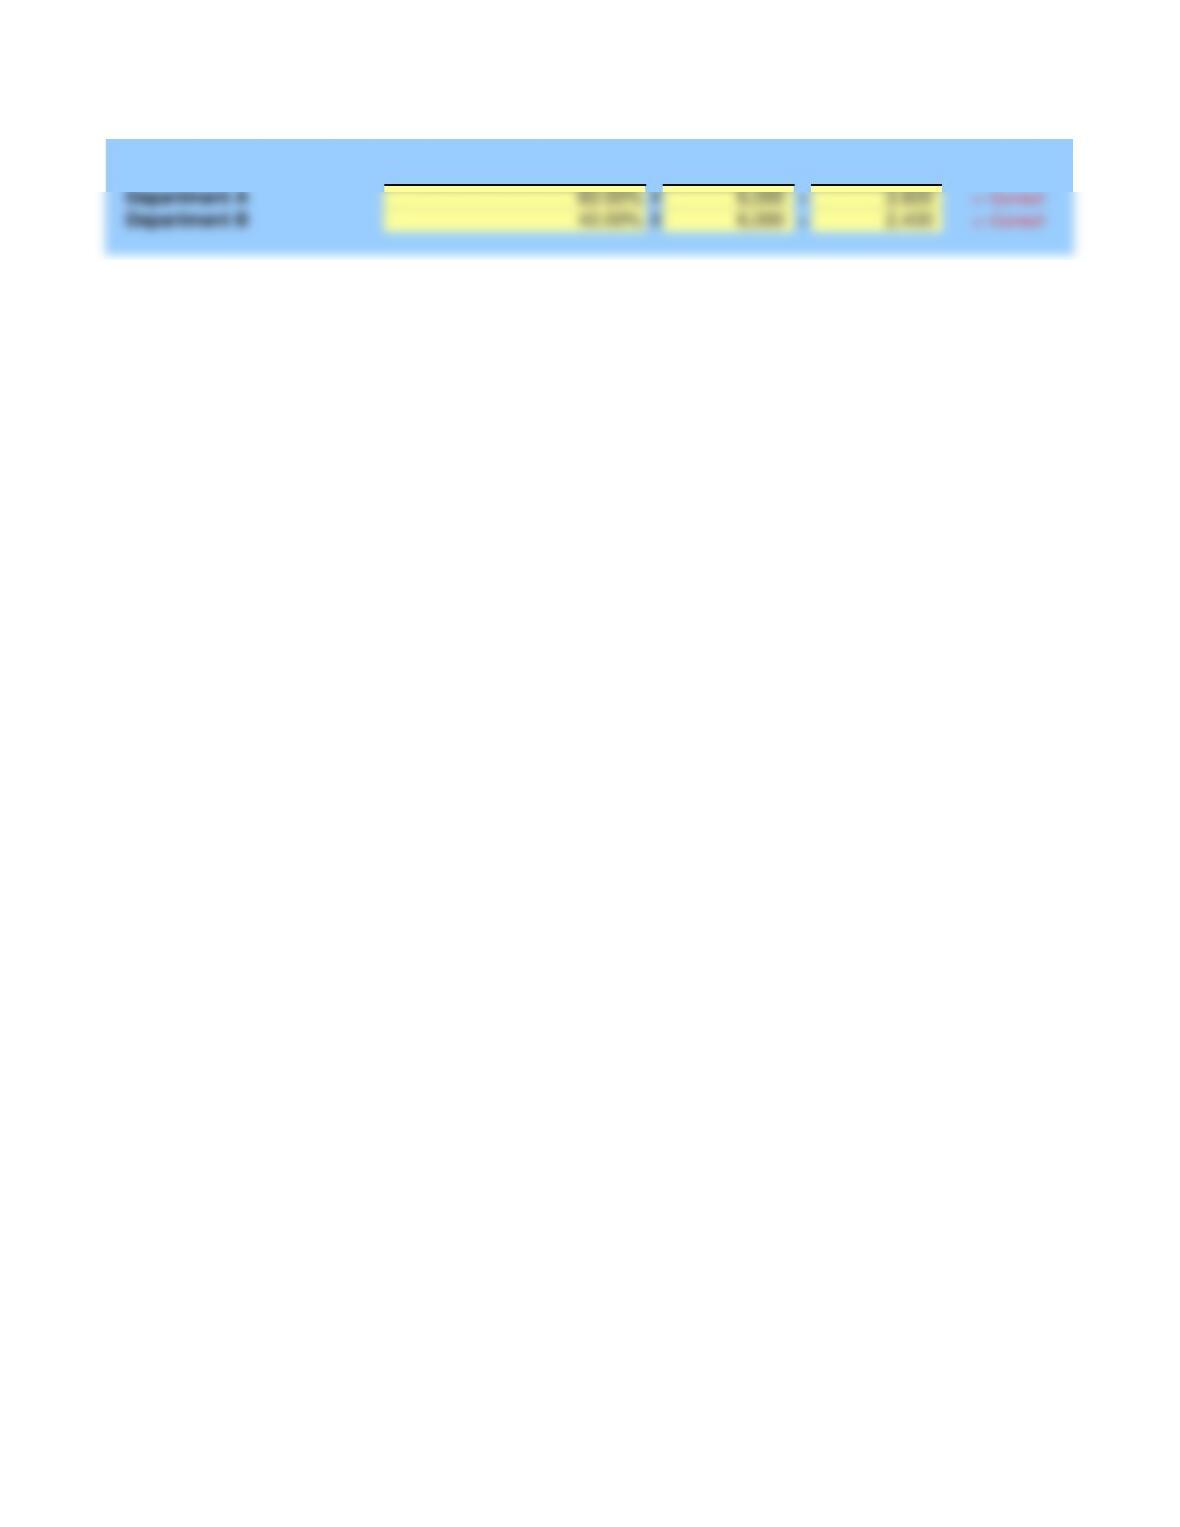
Uncollectible
Accounts Department
Expense Allocation
Department A X 5,000 = 3,252 «- Correct!
Department B X 5,000 = 1,748 «- Correct!
Depreciation
ALLOCATION OF INDIRECT EXPENSES
Rent Expense
Insurance Expense
Proportion of floor
Proportion of gross assets
before depreciation and
ending inventory
35.00%
65.00%
Proportion of floor
space occupied
75.00%
space occupied
75.00%
25.00%
Utilities Expense
gross sales
65.00%
35.00%
Other Office Expenses
25.00%
Office Salaries Expense
Proportion of total
35.00%
Depreciation Expense - Office Equipment
Proportion of total
Proportion of total
gross sales
65.00%
Proportion of total
net sales
65.04%
gross sales
65.00%
35.00%
Uncollectible Accounts Expense
34.96%
Depreciation Expense - Furniture and Fixtures
Expense Department
Furn. & Fixt. Allocation
Department A X 6,000 = 3,600 <--Correct!
Department B X 6,000 = 2,400 <--Correct!
furniture and fixtures
60.00%
40.00%
Proportion of cost of
Department Department
A B Total
45,000$ 15,000$ 60,000$
41,000 11,000 52,000
536,250 288,750 825,000
4,200 2,800 7,000
200,000 115,000 315,000
500 500 1,000
1,500 500 2,000
40,000
1,400
5,000
6,000
Purchases
Sales Returns and Allowances
Sales
Merchandise Inventory, Dec. 31
Merchandise Inventory, Jan. 1
Purchases Returns and Allowances
Freight In
Uncollectible Accounts Expense
Other Office Expense
Office Salaries Expense
New2U
Selected Information
Adjusted Trial Balance
December 31, 2013
Depreciation Expense - Furniture & Fixtures
Given Data P25.01A

Totals 50,000
Student Name:
Class:
Plants Chemicals Tools Total
126,750 75,500 50,400 252,650
1,750 500 400 2,650
125,000 75,000 50,000 250,000
2,600 2,600 2,900 8,100
50,000 47,000 36,000 133,000
500 400 300 1,200
49,500 46,600 35,700 131,800
52,100 49,200 38,600 139,900
2,500 2,400 2,000 6,900
49,600 46,800 36,600 133,000
75,400 28,200 13,400 117,000
30,000 17,500 15,500 63,000
45,400 10,700 (2,100) 54,000
9,600 5,400 5,000 20,000
35,800 5,300 (7,100) 34,000
Correct! Correct! Correct! Correct!
125,000 75,000 50,000 250,000
50% 30% 20%
20,000 20,000 20,000
10,000 6,000 4,000 20,000
45,400 10,700 (2,100) 54,000
10,000 6,000 4,000 20,000
35,400 4,700 (6,100) 34,000
Correct! Correct! Correct! Correct!
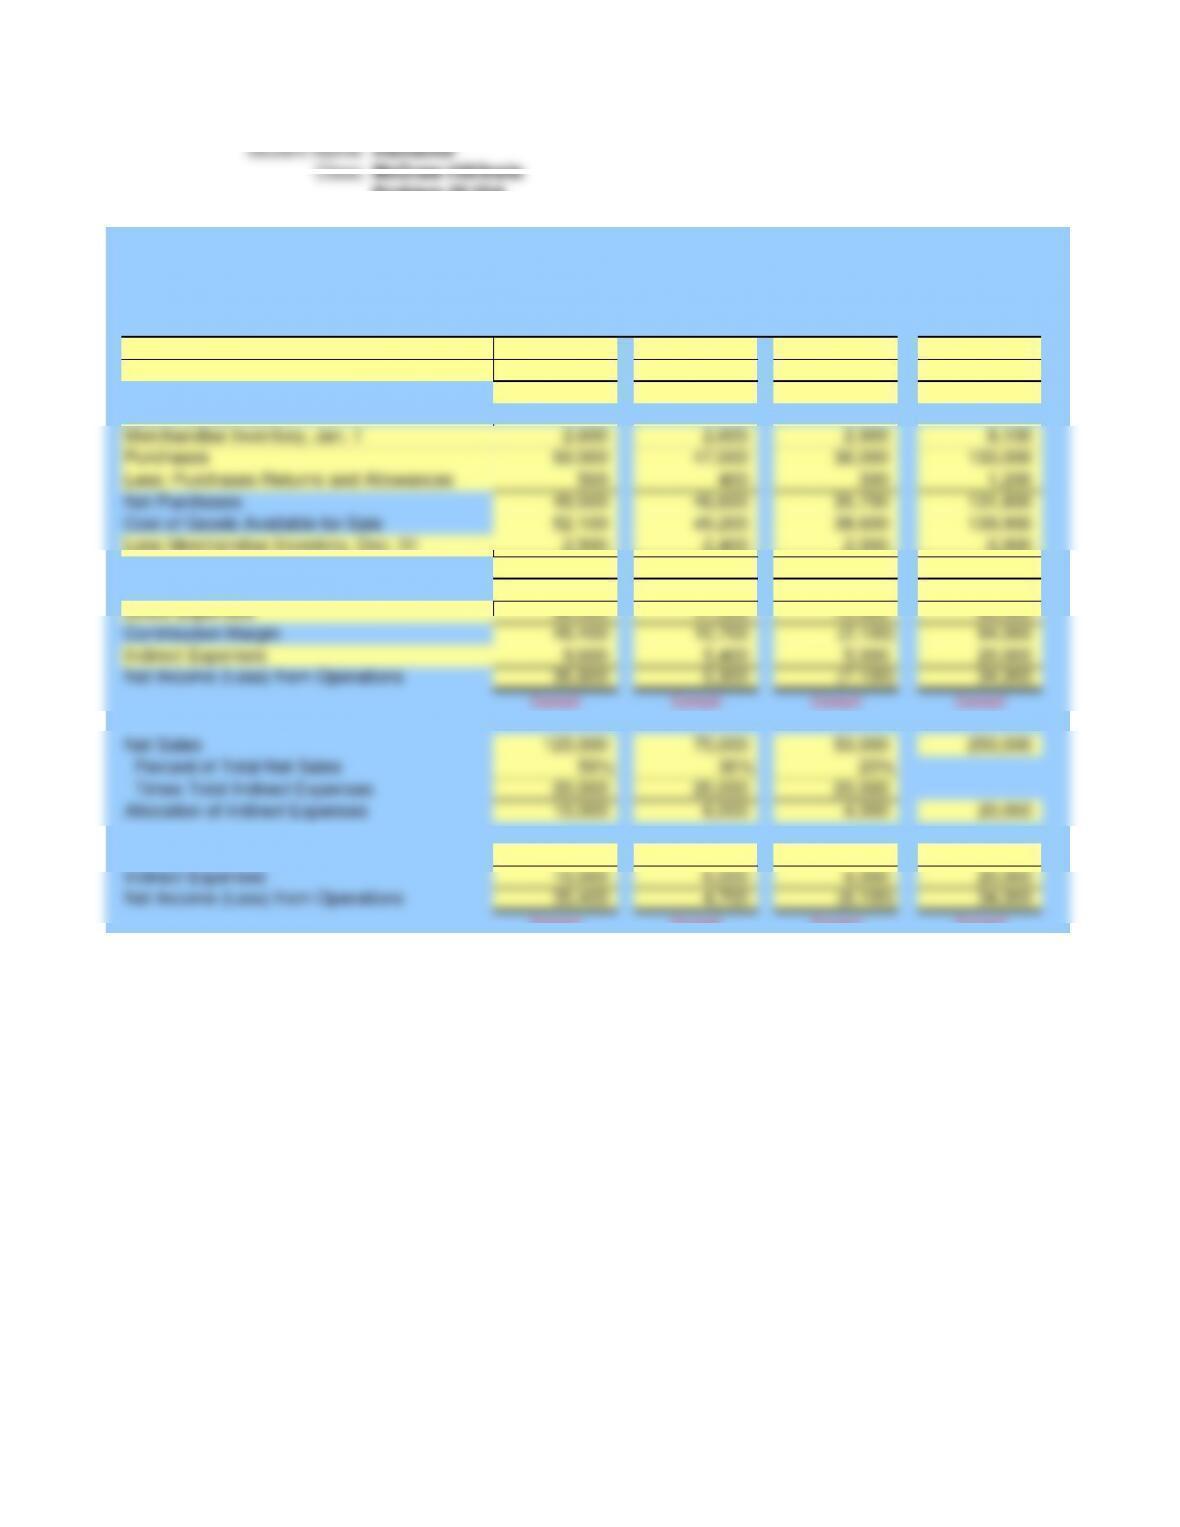
Net Income (Loss) from Operations
Indirect Expenses
Contribution Margin
Allocation of Indirect Expenses
Instructor
Year Ended December 31, 2013
Income Statement
YARD SHOP
Times Total Indirect Expenses
Percent of Total Net Sales
Net Sales
Sales
Less: Sales Returns and Allowances
Net Sales
Cost of Goods Sold
Problem 25.02A
McGraw-Hill/Irwin
Less Merchandise Inventory, Dec. 31
Merchandise Inventory, Jan. 1
Purchases
Less: Purchases Returns and Allowances
Net Purchases
Cost of Goods Available for Sale
Net Income (Loss) from Operations
Contribution Margin
Indirect Expenses
Cost of Goods Sold
Gross Profit
Direct Expenses
Plants Chemicals Tools
9,600$ 5,400$ 5,000$
2,600 2,600 2,900
30,000 17,500 15,500
2,500 2,400 2,000
50,000 47,000 36,000
500 400 300
126,750 75,500 50,400
1,750 500 400
Ending merchandise inventory
Direct Expenses
Beginning merchandise inventory
Allocated indirect expenses
Given Data P25.02A
YARD SHOP
Selected Information
December 31, 2013
Sales returns and allowances
Sales
Purchases returns and allowances
Purchases


