Unlock document.
This document is partially blurred.
Unlock all pages and 1 million more documents.
Get Access
SOLUTIONS TO BUSINESS CONNECTIONS
Managerial Focus:
1. Identifies actual cash received and used to forecast additional cash outflow required if borrowing
money.
3. The statement of cash flows gives specific details on actual cash receipts and payments. Income
statement does not.
Ethical Dilemma:
Financial Statement Analysis:
Analyze Online:
Answers will vary depending on the current year.
Teamwork:
Internet Connection:
Ida’s action is unethical and audited financial statements will discover her actions. However, it could be
argued that her actions are acceptable if the lack of payment was disclosed in the financial statements.
The increase or decrease in cash can be a result of cash flow from operations, increased debt, or sale of
Microsoft has a higher balance in cash flow from operations than Federated. In order for technology
Net cash provided by (1) operations was $5,125 million; (2) investing dollars used were $755 million;
and (3) financing dollars used were $3,503. From these data, obviously, the cash provided from
operations was used to invest and finance the remainder of the company's operations.
Part A True-False
1. TRUE 10. FALSE
3. TRUE 12. TRUE
5. TRUE 14. FALSE
7. FALSE 16. TRUE
*9. FALSE
Part B Matching
1. c
3. b
5. a
7. d
SOLUTIONS TO PRACTICE TEST
1. Prepare a horizontal and a vertical analysis of the statements. Round all dollar calculations to the
2. Calculate the following ratios for each year:
a. The rate of return on net sales.
b. The rate of return on common stockholders’ equity. Preferred dividends are $5,000 for both years.
d. The price-earnings ratio on common stock. The market values were $4.00 in 2012 and $3.00 in
2013.
g. The current ratio.
Instructions
MINI-PRACTICE SET 4
FINANCIAL ANALYSIS AND DECISION MAKING
Introduction
HHI Merchandise, Inc. sells a variety of consumer products. Its comparative income statement and balance
sheet for the years 2013 and 2012 are presented on the following pages.
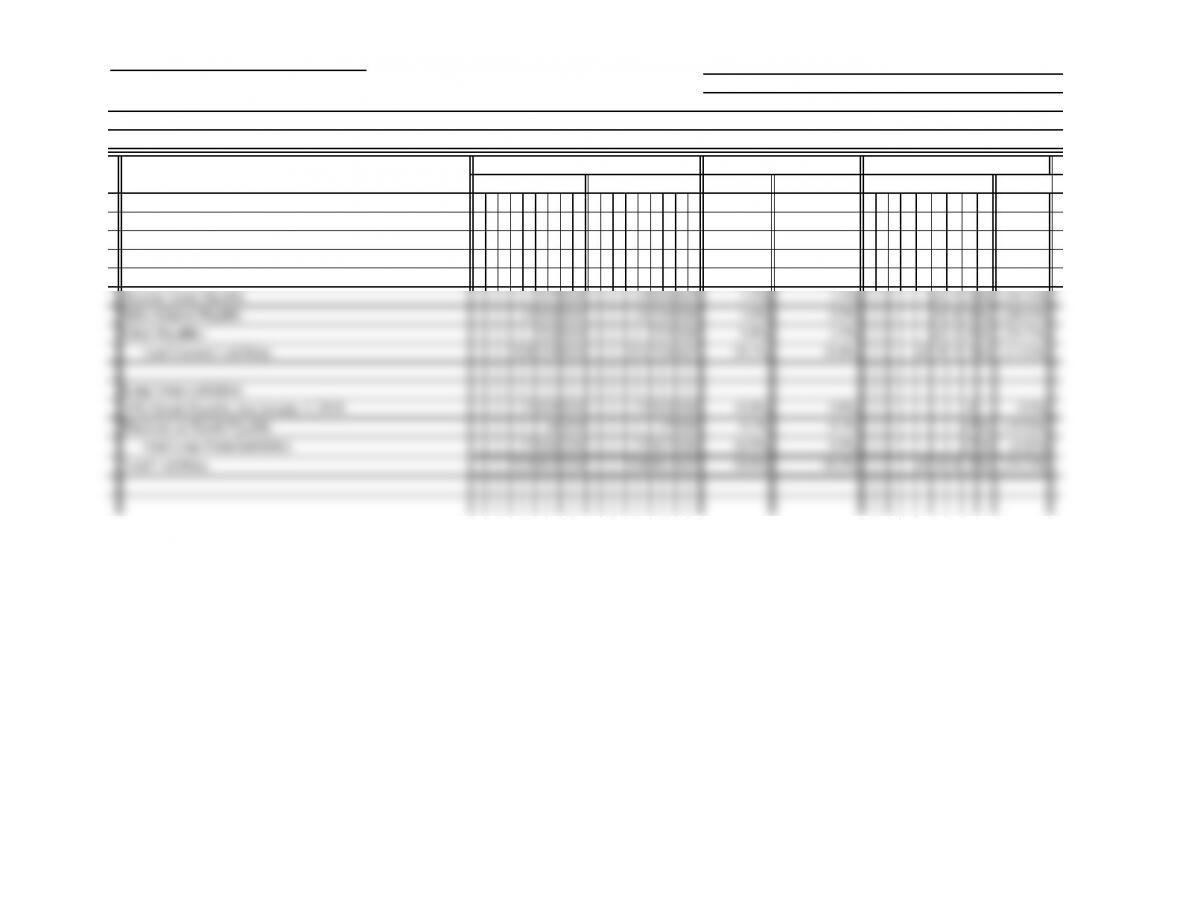
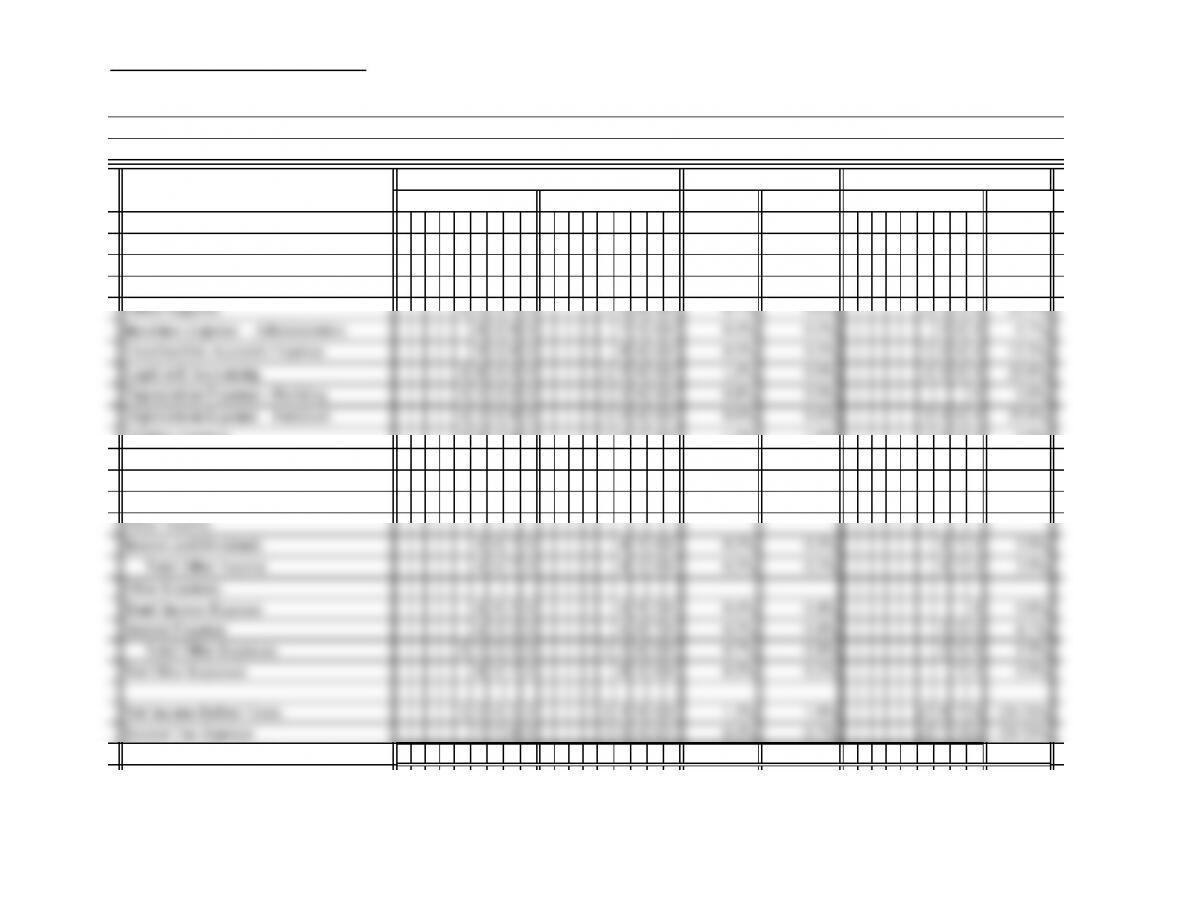
HHI MERCHANDISE, INC.
MINI-PRACTICE SET 4 (continued) Name
2013 2012
Revenue
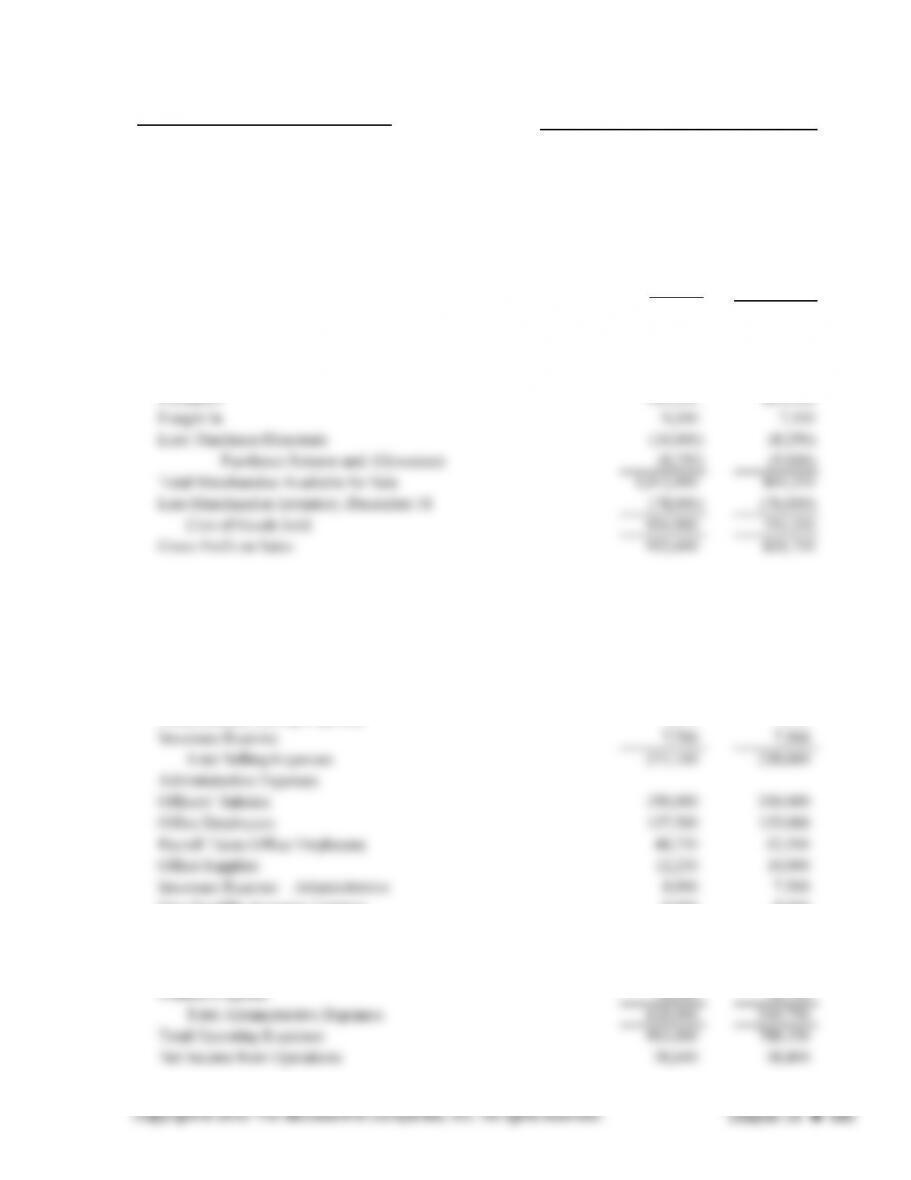
Sales 1,898,000 1,642,000
Less: Sales Returns and Allowances (29,500) (22,000)
Net Sales 1,868,500 1,620,000
Cost of Goods Sold
Merchandise Inventory, January 1 76,000 75,000
Purchases 945,650 800,000
Operating Expenses
Selling Expenses
Advertising 25,000 21,000
Sales Salaries 200,000 175,000
Payroll Taxes Sales 20,000 17,500
Supplies Expense 11,825 9,650
Miscellaneous Selling Expenses 9,575 7,950
Uncollectible Accounts Expense 9,000 8,000
Legal and Accounting 18,000 15,000
Depreciation Expense—Building 15,000 15,000
Depreciation Expense—Furniture 12,000 10,000
HHI Merchandise, Inc.
Comparative Income Statement
Years Ended December 31, 2013 and 2012
MINI-PRACTICE SET 4 (continued) Name
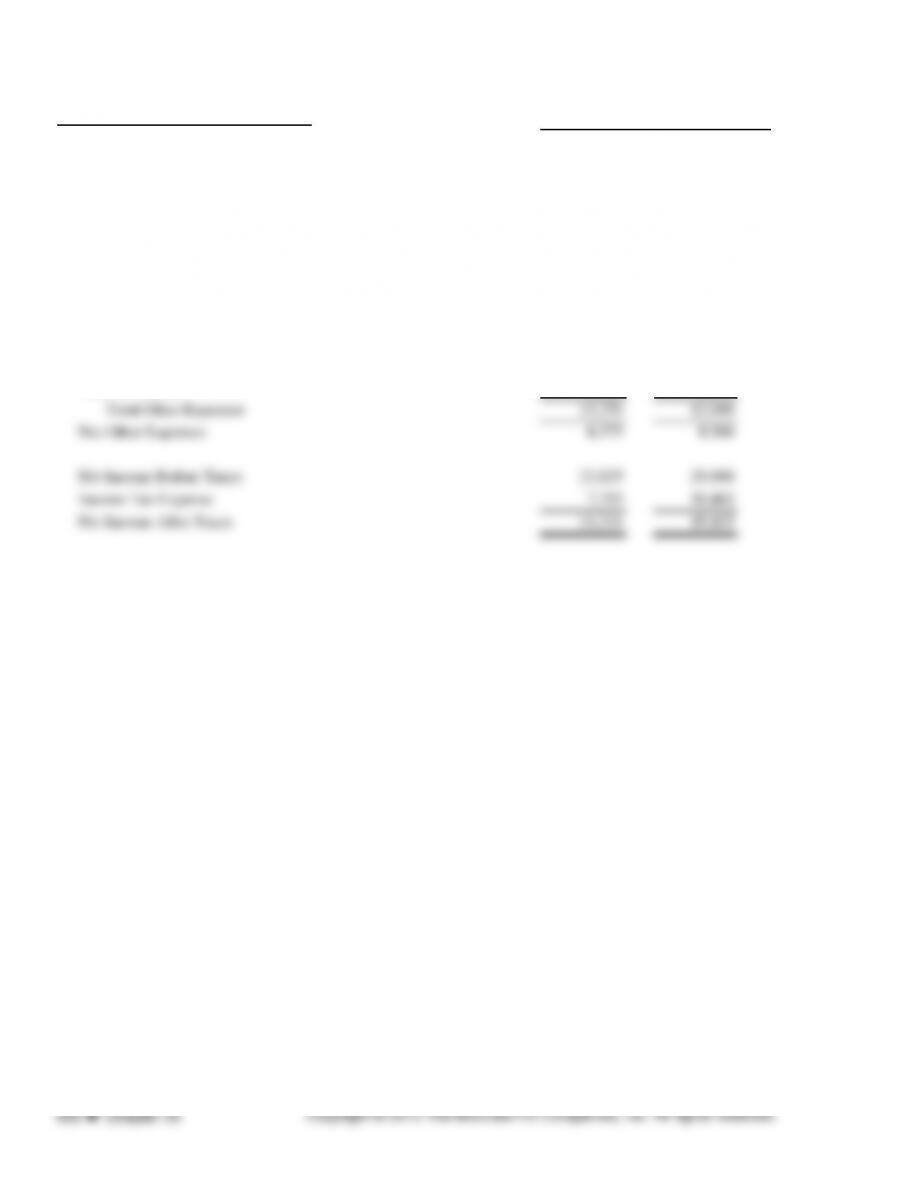
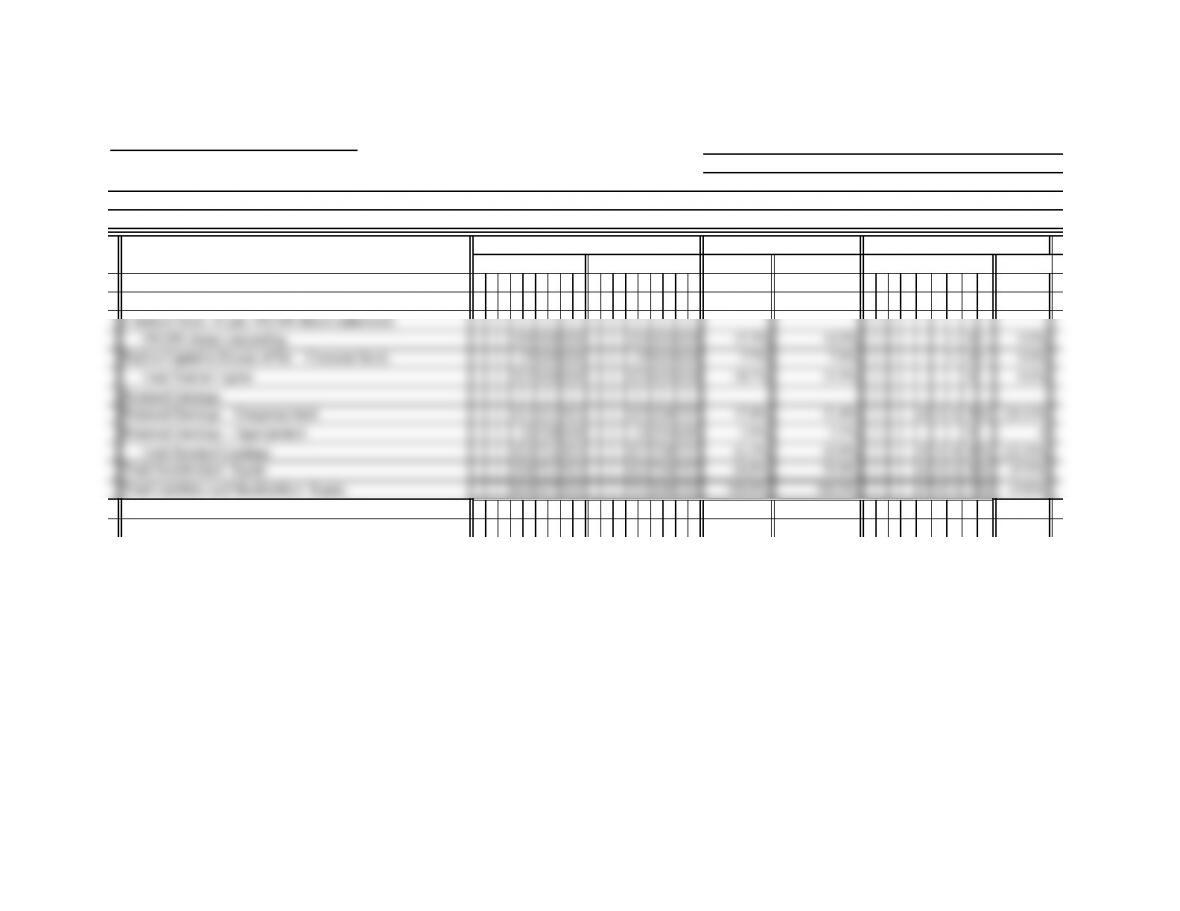
Other Income
Interest and Dividends 4,675 4,500
Total Other Income 4,675 4,500
Other Expenses
Bond Interest Expense 6,930 6,930
Interest Expense 6,320 6,070
HHI Merchandise, Inc.
Comparative Income Statement (continued)
Years Ended December 31, 2013 and 2012
MINI-PRACTICE SET 4 (continued) Name
2013 2012
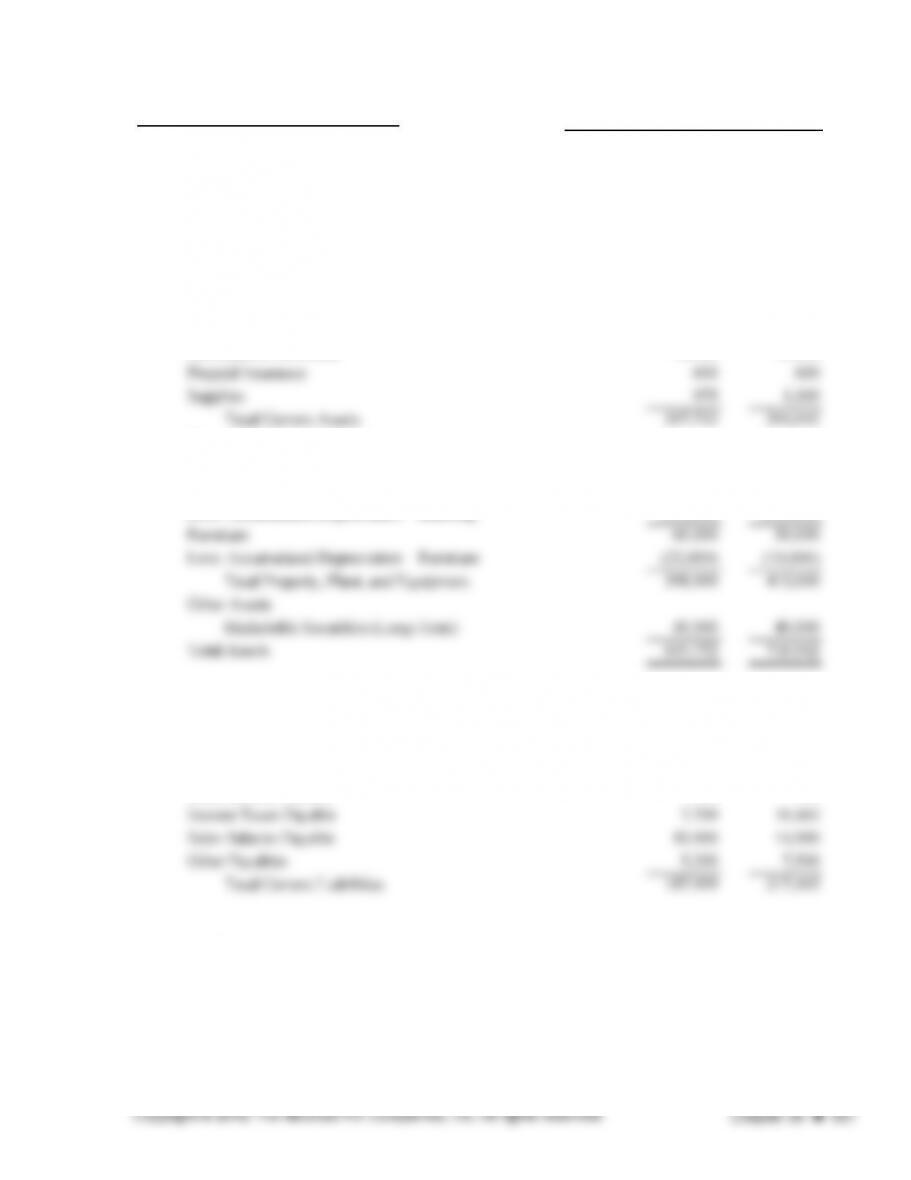
Current Assets
Cash 38,157 61,942
Accounts Receivable 90,000 121,500
Merchandise Inventory 78,000 76,000
Property, Plant, and Equipment
Land 105,000 105,000
Building 300,000 300,000
Less: Accumulated Depreciation—Building (45,000) (30,000)
Current Liabilities
Accounts Payable 119,500 125,000
Notes Payable 45,000 60,000
Bond Interest Payable 500 500
December 31, 2013 and 2012
Assets
Liabilities and Stockholders’ Equity
HHI Merchandise, Inc.
Comparative Balance Sheet
MINI-PRACTICE SET 4 (continued) Name
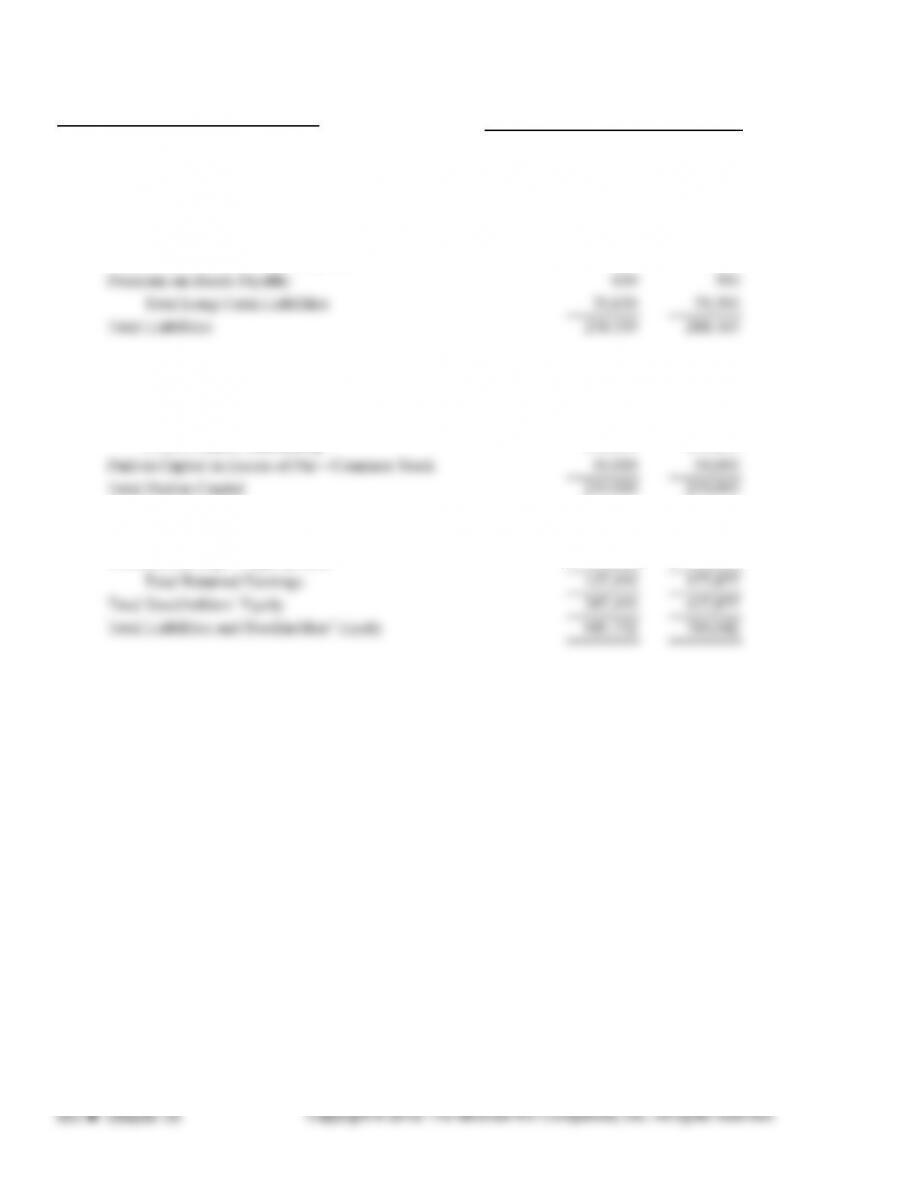
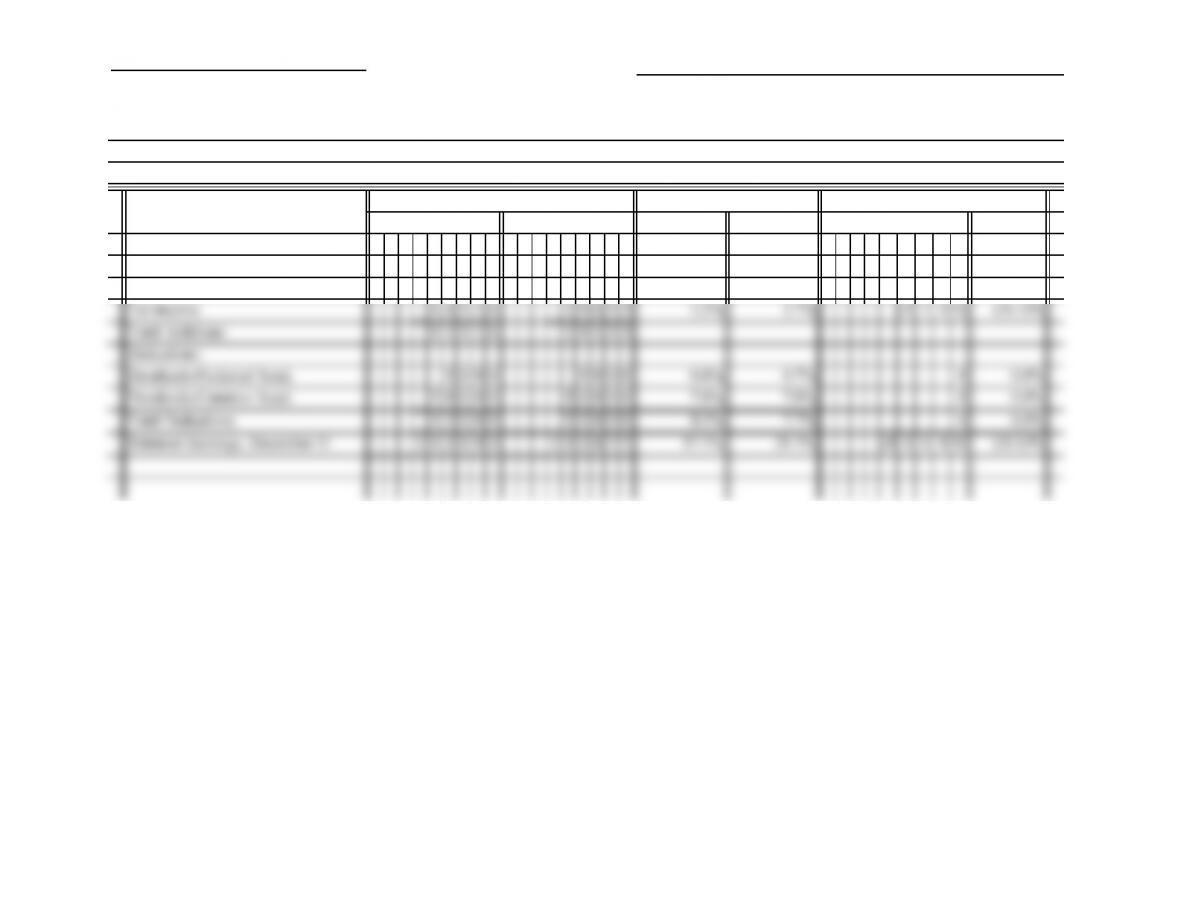
Long-Term Liabilities
10% Bonds Payable, due January 1, 2022 70,000 70,000
Stockholders’ Equity
5% Preferred Stock, $100 par, 1,000 shares authorized/outstanding 100,000 100,000
Common Stock, $1 par, 500,000 shares authorized,
100,000 shares outstanding 100,000 100,000
Retained Earnings
Retained Earnings—Unappropriated 112,193 152,877
Retained Earnings—Appropriated 25,000 25,000
Comparative Balance Sheet (continued)
December 31, 2013 and 2012
HHI Merchandise, Inc.
MINI-PRACTICE SET 4 (continued) Name
2013 2012 PERCENT
Less: Accumulated Depreciation—Building
(4
5000)
(3
0 0 0 0) (7.0)% (4.2)% 1 5 0 0 0 50.0%
Furniture 60000 50000 9.3% 7.0% 1 0 0 0 0 20.0%
Less: Accumulated Depreciation—Furniture
(2
2000)
(1
0 0 0 0) (3.4)% (1.4)% 1 2 0 0 0 120.0%
Total Property, Plant, and Equipment 398000 415000 61.6% 58.0% (1 7 0 0 0) (4.1)%
Other Assets
INCREASE OR (DECREASE)
Assets
HHI Merchandise, Inc.
Comparative Balance Sheet
December 31, 2013 and 2012
ACCOUNT NAME AMOUNTS
AMOUNT
PERCENT OF TOTAL ASSETS
20122013
MINI-PRACTICE SET 4 (continued) Name
2013 2012 PERCENT
Current Liabilities
Accounts Payable 119500 125000 18.5% 17.5% (5 5 0 0) (4.4)%
Notes Payable 45000 60000 7.0% 8.4% (1 5 0 0 0) (25.0)%
Bond Interest Payable 5 0 0 5 0 0 0.1% 0.1% −0−0.0%
PERCENT OF TOTAL ASSETS
INCREASE OR (DECREASE)
2013 2012 AMOUNT
Liabilities and Stockholders’ Equity
HHI Merchandise, Inc.
Comparative Balance Sheet (continued)
December 31, 2013 and 2012
ACCOUNT NAME AMOUNTS
MINI-PRACTICE SET 4 (continued) Name
2013 2012 PERCENT
Stockholders’ Equity
5% Preferred Stock, $100 par, 1,000 shares auth./outstanding 100000 100000 15.5% 14.0% −0−0.0%
2012 AMOUNT
HHI Merchandise, Inc.
Comparative Balance Sheet (continued)
December 31, 2013 and 2012
ACCOUNT NAME AMOUNTS
PERCENT OF TOTAL ASSETS
INCREASE OR (DECREASE)
2013
MINI-PRACTICE SET 4 (continued) Name
EXTRA FORM
2013 2012 PERCENT
Retained Earnings, January 1 152877 188442 23.7% 26.3% (3 5 5 6 5) (18.9)%
Additions:
HHI Merchandise, Inc.
Comparative Statement of Retained Earnings-Unappropriated
Years Ended December 31, 2013 and 2012
ACCOUNT NAME AMOUNTS
2013 2012 AMOUNT
PERCENT OF TOTAL ASSETS
INCREASE OR (DECREASE)
MINI-PRACTICE SET 4 (continued)
INCREASE OR (DECREASE)
2013 2012 PERCENT
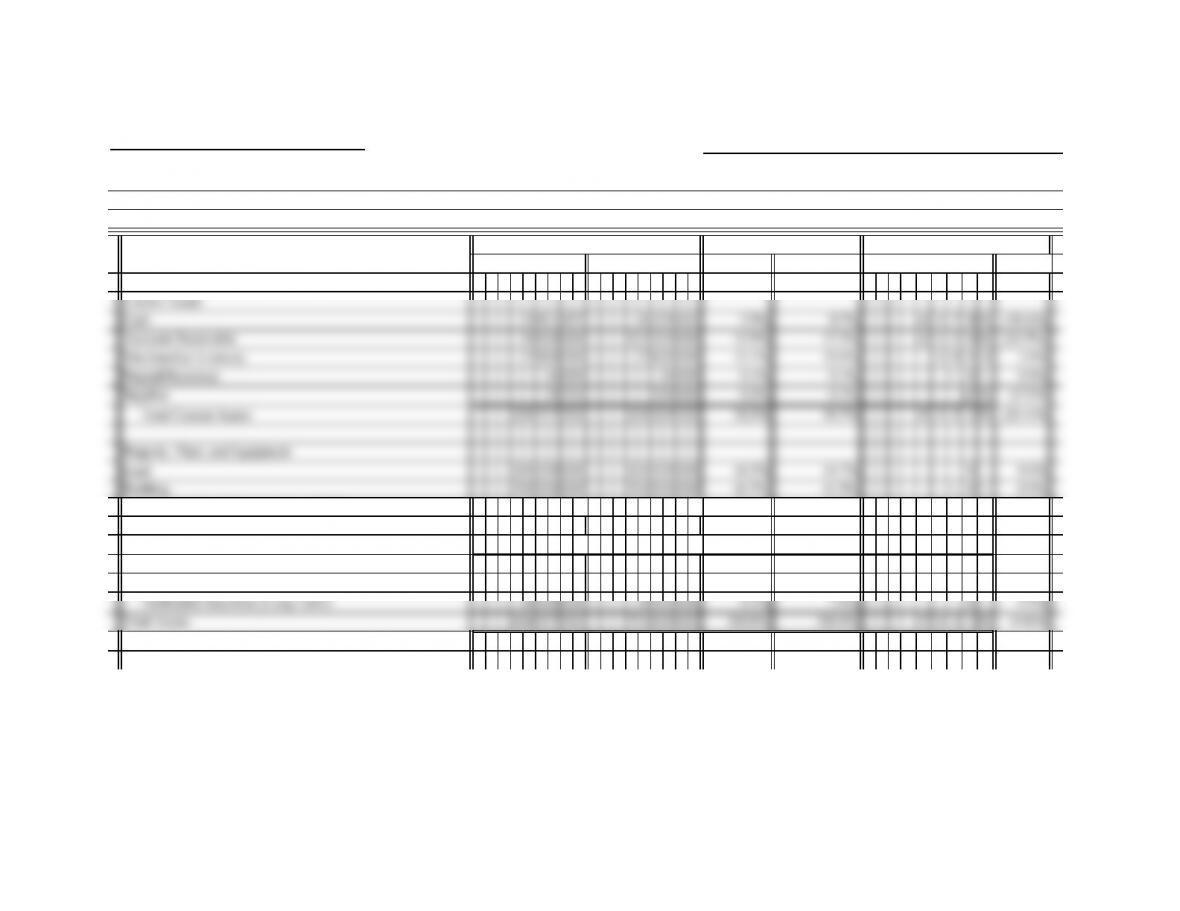
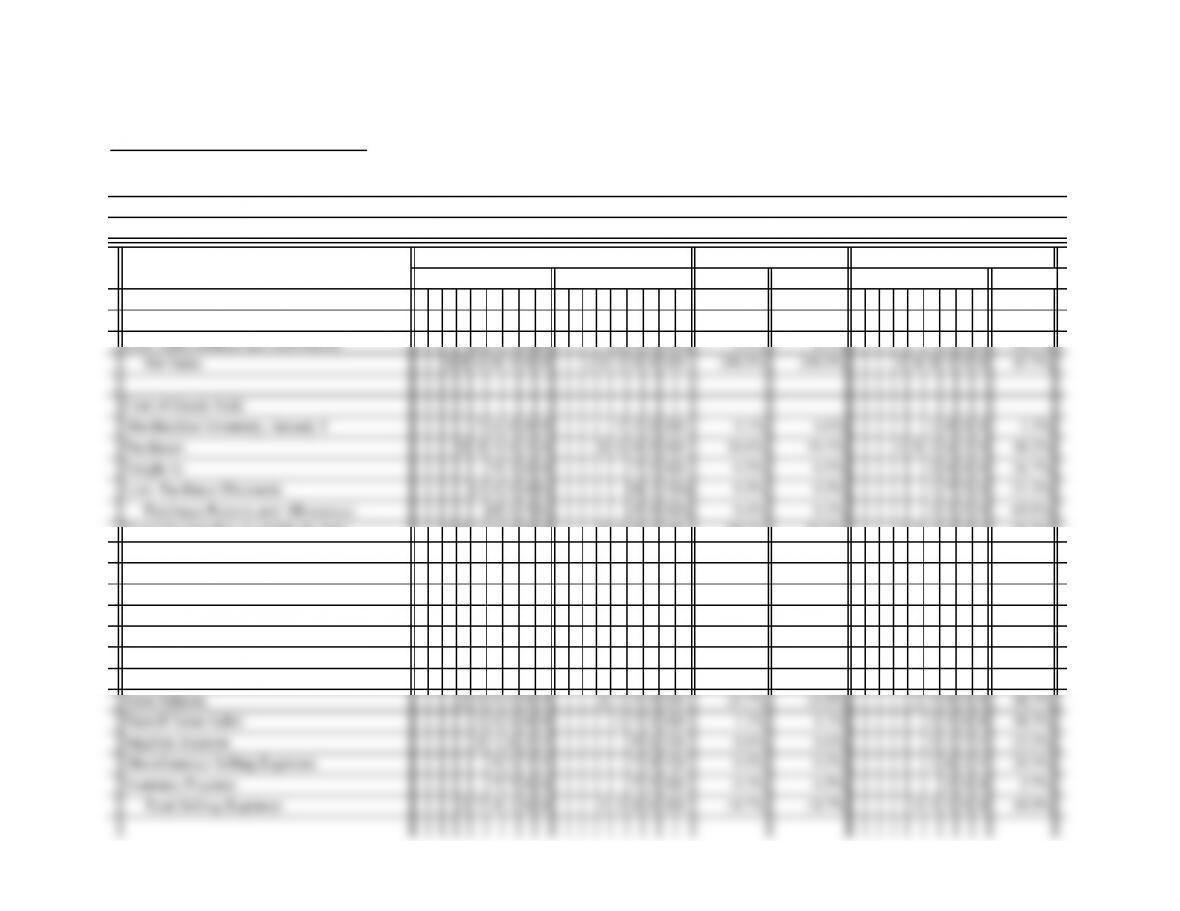
Revenue:
Sales 1 898000 1642000 101.6% 101.4% 256000 15.6%
Less: Sales Returns and Allowances (2 9 5 0 0) (2 2 0 0 0) 1.6% 1.4% 7500 34.1%
Total Merchandise Available for Sale 1 012900 869250 54.2% 53.7% 143650 16.5%
Less Merchandise Inventory, December 31 (7 8 0 0 0) (7 6 0 0 0) 4.2% 4.7% 2000 2.6%
Cost of Goods Sold 934900 793250 50.0% 49.0% 141650 17.9%
Gross Profit on Sales 933600 826750 50.0% 51.0% 106850 12.9%
Operating Expenses:
Selling Expenses
Advertising 25000 21000 1.3% 1.3% 4000 19.0%
HHI Merchandise, Inc.
Comparative Income Statement
Years Ended December 31, 2013 and 2012
ACCOUNT NAME AMOUNTS
2013 2012 AMOUNT
PERCENT OF NET SALES
MINI-PRACTICE SET 4 (continued)
2013 2012 PERCENT
Administrative Expenses
Officers’ Salaries 350000 300000 18.7% 18.5% 50000 16.7%
Office Employees 137500 125000 7.4% 7.7% 12500 10.0%
Payroll Taxes—Office Employees 48750 42500 2.6% 2.6% 6250 14.7%
Utilities Expense 18400 16750 1.0% 1.0% 1650 9.9%
Total Administrative Expenses 628900 549750 33.7% 33.9% 79150 14.4%
Total Operating Expenses 903000 788350 48.3% 48.7% 114650 14.5%
Total Operating Income 30600 38400 1.6% 2.4% (7 8 0 0) (20.3)%
Net Income After Taxes 14316 19435 0.8% 1.2% (5 1 1 9) (23.6)%
HHI Merchandise, Inc.
Comparative Income Statement (continued)
Years Ended December 31, 2013 and 2012
ACCOUNT NAME AMOUNTS
PERCENT OF NET SALES
INCREASE OR (DECREASE)
2013 2012 AMOUNT
MINI-PRACTICE SET 4 (continued)
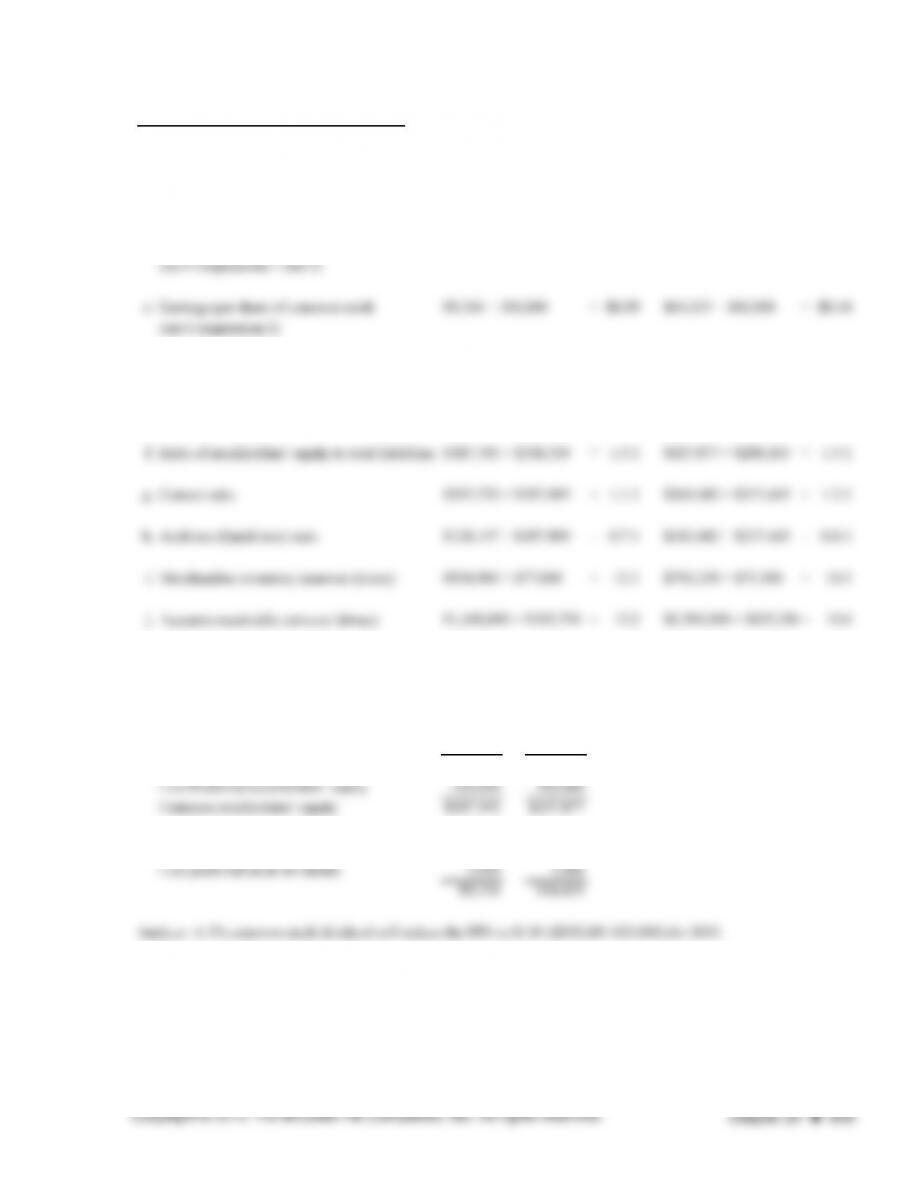
a. Rate of return on net sales = 0.8% $19,435 ÷ $1,620,000 = 1.2%
b. Rate of return on common stockholders’ equity = 3.2% $14,435 ÷ $327,877 = 4.4%
d. Price-earnings ratio = 33.3:1 $4.00 ÷ $0.14 =
28.6:1
e. Rate of return on total assets = 5.5% $42,900 ÷ $716,042 = 6.0%
2013RATIO 2012
$14,316 ÷ $1,868,000
$9,316 ÷ $287,193
3.00 ÷ $0.09
$35,275 ÷ $645,732


