PROBLEM 23.1B
1.
2013 2012 PERCENT*
Revenue
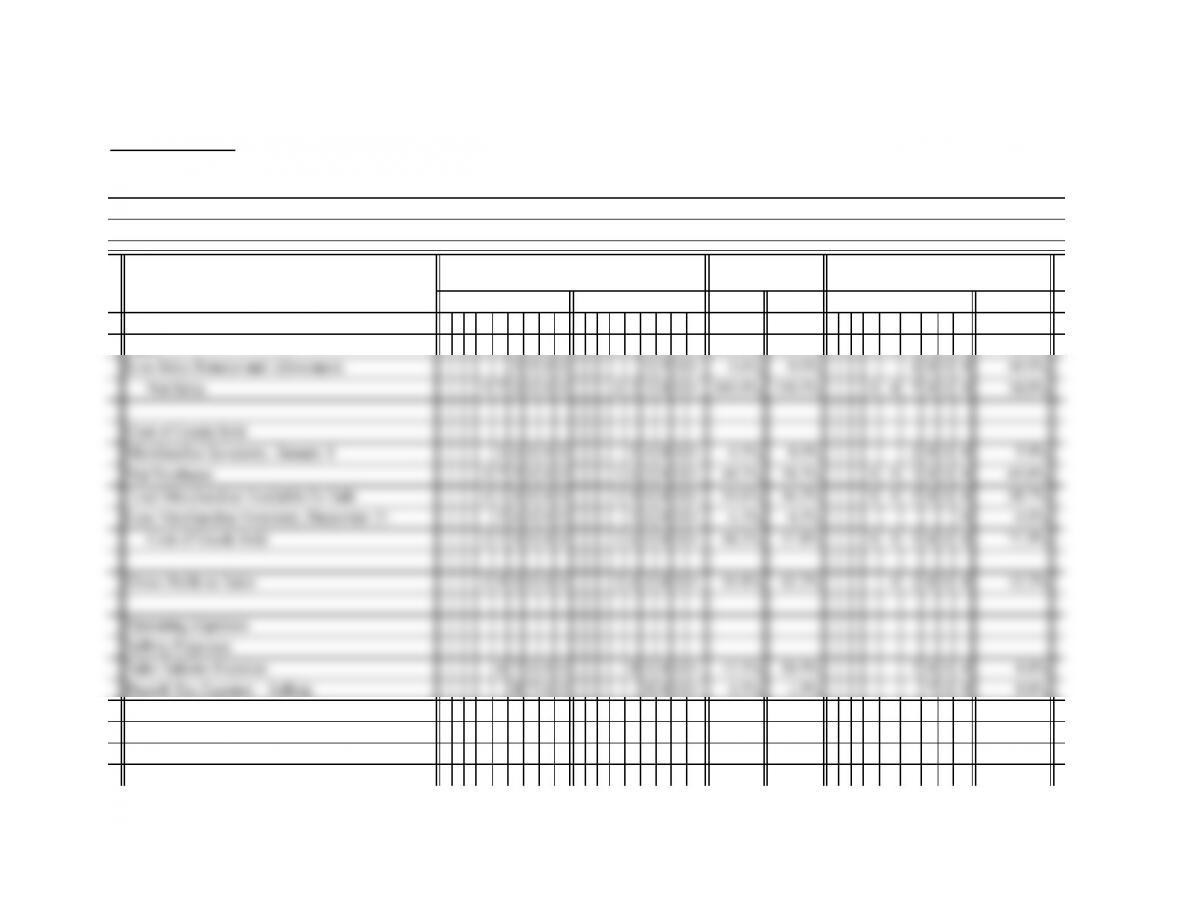
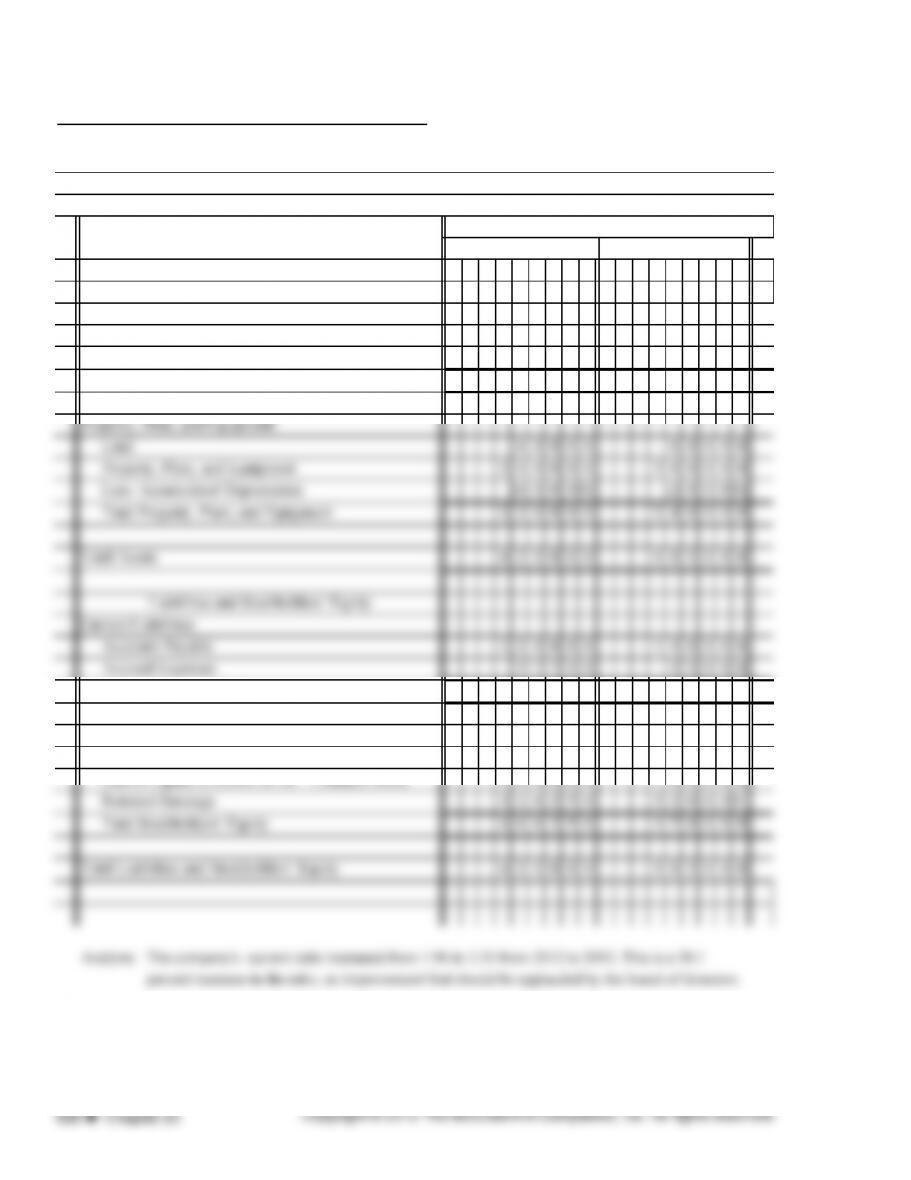
Sales 573500 425500 100.6% 100.6% 1 4 8 0 0 0 34.8%
Other Selling Expenses 24000 18000 4.2% 4.3% 6 0 0 0 33.3%
Total Selling Expenses 119700 106000 21.0% 25.1% 1 3 7 0 0 12.9%
*Rounded
INCREASE OR (DECREASE)
Best Sales, Inc.
Comparative Income Statement
For Years Ended December 31, 2013 and 2012
AMOUNTS
PERCENT OF
NET SALES*
2013 2012 AMOUNT
PROBLEM 23.1B (continued)
1.
2013 2012 PERCENT
General and Administrative Expenses
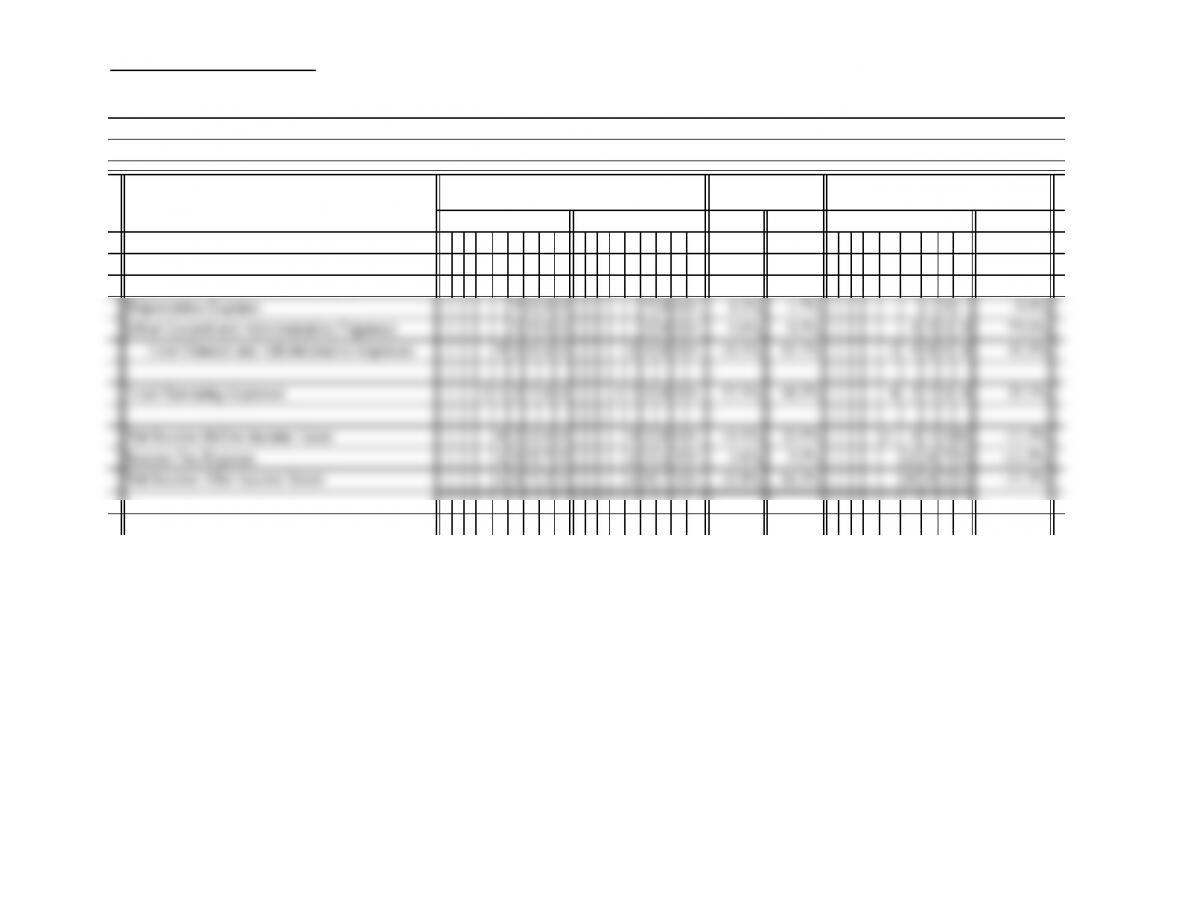
Officers Salaries Expense 75000 50000 13.2% 11.8% 2 5 0 0 0 50.0%
Payroll Tax Expense—Administrative 7500 5000 1.3% 1.2% 2 5 0 0 50.0%
Best Sales, Inc.
Comparative Income Statement (continued)
For Years Ended December 31, 2013 and 2012
ACCOUNT NAME
AMOUNTS
PERCENT OF
NET SALES* INCREASE OR (DECREASE)
2013 2012 AMOUNT
PROBLEM 23.1B (continued)
1.
2013 2012 PERCENT
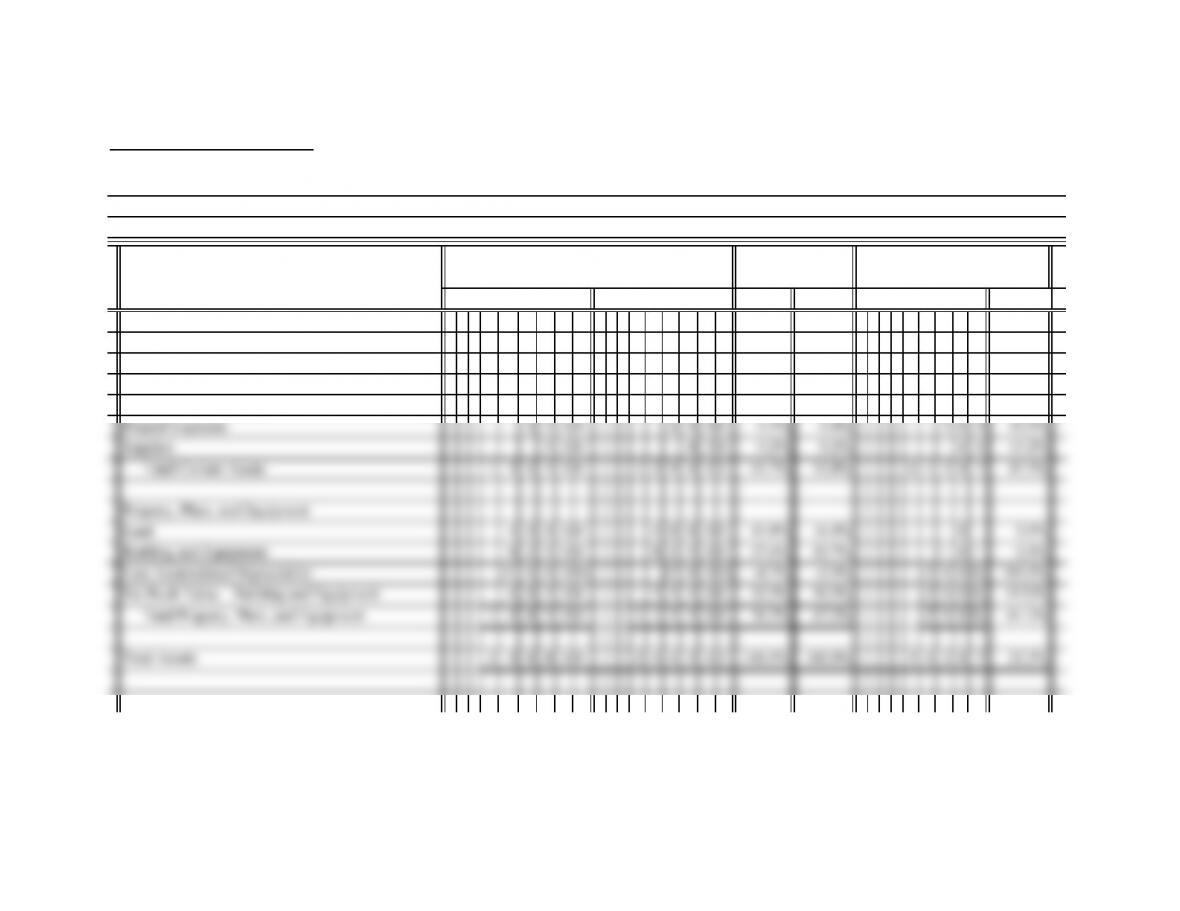
Current Assets
Cash 88375 56579 29.6% 23.1% 3 1 7 9 6 56.2%
Accounts Receivable 63925 35000 21.4% 14.3% 2 8 9 2 5 82.6%
Merchandise Inventory 36000 36000 12.0% 14.7% 0 0.0%
AMOUNTS INCREASE OR (DECREASE)
AMOUNT2012
Assets
Best Sales, Inc.
Comparative Balance Sheet
For Years Ended December 31, 2013 and 2012
PERCENT OF
TOTAL ASSETS*
2013
PROBLEM 23.1B (continued)
INCREASE OR (DECREASE)
2013 2012 PERCENT*
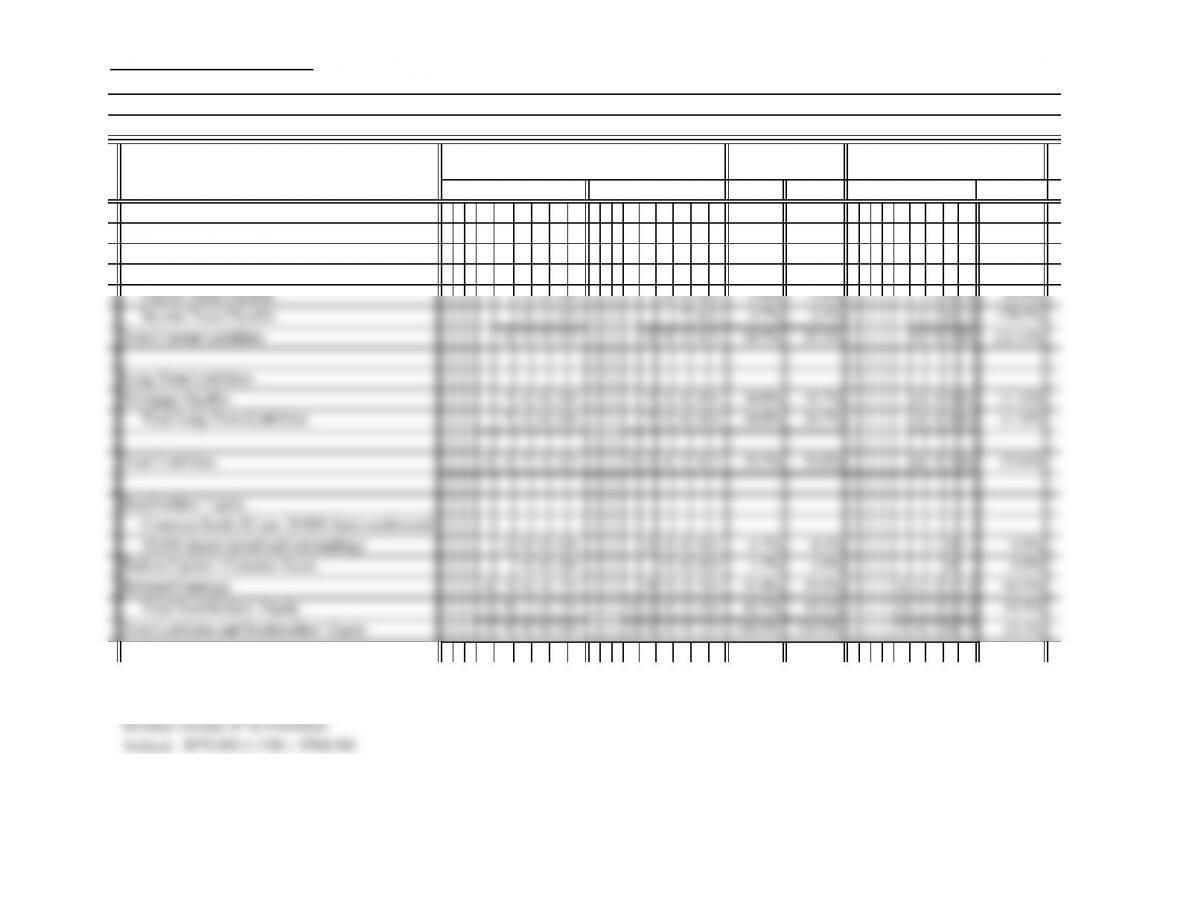
Current Liabilities
Accounts Payable 38000 45000 12.7% 18.4% (7 0 0 0) (15.6)%
Sales Tax Payable 2 0 0 0 2 5 0 0 0.7% 1.0% (5 0 0) (20.0)%
*Rounded
2.
From the Balance Sheet, you should be concerned about the large increase in Accounts Receivable. From the Income Statement, you should investigate
Best Sales, Inc.
Liabilities and Stockholders’ Equity
Comparative Balance Sheet (continued)
December 31, 2013 and 2012
AMOUNTS
PERCENT OF NET
ASSETS*
2013 2012 AMOUNT

PROBLEM 23.2B
1. Current assets
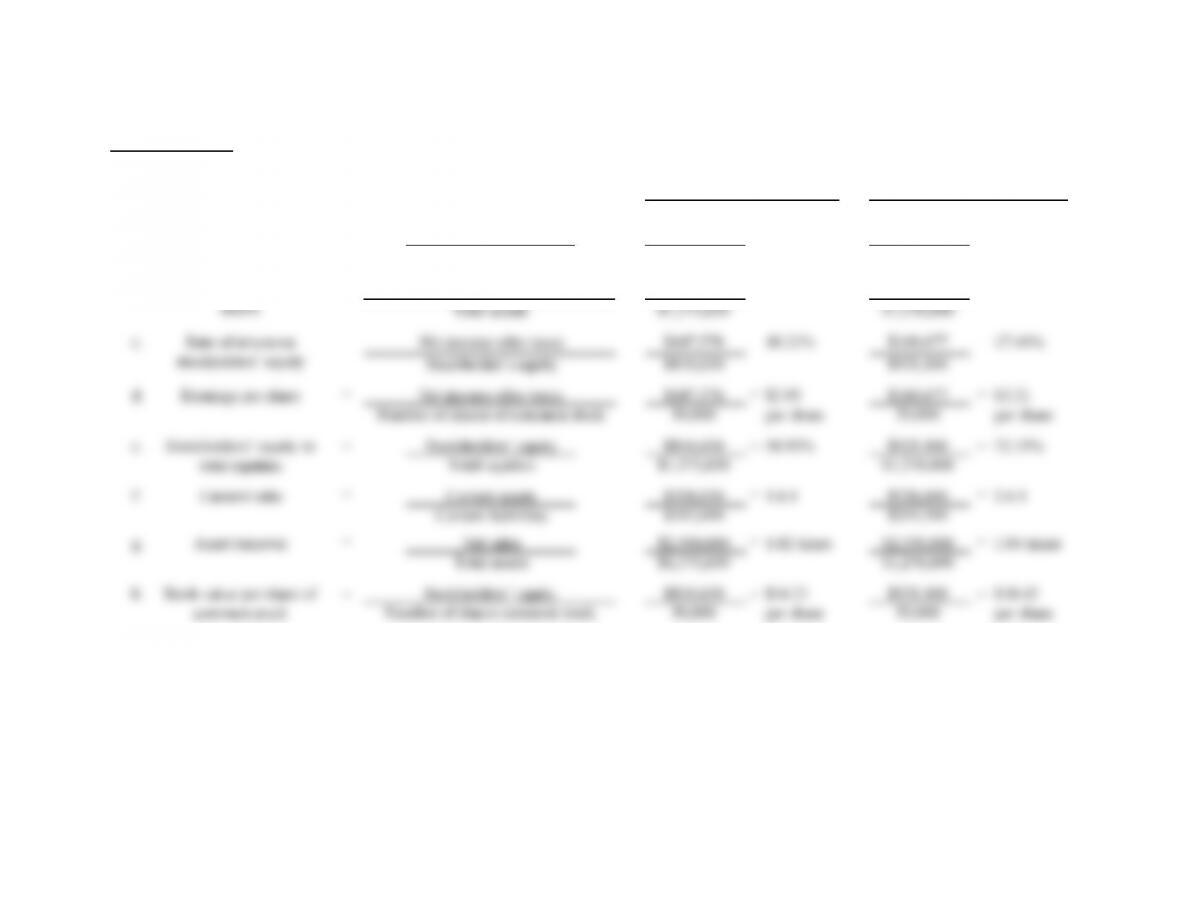
3.
10.
Market value
$160,000 = 4.6
=
2013 2012
4.4:1 $129,013 = 2.6:1Current ratio = $190,300 =
Inventory turnover = $275,000
Cost of goods sold
($34,000 + $36,000) ÷ 2($36,000 + $36,000) ÷ 2
Average merchandise inventory
7.6
Ratio of return on ending
stockholders’ equity
= $61,725 =
$181,475
Ending stockholders’ equity
Net income after taxes
= 58.0%
$120,250
34.0% $69,750
$1.50
$2.50
PART I
PROBLEM 23.2B (continued)
PART II
1. Even though the rate of return decreased in 2013 it remains above the industry average.
PROBLEM 23.3B
1. a. Net income after taxes $147,576 $160,677
Sales $2,500,000 $2,350,000
b. $248,600 $268,450
XYZ Corp.
= 6.84%Rate of return on sales = = 5.90%
ABC Corp.
= 21.03%Rate of return on total
= = 18.07%Net income before taxes and interest
PROBLEM 23.3B (continued)
2.
3.
ABC Corp. XYZ Corp.
Both companies have similar current earnings records. The XYZ Corp. has a slightly better
XYZ Corp. has slightly better ratios than ABC Corp., although both companies appear to be
financially sound. ABC’s debt might make it slightly more risky than XYZ.
be required. XYZ Corp. is probably a little better able to handle the additional debt.
826 Chapter 23 Copyright © 2012 The McGraw-Hill Companies, Inc. All rights reserved.
CRITICAL THINKING PROBLEM 23.1
Operating Expenses
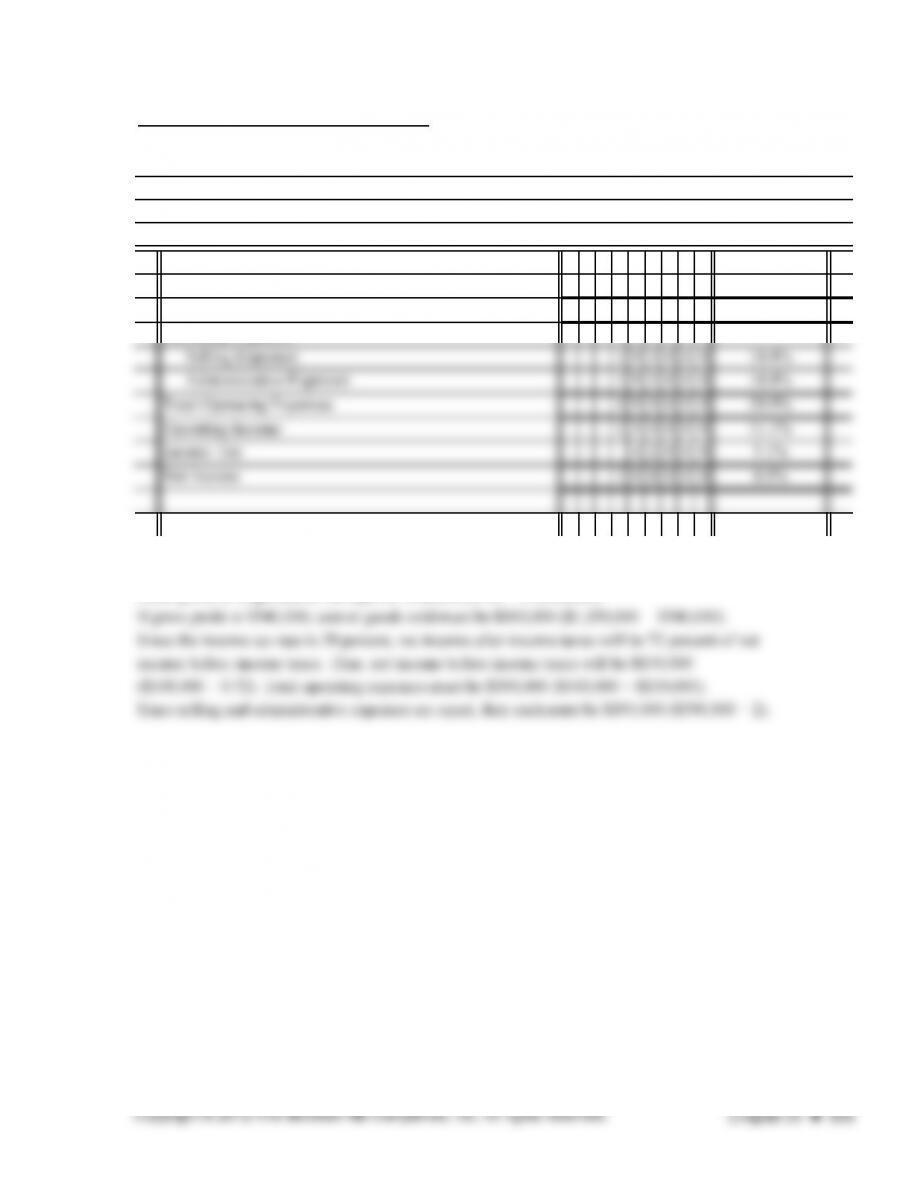
Selling Expenses 405000 292000
General and Administrative Expenses 345000 240000
Total Operating Expenses 750000 532000
AMOUNTS
2013
Produce Sales Company
Comparative Income Statement
For Years Ending December 31, 2013 and 2012
2012
CRITICAL THINKING PROBLEM 23.1 (continued)
Current Assets
Cash 175000 90000
Accounts Receivable 120000 100000
Merchandise Inventory 110000 75000
Total Current Assets 405000 265000
Total Current Liabilities 158750 135000
Stockholders’ Equity
Common Stock ($10 par, 10,000 shares authorized) 50000 50000
Paid in Capital in Excess of Par—Common Stock 100000 100000
Assets
Produce Sales Company
Comparative Balance Sheet
December 31, 2013 and 2012
AMOUNTS
2013 2012
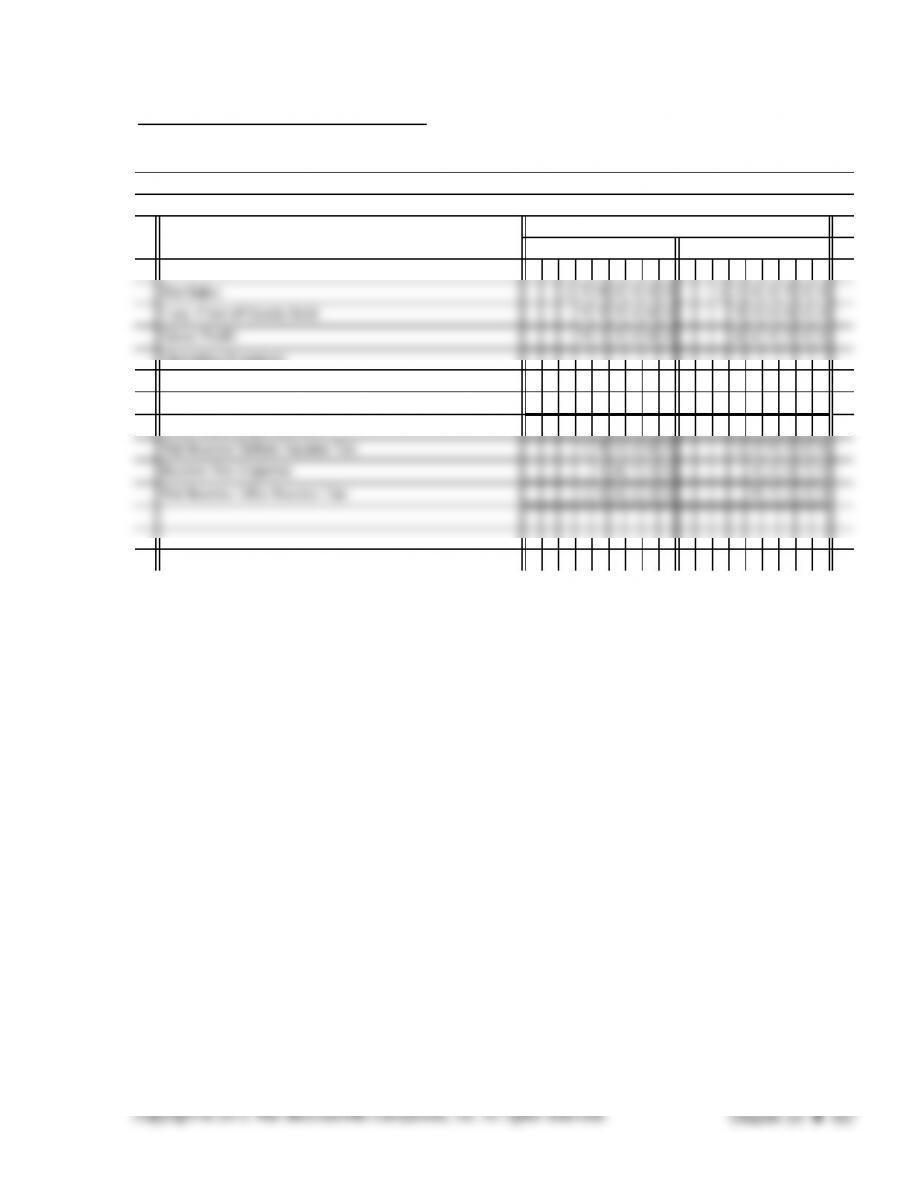
CRITICAL THINKING PROBLEM 23.2
Net Sales 1350000
Cost of Goods Sold 810000
Gross Profit 540000
Operating Expenses
Net Income is 8 percent of net sales; therefore sales is $1,350,000 ($108,000 ÷ 0.08).
Gross profit is 40 percent of net sales or $540,000 (0.40 × $1,350,000).
Safety Incorporated
100.0%
60.0%
40.0%
Condensed Income Statement
For the Year Ended December 31, 2013
SOLUTIONS TO BUSINESS CONNECTIONS
Managerial Focus:
2. The trend indicates that more is being paid for cost of goods. Investigate supplier prices and
3. Evaluate collection policies, credit-granting procedures, and sales activity.
5. Comparison of item percentages with industry averages, examine pricing policies and purchasing
procedures, analysis of operating expenses.
Ethical Dilemma:
Financial Statement Analysis:
1. 66.1% ($43,764/$66,176). Since Home Depot’s cost of goods sold is almost 4 percentage points
Teamwork:
Internet Connection:
This is definitely not ethical. Adjusting entries should be made on a timely basis without regard to any
Although Ling is more profitable (28.5% Income to Sales), Javier has more liquidity. Ling has higher
debt than Javier. Javier would be more likely to pay off the loan than Ling.
Part A True-False
2. TRUE
4. TRUE
6. FALSE
8. FALSE
10. FALSE
12. FALSE
14. TRUE
15. FALSE
Part B Matching
1. b, d
3. i, j
5. i
SOLUTIONS TO PRACTICE TEST