Unlock document.
This document is partially blurred.
Unlock all pages and 1 million more documents.
Get Access
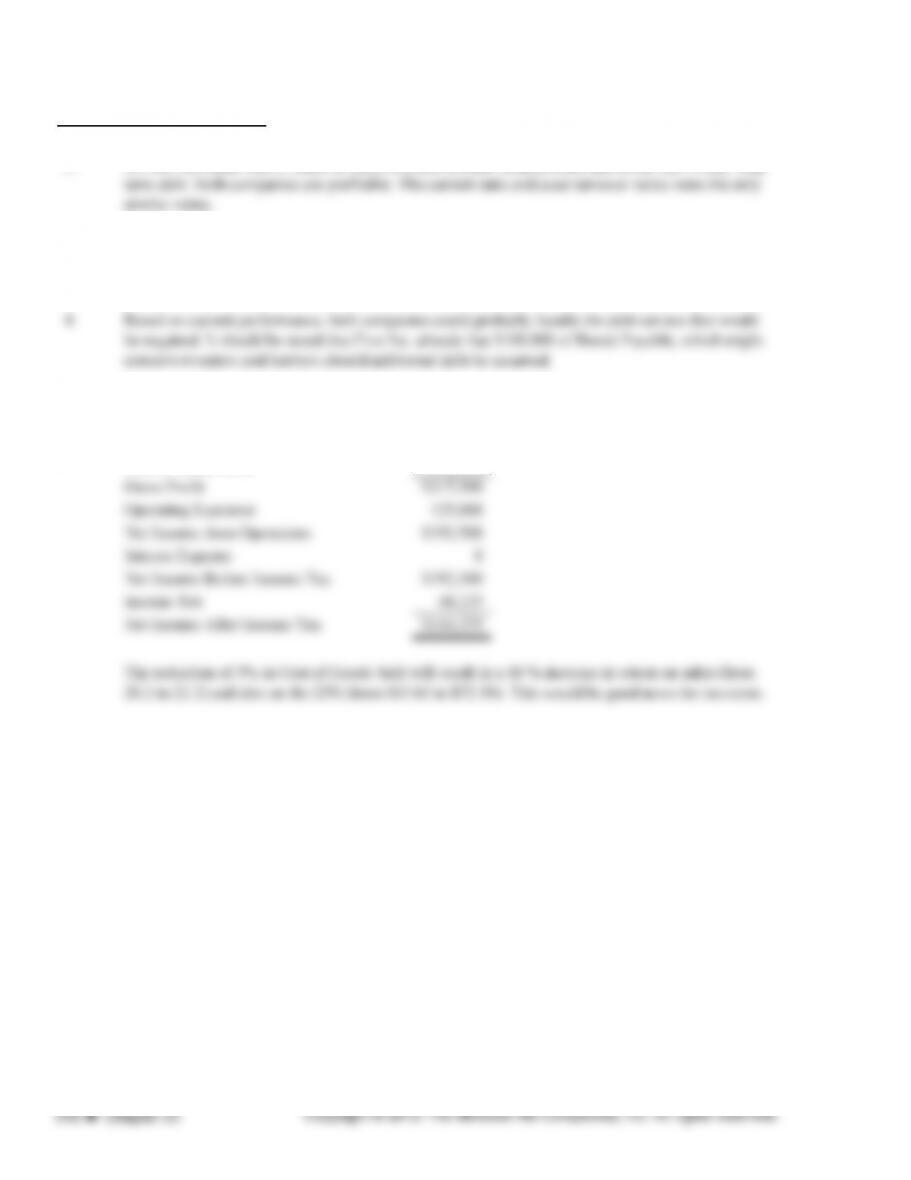
• Teva Pharmaceutical is among the top 15 pharmaceutical companies in the world and the leader in
generic pharmaceuticals.
• Trend analysis. Analyze net income, cost of goods sold, and gross profit. Compare the percentage
of gross profit to sales for the five-year period.
1. Comparison of each Income Statement item with net sales for the period.
3. Yes. Increasing both figures by 12 percent will cause gross profit to also increase by 12 percent,
the same percentage increase as sales.
5. Total assets (or total equities).
7. Measures profitability of stockholders’ investment in the company.
9. Acid test ratio uses only cash and near cash items as the numerator, whereas current ratio uses all
current assets.
11. Measures effectiveness of the credit and collection function.
These questions are designed to check students’ understanding of new terms, concepts, and procedures
presented in the chapter.
Discussion Questions
CHAPTER 23
FINANCIAL STATEMENT ANALYSIS
Chapter Opener: Thinking Critically
Answers will vary, though should include references to the price to earnings ratio and the current ratio as
key financial ratios that indicate a company’s financial health.
Fast Facts
Managerial Implications: Thinking Critically
EXERCISE 23.1
EXERCISE 23.2
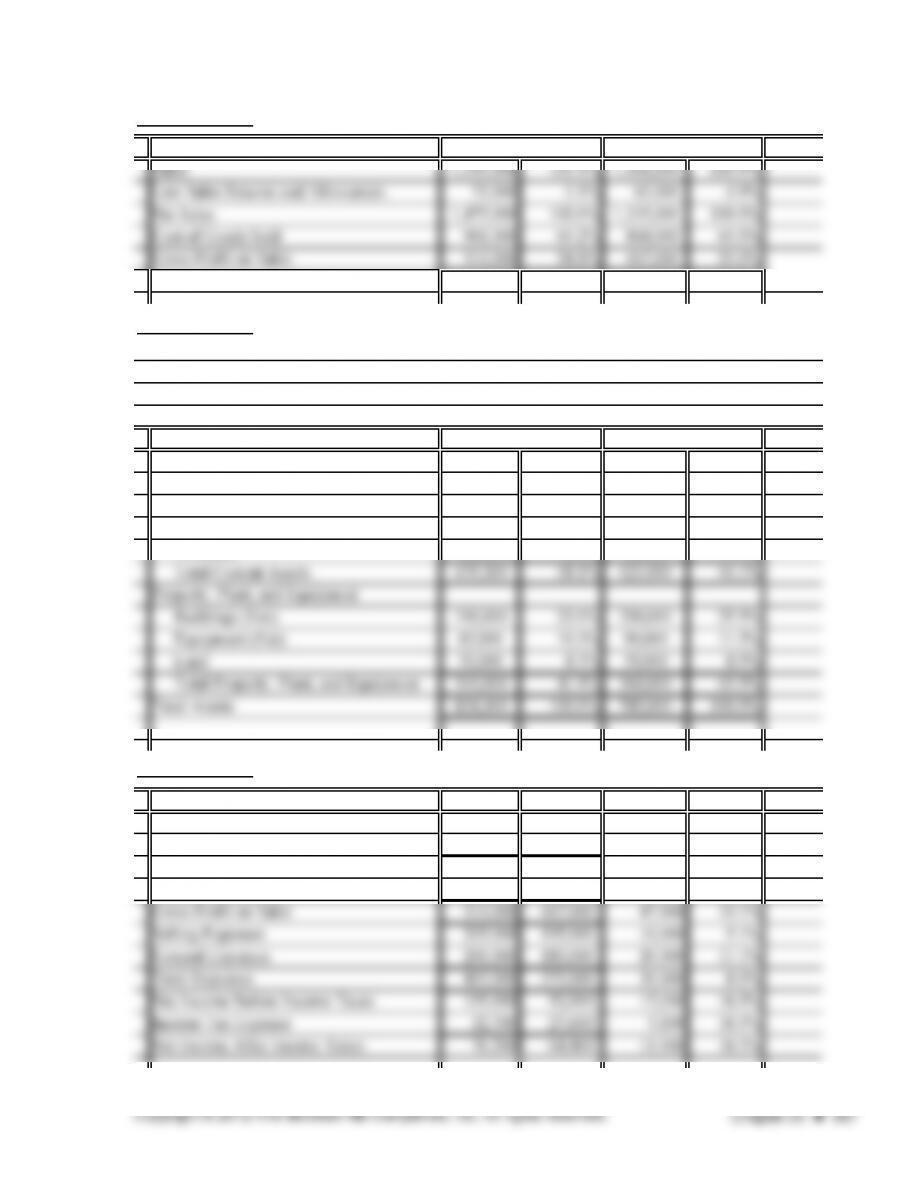
Current Assets
Cash 165,300 20.1% 160,000 20.4%
Accounts Receivable (Net) 194,000 23.5% 175,000 22.3%
Inventory 120,000 14.6% 90,000 11.5%
EXERCISE 23.3
2013 2012 Change Percent
Sales 1,550,000 1,400,000 150,000 10.7%
Less Sales Returns and Allowances 75,000 65,000 10,000 15.4%
Net Sales 1,475,000 1,335,000 140,000 10.5%
Cost of Goods Sold 961,000 868,000 93,000 10.7%
2013 2012
Assets
Orlando, Inc.
Comparative Balance Sheet
2013 2012
December 31, 2013 and 2012
EXERCISE 23.4
2013 2012 Difference Percent
Current Assets 165,300 160,000 5,300 3.3%
Cash 194,000 175,000 19,000 10.9%
Accounts Receivable (Net) 120,000 90,000 30,000 33.3%
Inventory 479,300 425,000 54,300 12.8%
Total Current Assets
Property, Plant, and Equipment
Liabilities
Current Liabilities
Accounts Payable 140,000 165,000 (25,000) -15.2%
Other Current Liabilities 30,000 42,000 (12,000) -28.6%
Total Current Liabilities 170,000 207,000 (37,000) -17.9%
Long-Term Liabilities
Total Liabilities and Stockholders’ Equity 824,300 785,000 39,300 5.0%
Orlando, Inc.
Comparative Balance Sheet
December 31, 2013 and 2012
Assets
Liabilities and Stockholders’ Equity
EXERCISE 23.5
2013 2012
$76,300 $64,400
Net Sales $1,475,000 $1,335,000
5.2% 4.8%
EXERCISE 23.6
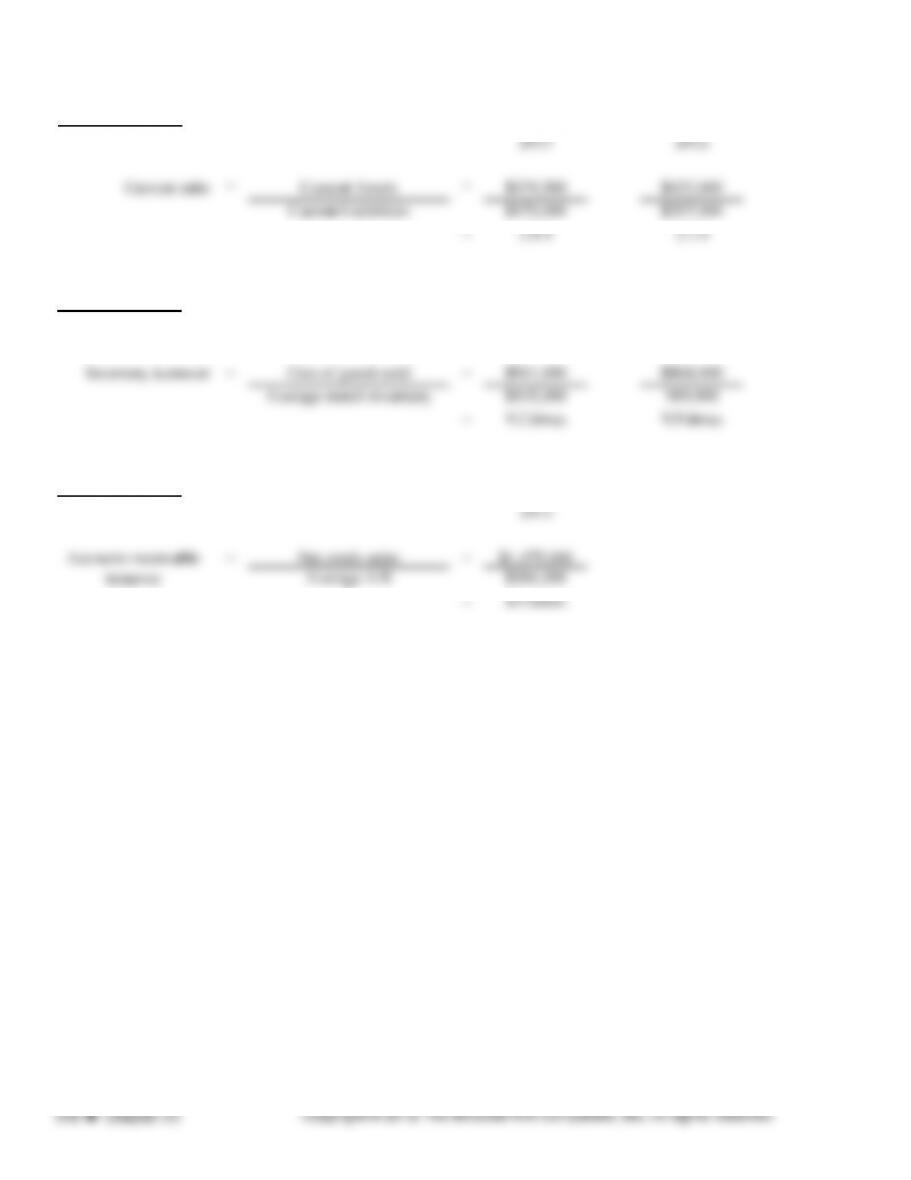
Rate of Return on Sales = Net Income After Taxes
=
=
EXERCISE 23.10
EXERCISE 23.11
2013 2012
EXERCISE 23.12
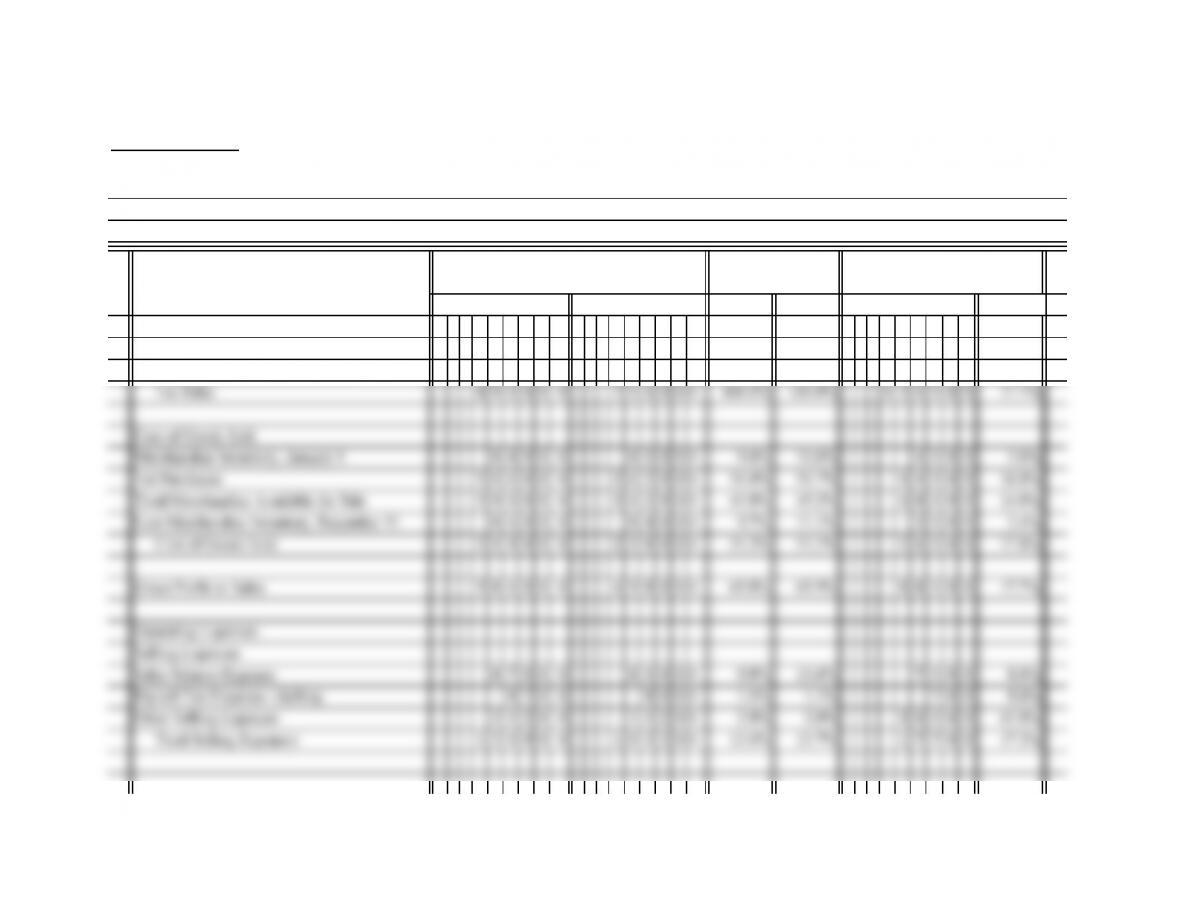
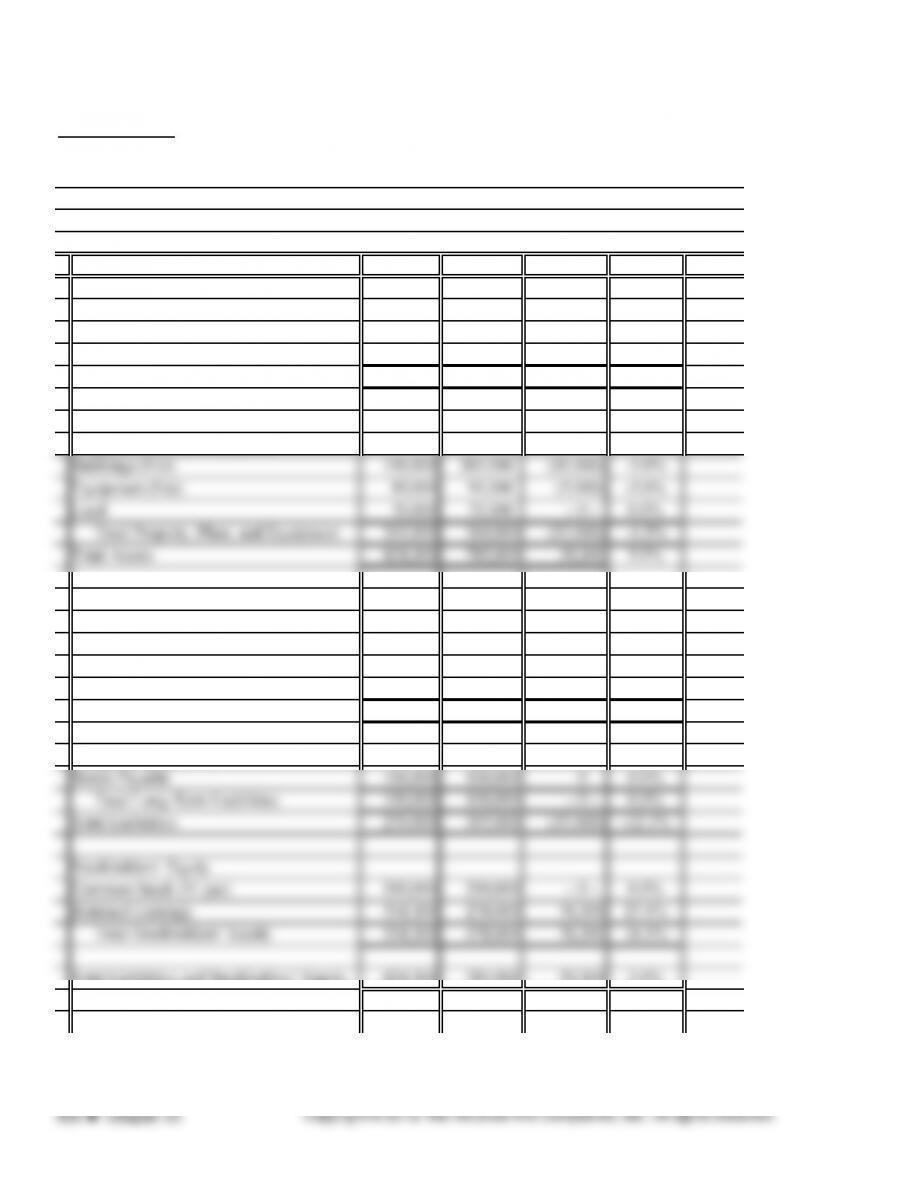
PROBLEM 23.1A
1.
2013 2012 PERCENT
Revenue
Sales 90500 0 765000 101.7% 101.2% 1 4 0 0 0 0 18.3%
Less Sales Returns and Allowances 1500 0 9000 1.7% 1.2% 6 0 0 0 66.7%
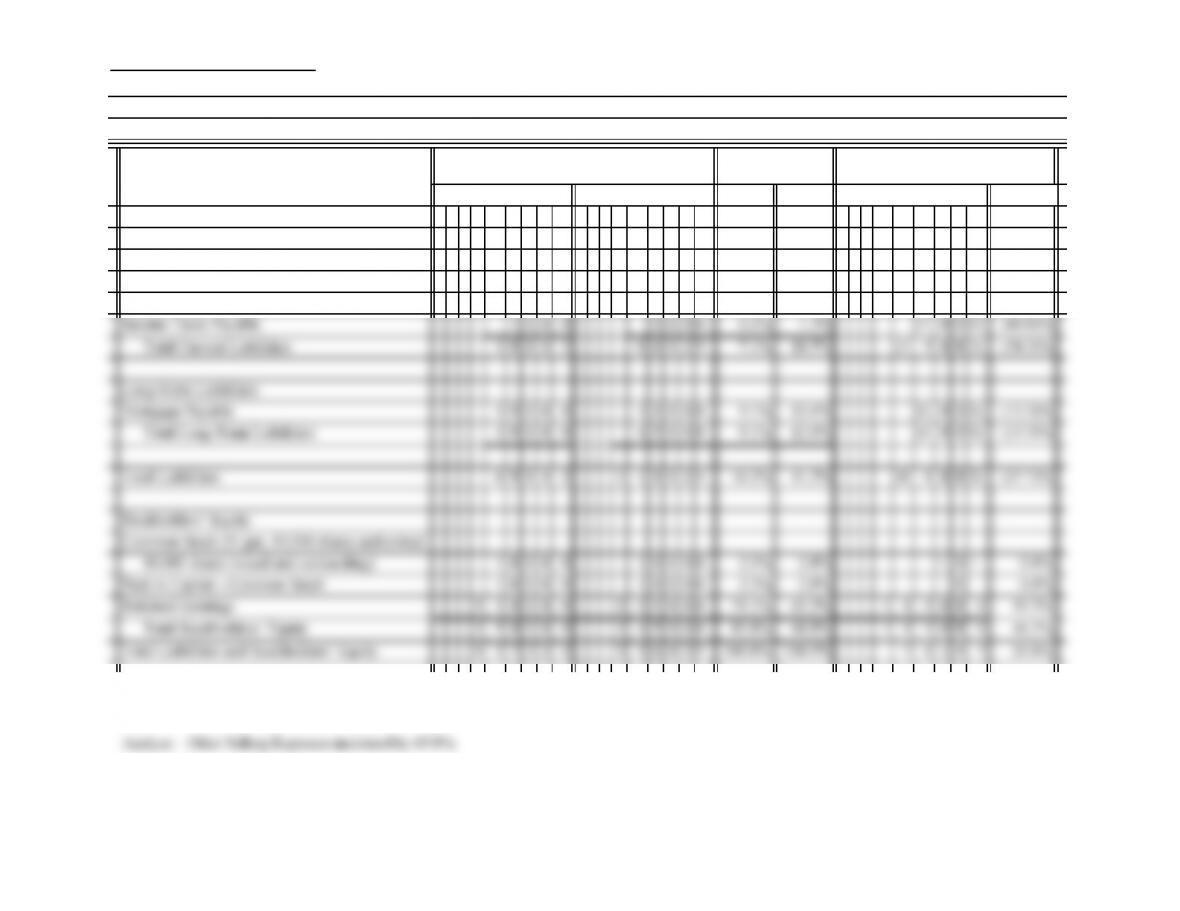
The LACAL Company
Comparative Income Statement
For Years Ended December 31, 2013 and 2012
ACCOUNT NAME
AMOUNTS
PERCENT OF NET
SALES INCREASE OR (DECREASE)
2013 2012 AMOUNT
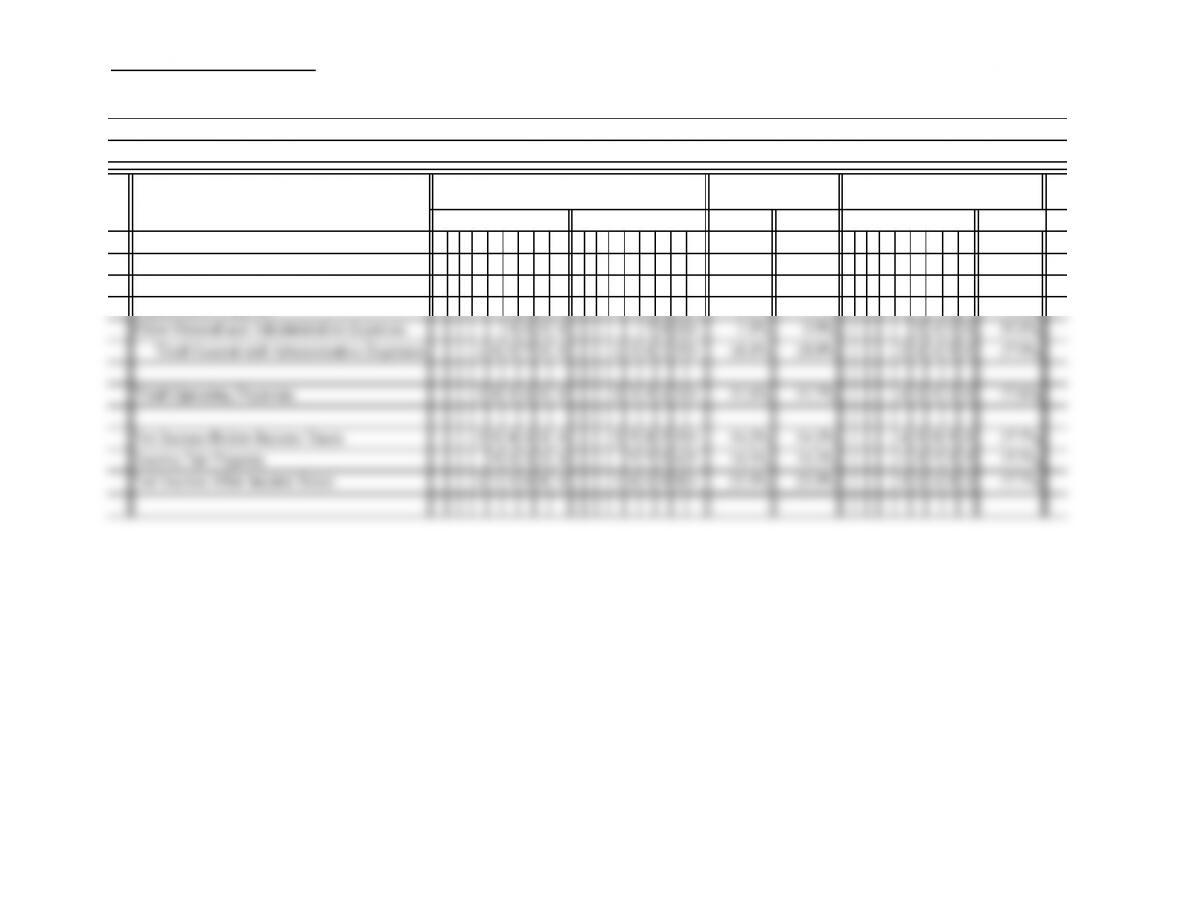
PROBLEM 23.1A (continued)
2013 2012 PERCENT
General and Administrative Expenses
Officers Salaries Expense 13000 0 110000 14.6% 14.6% 2 0 0 0 0 18.2%
Payroll Tax Expense—Administrative 1300 0 11000 1.5% 1.5% 2 0 0 0 18.2%
Depreciation Expense 8 2 5 0 8 2 5 0 0.9% 1.1% −0−0.0%
The LACAL Company
Comparative Income Statement (continued)
For Years Ended December 31, 2013 and 2012
ACCOUNT NAME
AMOUNTS
PERCENT OF NET
SALES INCREASE OR (DECREASE)
2013 2012 AMOUNT
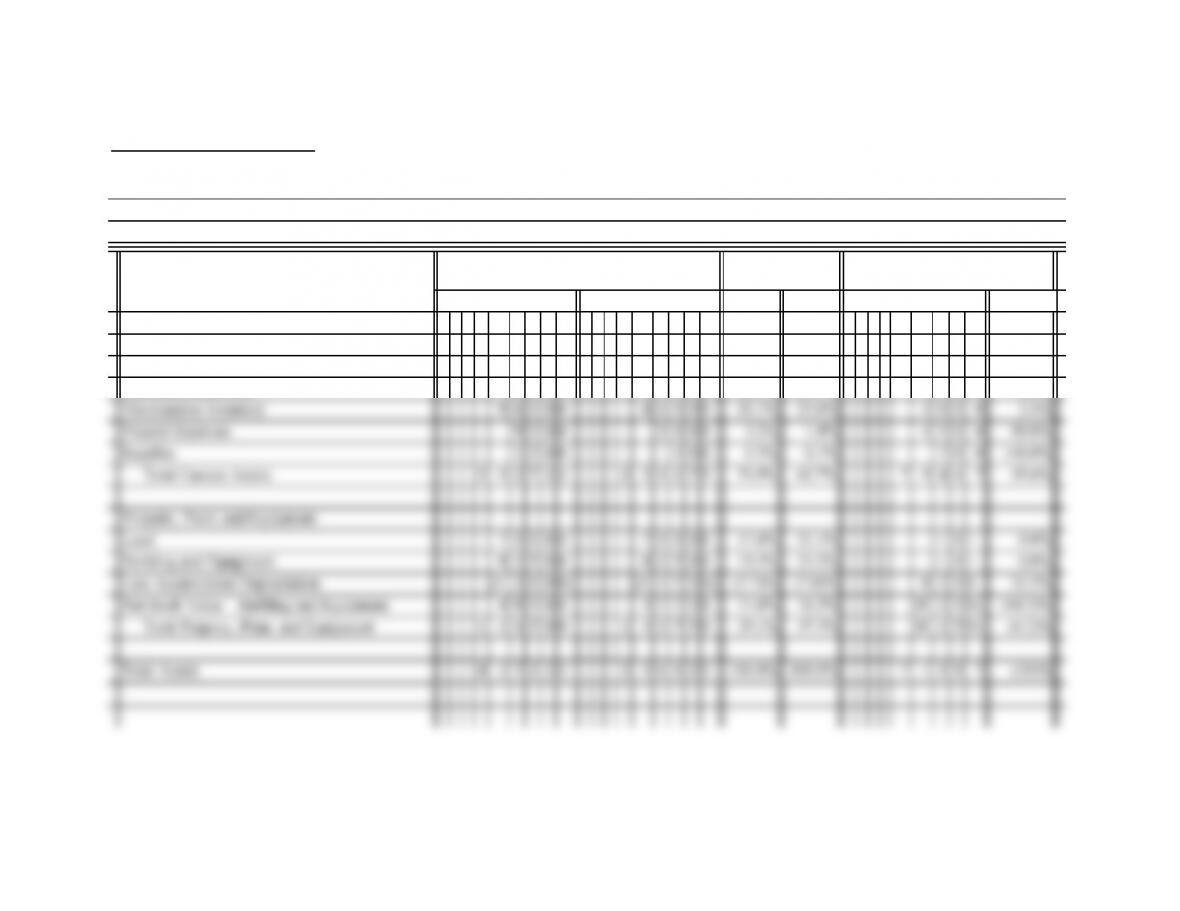
PROBLEM 23.1A (continued)
2013 2012 PERCENT
Current Assets
Cash 1 11022 46275 26.0% 13.0% 6 4 7 4 7 139.9%
Accounts Receivable 95000 87500 22.2% 24.6% 7 5 0 0 8.6%
Assets
PERCENT OF
TOTAL ASSETS INCREASE OR (DECREASE)
2013 2012 AMOUNT
THE LACAL COMPANY
Comparative Balance Sheet
December 31, 2013 and 2012
AMOUNTS
PROBLEM 23.1A (continued)
2013 2012 PERCENT
Current Liabilities
Accounts Payable 2700 0 57000 6.3% 16.0% (3 0 0 0 0) (52.6)%
Sales Tax Payable 1 0 0 0 3 0 0 0 0.2% 0.8% (2 0 0 0) (66.7)%
Payroll Taxes Payable 1 1 4 2 1 0 2 5 0.3% 0.3% 1 1 7 11.4%
AMOUNT
Liabilities and Stockholders’ Equity
THE LACAL COMPANY
Comparative Balance Sheet (continued)
December 31, 2013 and 2012
AMOUNTS
PERCENT OF
TOTAL ASSETS INCREASE OR (DECREASE)
2013 2012
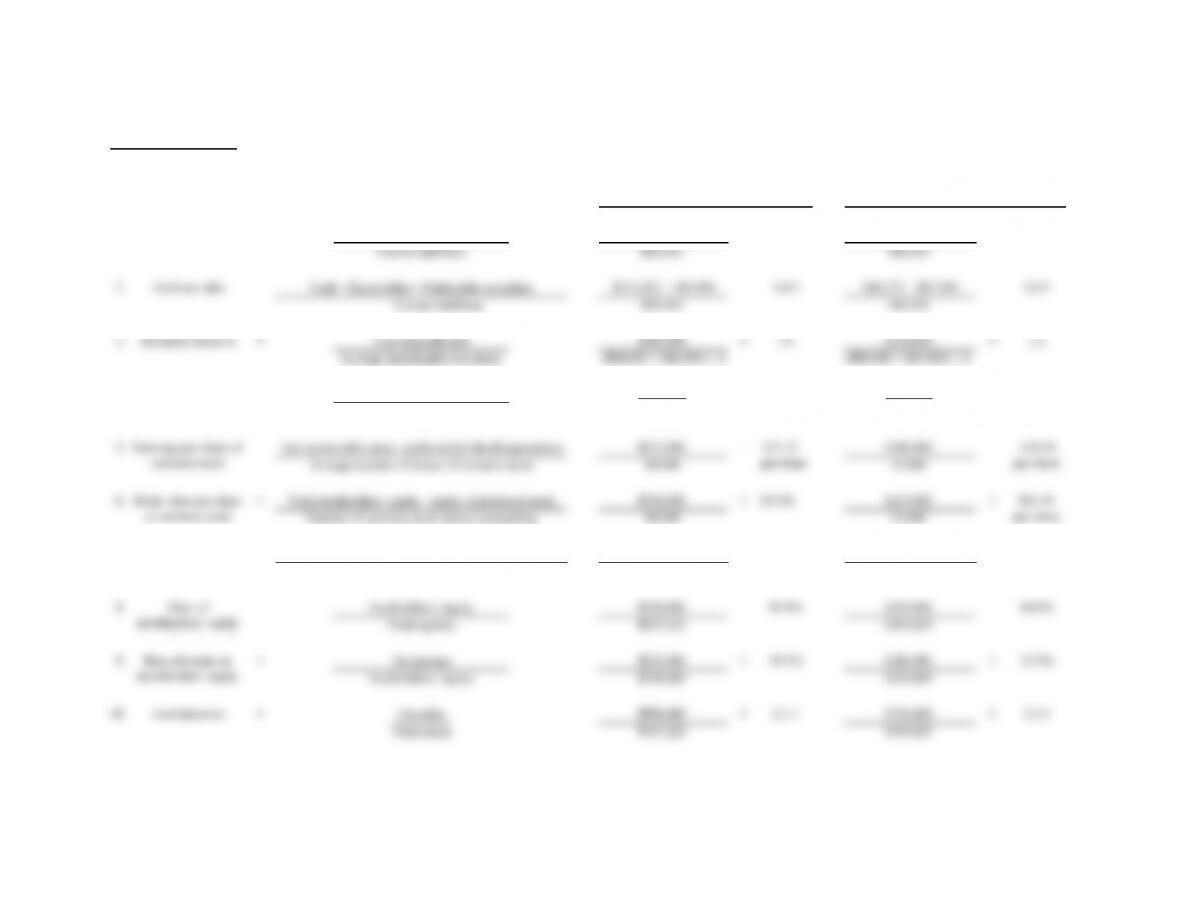
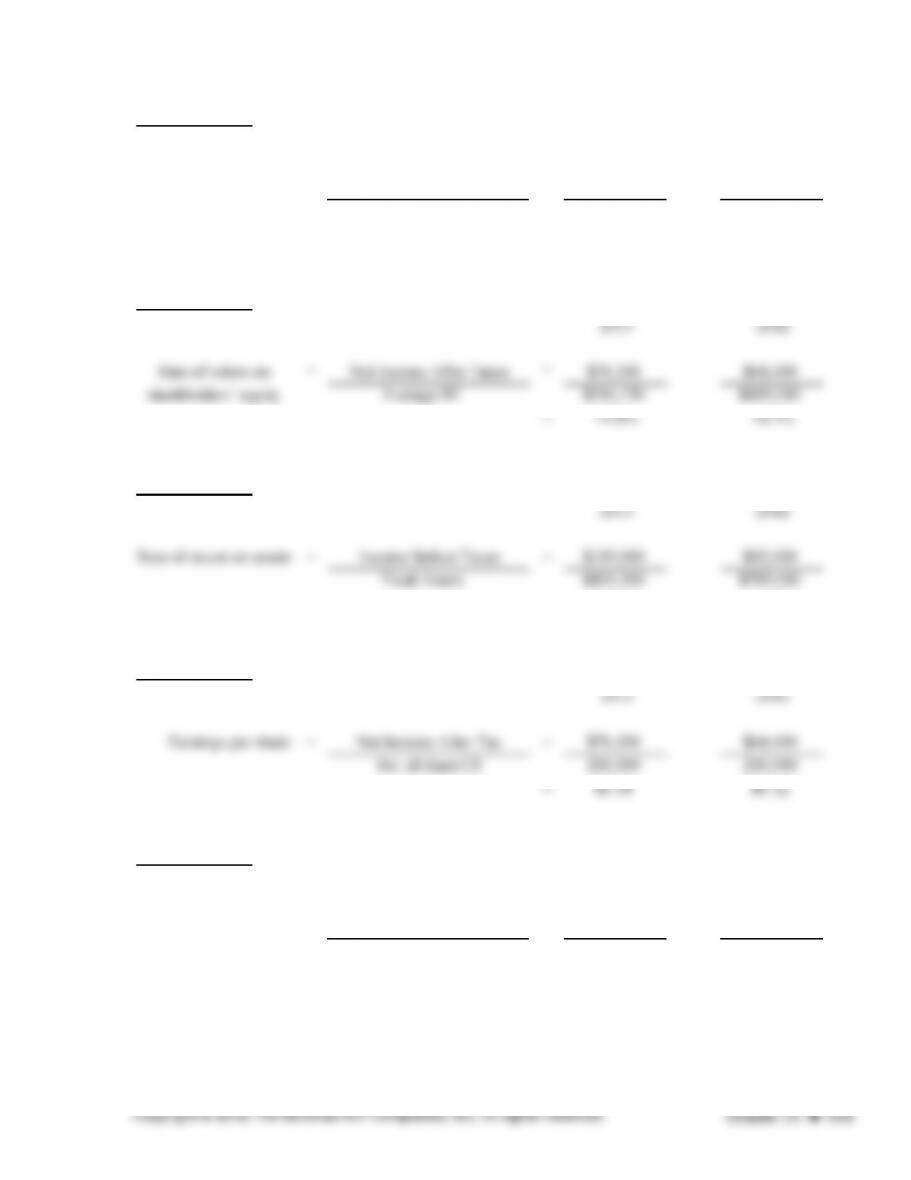
PROBLEM 23.2A
PART I
Current assets
Net income after taxes
Net sales
7.
2013 2012
72.6%=
$427,222 $356,025
= 71.3% $258,550$304,400
Return on total
assets
= Net Income before interest and taxes
Total assets
4. Return on sales =
$213,080
$890,000
= 23.9% $180,985 = 23.9%
$756,000
10.0:1
3.4:1
$223,275 =
1. Current ratio = $302,722 =
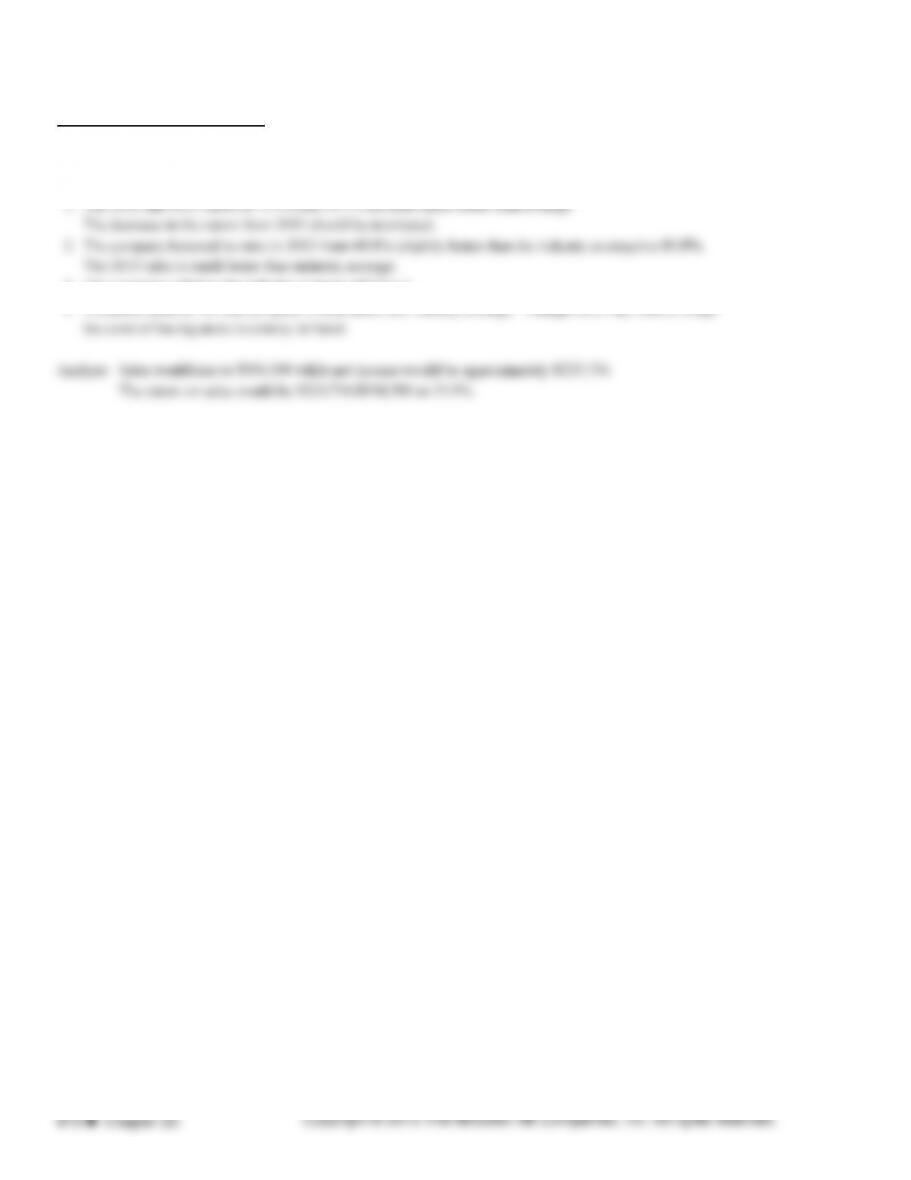
PROBLEM 23.2A (continued)
PART II
1. The 2012 and 2013 ratios of 73.9% and 59.5% are both much better than average.
3. The company is below the industry average of 2.5 to 1.
4. Inventory turnover for this company is well below the industry average. Management may want to weigh
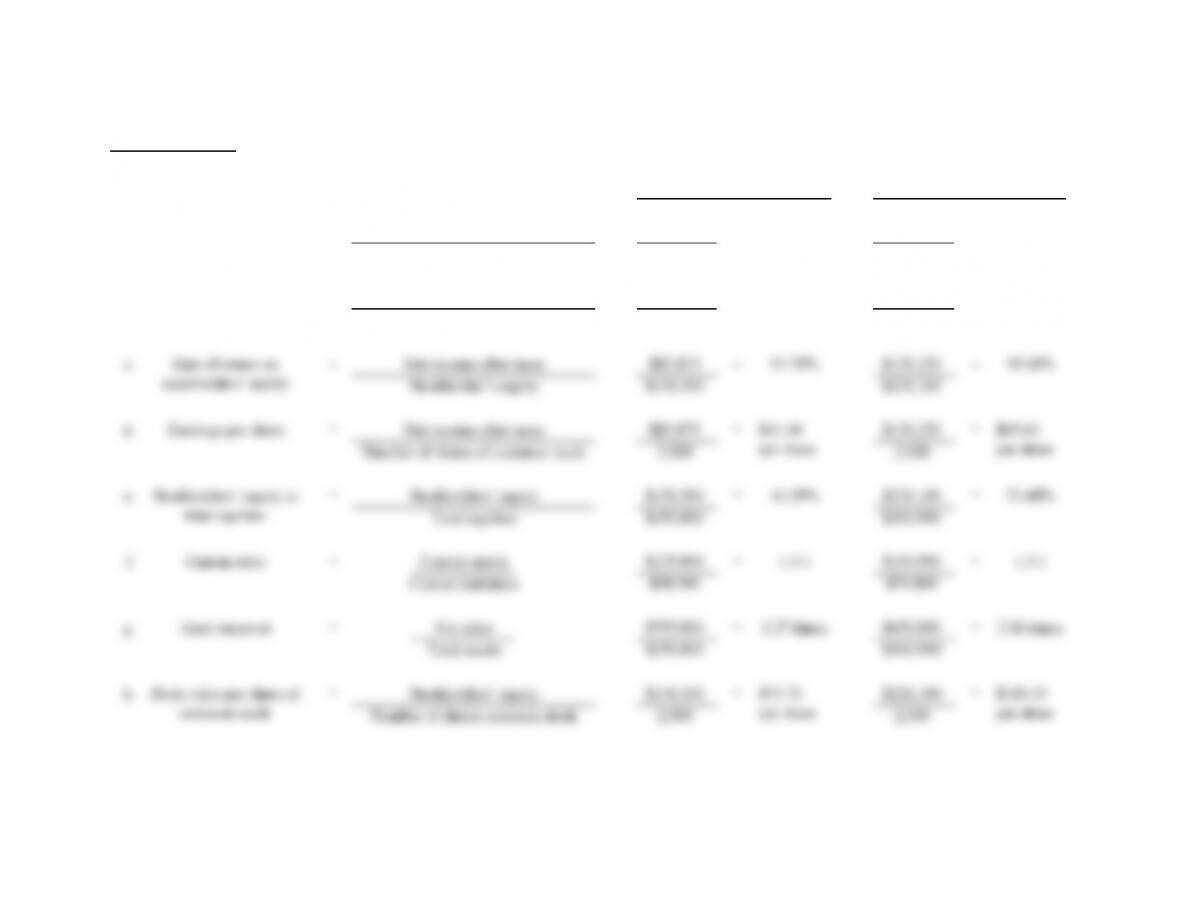
PROBLEM 23.3A
$82,875 $131,250
$795,000 $650,000
$120,500 $175,000
$350,000 $300,900
2,000 2,000
a.
b.
Number of shares common stock
per share
per share
58.16%
== 34.43%
common stock
Rate of return on net sales = Net income after taxes
Sales
Net income before taxes and interestRate of return on total
assets
=
Total assets
Five Inc. Six Inc.
= 10.42% = 20.19%
PROBLEM 23.3A (continued)
2.
3.
Six Inc. has better rate of return on sales and also a better balance sheet due to the lack of any long-
The long-term debt of Five Inc. could be a negative from an investment point of view. Six Inc. has
more net income on a smaller sales amount.


