Unlock document.
This document is partially blurred.
Unlock all pages and 1 million more documents.
Get Access
Student Name:
Class:
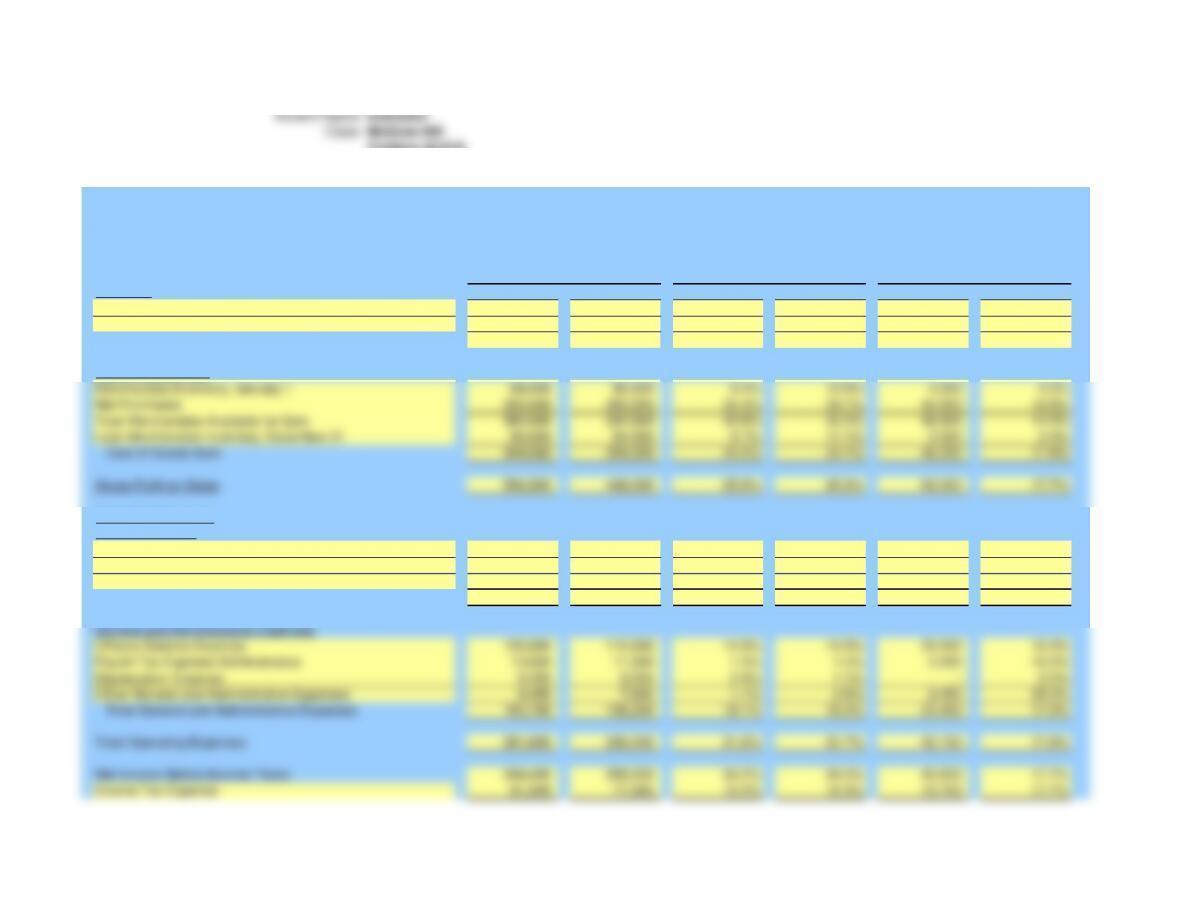
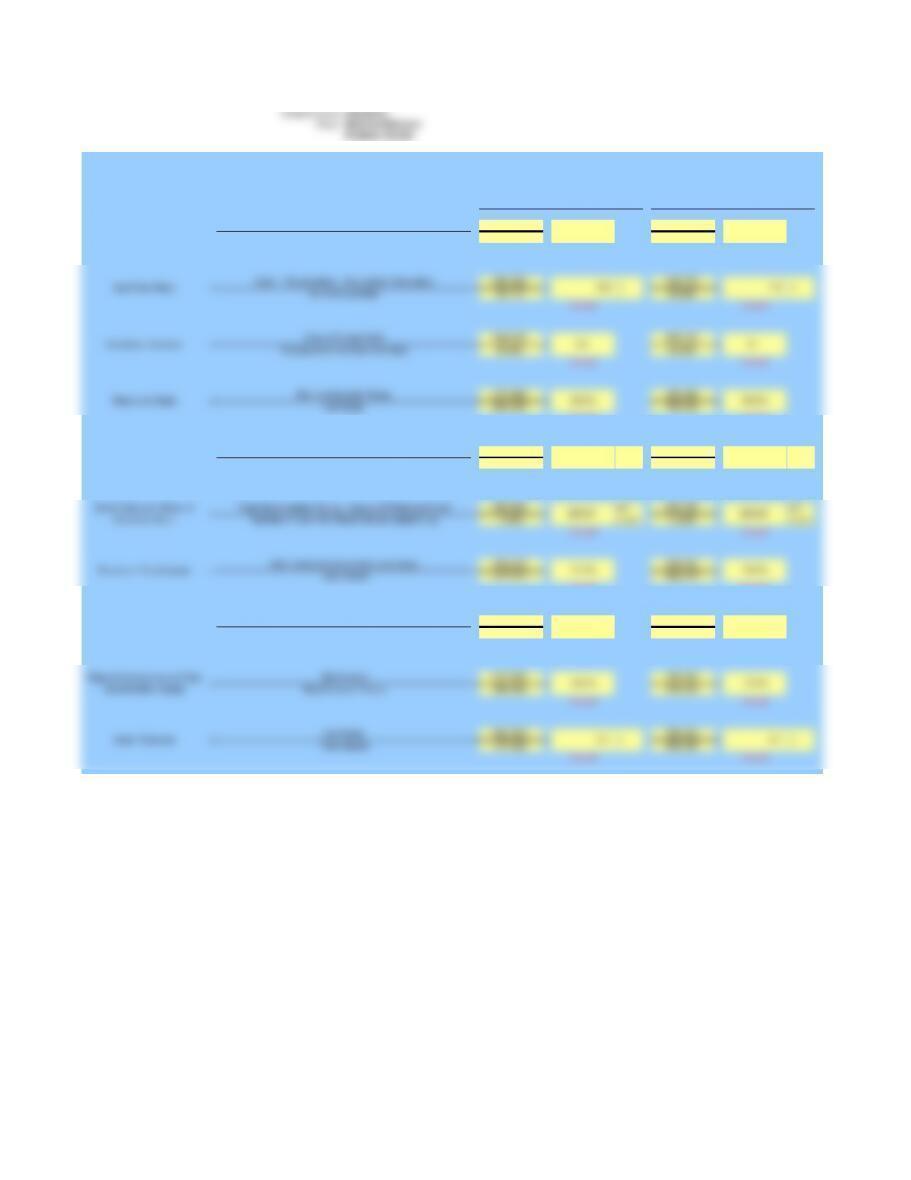
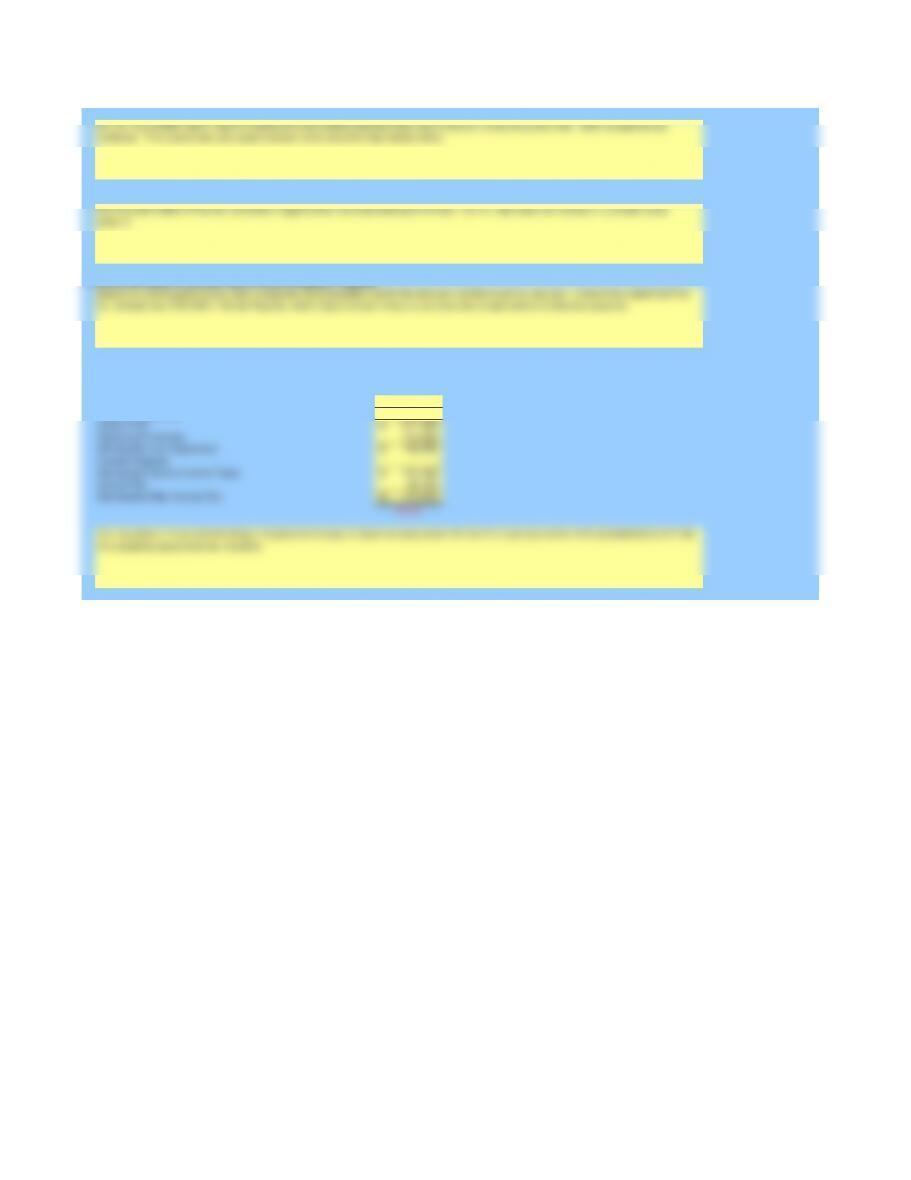
2013 2012 2013 2012 Amount Percent
905,000 765,000 101.7% 101.2% 140,000 18.3%
15,000 9,000 1.7% 1.2% 6,000 66.7%
890,000 756,000 100.0% 100.0% 134,000 17.7%
84,000 80,000 9.4% 10.6% 4,000 5.0%
306,000 262,000 34.4% 34.7% 44,000 16.8%
390,000 342,000 43.8% 45.2% 48,000 14.0%
86,000 84,000 9.7% 11.1% 2,000 2.4%
304,000 258,000 34.2% 34.1% 46,000 17.8%
586,000 498,000 65.8% 65.9% 88,000 17.7%
87,000 80,000 9.8% 10.6% 7,000 8.8%
8,700 8,000 1.0% 1.1% 700 8.8%
25,200 15,200 2.8% 2.0% 10,000 65.8%
120,900 103,200 13.6% 13.7% 17,700 17.2%
130,000 110,000 14.6% 14.6% 20,000 18.2%
13,000 11,000 1.5% 1.5% 2,000 18.2%
8,250 8,250 0.9% 1.1% - 0.0%
9,450 7,000 1.1% 0.9% 2,450 35.0%
160,700 136,250 18.1% 18.0% 24,450 17.9%
281,600 239,450 31.6% 31.7% 42,150 17.6%
304,400 258,550 34.2% 34.2% 45,850 17.7%
91,320 77,565 10.3% 10.3% 13,755 17.7%
Problem 23.01A
McGraw-Hill
Instructor
Sales
Revenue:
Cost of Goods Sold
Net Sales
Less Sales Returns and Allowances
Less Merchandise Inventory, December 31
Total Merchandise Available for Sale
Net Purchases
Merchandise Inventory, January 1
Selling Expenses
Operating Expenses
Gross Profit on Sales
Cost of Goods Sold
Officers Salaries Expense
Total Selling Expenses
Other Selling Expenses
Payroll Tax Expense-Selling
Sales Salaries Expense
THE LACAL COMPANY
Income Tax Expense
Net Income Before Income Taxes
Total Operating Expenses
Total General and Administrative Expenses
Comparative Income Statement
Payroll Tax Expense-Administrative
For the Years Ended December 31, 2013 and 2012
Amounts
of Sales
or Decrease
Percent
Increase
Other General and Administrative Expenses
Depreciation Expense
General and Administrative Expenses
213,080 180,985 23.9% 23.9% 32,095 17.7%
Correct! Correct! Correct! Correct! Correct! Correct!
Net Income After Income Taxes
2013 2012 2013 2012 Amount Percent
111,022 46,275 26.0% 13.0% 64,747 139.9%
95,000 87,500 22.2% 24.6% 7,500 8.6%
86,000 84,000 20.1% 23.6% 2,000 2.4%
9,500 5,000 2.2% 1.4% 4,500 90.0%
1,200 500 0.3% 0.1% 700 140.0%
302,722 223,275 70.9% 62.7% 79,447 35.6%
75,000 75,000 17.6% 21.1% - 0.0%
82,500 82,500 19.3% 23.2% - 0.0%
(33,000) (24,750) -7.7% -7.0% 8,250 33.3%
49,500 57,750 11.6% 16.2% (8,250) -14.3%
124,500 132,750 29.1% 37.3% (8,250) -6.2%
Correct!
427,222 356,025 100.0% 100.0% 71,197
Correct! Correct! Correct! Correct! Correct!
27,000 57,000 6.3% 16.0% (30,000) -52.6%
1,000 3,000 0.2% 0.8% (2,000) -66.7%
1,142 1,025 0.3% 0.3% 117 11.4%
1,000 5,000 0.2% 1.4% (4,000) -80.0%
30,142 66,025 7.1% 18.5% (35,883) -54.3%
39,000 45,000 9.1% 12.6% (6,000) -13.3%
39,000 45,000 9.1% 12.6% (6,000) -13.3%
69,142 111,025 16.2% 31.2% (41,883) -37.7%
10,000 10,000 2.3% 2.8% - 0.0%
10,000 10,000 2.3% 2.8% - 0.0%
338,080 225,000 79.1% 63.2% 113,080 50.3%
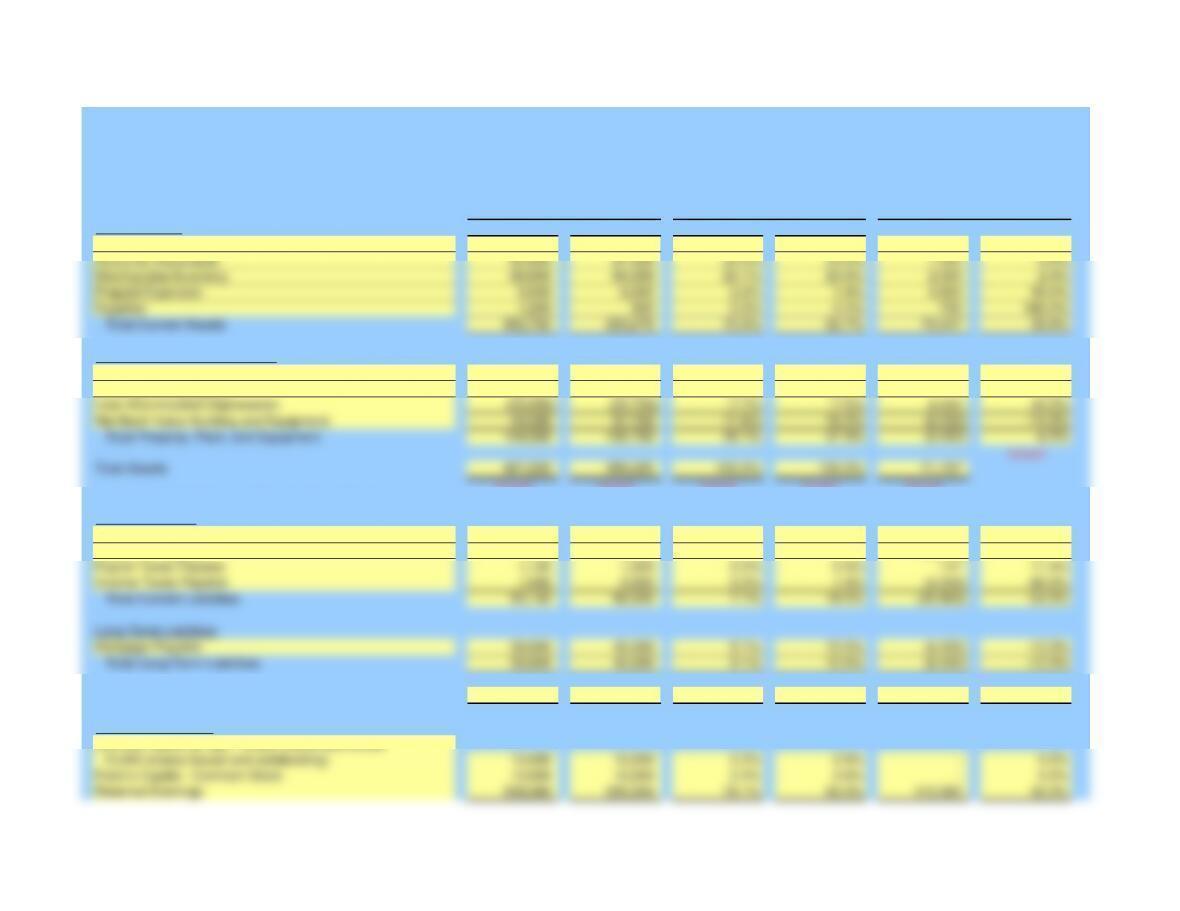
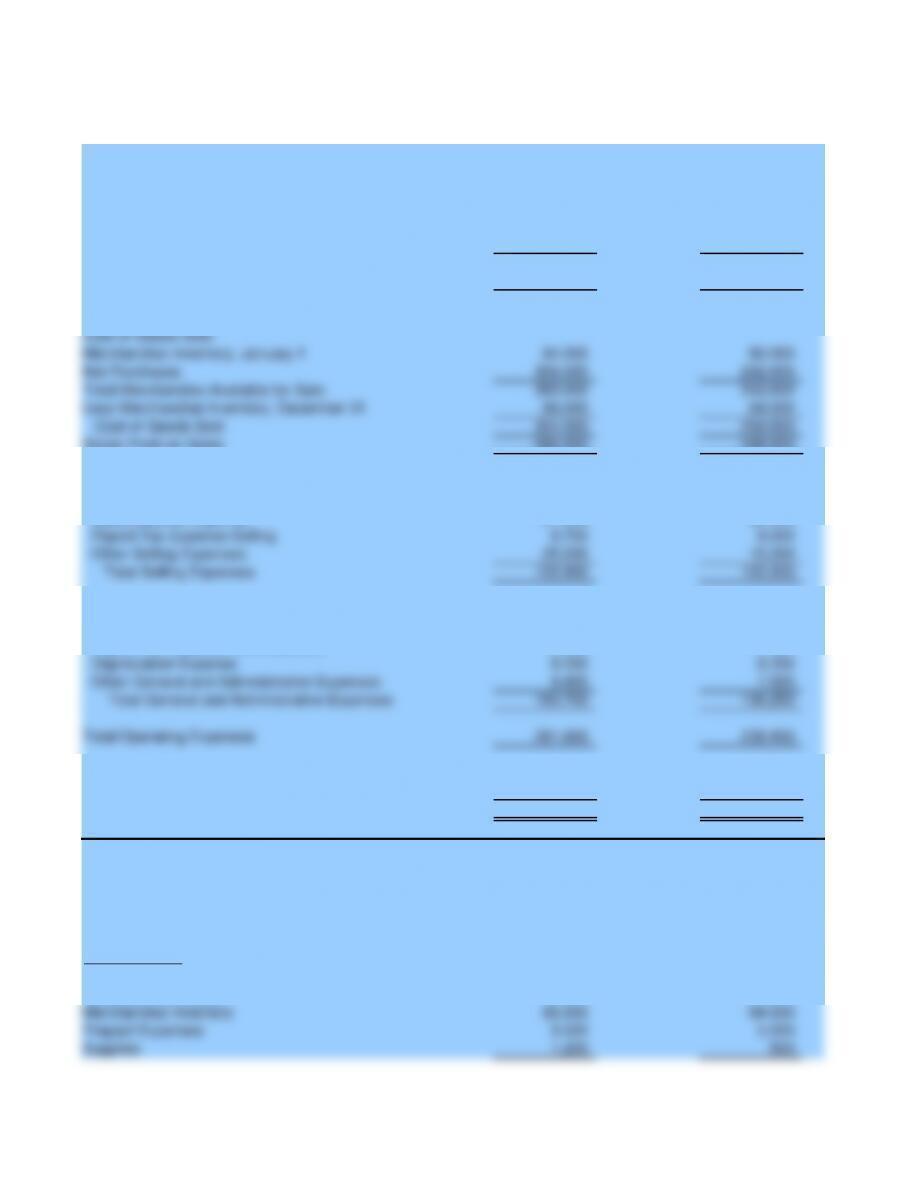
Amounts
Increase
or Decrease
Percent of
Total Assets
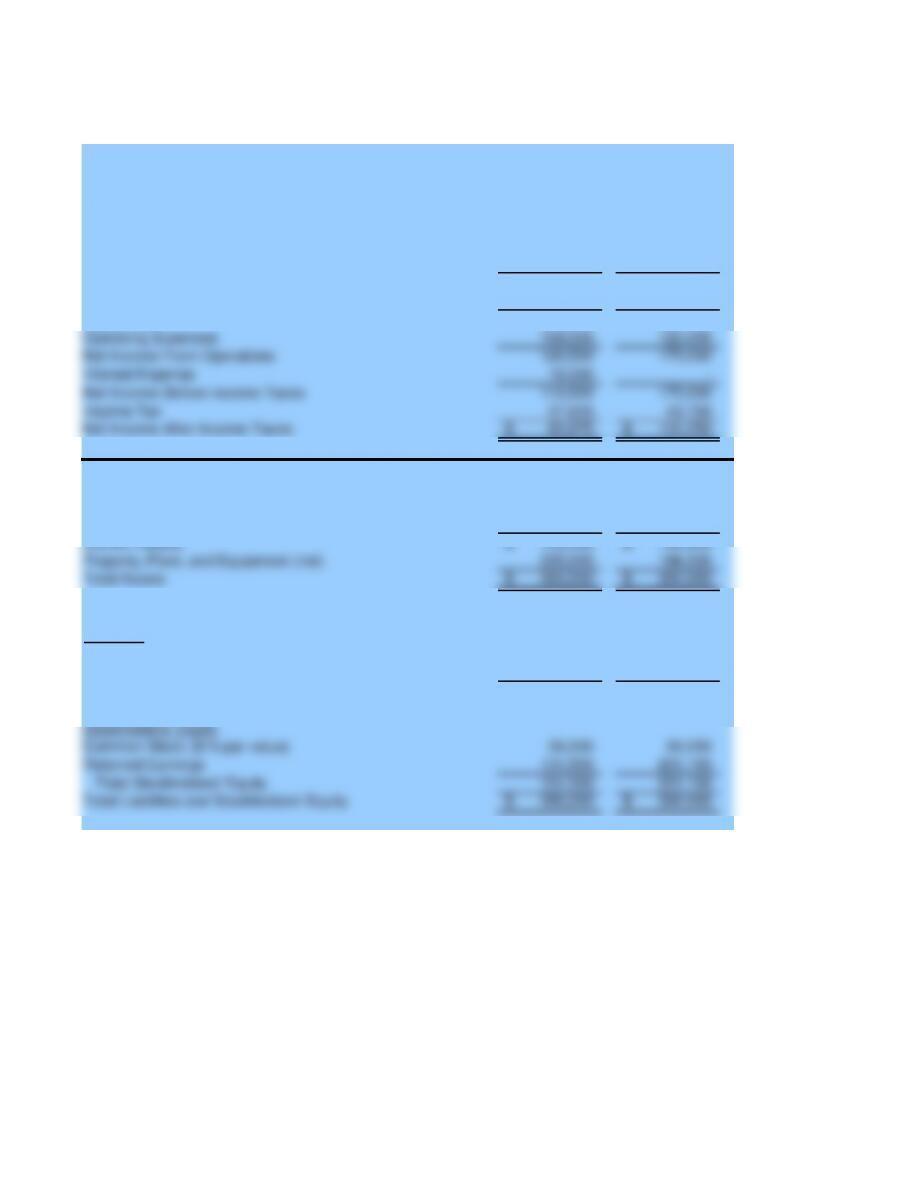
Sales Tax Payable
Accounts Payable
Current Liabilities
Prepaid Expenses
Merchandise Inventory
Accounts Receivable
Cash
Mortgage Payable
Long-Term Liabilities
Total Current Liabilities
Income Taxes Payable
Payroll Taxes Payable
Common Stock ($1 par, 10,000 shares authorized
Stockholders' Equity
Total Liabilities
Total Long-Term Liabilities
Retained Earnings
Paid-in-Capital - Common Stock
10,000 shares issued and outstanding)
Liabilities and Stockholders' Equity
Assets
Total Assets
Total Property, Plant, and Equipment
Net Book Value-Building and Equipment
Less Accumulated Depreciation
Property, Plant, and Equipment
December 31, 2013 and 2012
Comparative Balance Sheet
THE LACAL COMPANY
Building and Equipment
Land
Total Current Assets
Supplies
Current Assets

358,080 245,000 83.8% 68.8% 113,080 46.2%
427,222 356,025 100.0% 100.0% 71,197 20.0%
Correct! Correct! Correct! Correct! Correct! Correct!
Total Liabilities and Stockholders' Equity
Total Stockholders' Equity
2013 2012
905,000 765,000
15,000 9,000
890,000 756,000
84,000 80,000
306,000 262,000
390,000 342,000
86,000 84,000
304,000 258,000
586,000 498,000
87,000 80,000
8,700 8,000
25,200 15,200
120,900 103,200
130,000 110,000
13,000 11,000
8,250 8,250
9,450 7,000
160,700 136,250
281,600 239,450
304,400 258,550
91,320 77,565
213,080 180,985
111,022 46,275
95,000 87,500
86,000 84,000
9,500 5,000
1,200 500
Prepaid Expenses
Merchandise Inventory
Accounts Receivable
Given Data P23.01A
Cash
Current Assets
Assets
Supplies
Sales
Total Merchandise Available for Sale
Net Income After Income Taxes
Income Tax Expense
Net Income Before Income Taxes
Net Sales
Less Sales Returns and Allowances
THE LACAL COMPANY
Total Operating Expenses
Total General and Administrative Expenses
Other General and Administrative Expenses
Depreciation Expense
Payroll Tax Expense-Administrative
Officers Salaries Expense
General and Administrative Expenses
Comparative Balance Sheet
December 31, 2013 and 2012
THE LACAL COMPANY
For the Years Ended December 31, 2013 and 2012
Sales Salaries Expense
Selling Expenses
Operating Expenses
Net Purchases
Merchandise Inventory, January 1
Comparative Income Statement
Total Selling Expenses
Other Selling Expenses
Payroll Tax Expense-Selling
Cost of Goods Sold
Gross Profit on Sales
Cost of Goods Sold
Less Merchandise Inventory, December 31
Revenue:
302,722 223,275
75,000 75,000
82,500 82,500
(33,000) (24,750)
49,500 57,750
124,500 132,750
427,222 356,025
27,000 57,000
1,000 3,000
1,142 1,025
1,000 5,000
30,142 66,025
39,000 45,000
39,000 45,000
69,142 111,025
10,000 10,000
10,000 10,000
338,080 225,000
358,080 245,000
427,222 356,025
Land
Total Current Assets
Total Property, Plant, and Equipment
Net Book Value-Building and Equipment
Less Accumulated Depreciation
Building and Equipment
Current Liabilities
Total Assets
Property, Plant, and Equipment
Liabilities and Stockholders' Equity
Total Current Liabilities
Income Taxes Payable
Payroll Taxes Payable
Sales Tax Payable
Accounts Payable
Total Liabilities
Total Long-Term Liabilities
Mortgage Payable
Long-Term Liabilities
Total Liabilities and Stockholders' Equity
Total Stockholders' Equity
Retained Earnings
Paid-in-Capital - Common Stock
10,000 shares issued and outstanding)
Common Stock ($1 par, 10,000 shares authorized
Stockholders' Equity
Student Name:
Class:
Part I:
302,722 223,275
30,142 66,025
Correct! Correct!
206,022 133,775
30,142 66,025
Correct! Correct!
304,000 258,000
85,000 82,000
Correct! Correct!
213,080 180,985
890,000 756,000
Correct! Correct!
213,080 180,985
10,000 10,000
Correct! Correct!
358,080 245,000
10,000 10,000
Correct! Correct!
304,400 258,550
427,222 356,025
Correct! Correct!
358,080 245,000
427,222 356,025
Correct! Correct!
213,080 180,985
358,080 245,000
Correct! Correct!
890,000 756,000
427,222 356,025
Correct! Correct!
=
2.1
73.9%
=
=
=
Total Assets
Net Sales
:1
2.1
:1
68.8%
=
=
=
59.5%
Stockholders' Equity
Net Income
=
72.6%
=
=
=
83.8%
Total Equities
Stockholders' Equity
=
$24.50
per
share
=
=
=
71.3%
Total Assets
Net Income before interest and taxes
=
$18.10
per
share
=
=
=
$35.81
Number of Common Stock shares outstanding
Total Stockholders' Equity - Equity of Preferred Stock
per
share
=
=
=
=
$21.31
per
share
=
=
=
=
=
=
=
Current Ratio
Current Liabilities
Current Assets
Acid Test Ratio
:1
:1
:1
=
=
=
6.8
:1
=
Average number of shares of Common Stock
Net Income after Taxes - Preferred Dividend Requirement
Net Sales
Net Income after Taxes
=
23.9%
=
3.6
=
3.1
Problem 23.02A
McGraw-Hill/Irwin
Financial Ratios
THE LACAL COMPANY
Average Merchandise Inventory
Cost of Goods Sold
Current Liabilities
Cash + Receivables + Marketable Securities
=
3.4
Return on Sales
Inventory Turnover
2012
2.0
2013
10.0
=
23.9%
=
Instructor
Asset Turnover
Rate of Net Income on Total
Stockholders' Equity
Ratio of Stockholder's Equity
to Total Equities
Return on Total Assets
Book Value per Share of
Common Stock
Earnings per share of
Common Stock

Part II:
23.9%
Correct!
4. Merchandise inventory turnover
Inventory turnover for this company is well below the industry average. Management may want to weigh the costs of having more inventory on hand.
Analyze: Expected return on sales if net sales and net income after taxes increase by 5% in 2014
The 2012 and 2013 ratios of 73.9% and 59.5% are both much better than average. The decrease in the return form 2013 should be monitored.
1. Rate of return on stockholders' equity
2. Stockholders' equity to total equities
The company bettered its ration in 2013 from 68.8% (slightly better than the industry average) to 83.8%. The 2013 ratio is much better than industry
average.
3. Asset turnover
The company is below the industry average of 2.5 to 1.
2013 2012
905,000 765,000
15,000 9,000
890,000 756,000
84,000 80,000
306,000 262,000
390,000 342,000
86,000 84,000
304,000 258,000
586,000 498,000
87,000 80,000
8,700 8,000
25,200 15,200
120,900 103,200
130,000 110,000
13,000 11,000
8,250 8,250
9,450 7,000
160,700 136,250
281,600 239,450
304,400 258,550
91,320 77,565
213,080 180,985
111,022 46,275
95,000 87,500
86,000 84,000
9,500 5,000
1,200 500
Assets
Comparative Balance Sheet
Officers Salaries Expense
General and Administrative Expenses
Total Selling Expenses
December 31, 2013 and 2012
Total General and Administrative Expenses
Other General and Administrative Expenses
Payroll Tax Expense-Administrative
Other Selling Expenses
Payroll Tax Expense-Selling
Depreciation Expense
Sales Salaries Expense
Selling Expenses
Operating Expenses
Given Data P23.02A
Net Income After Income Taxes
Income Tax Expense
Net Income Before Income Taxes
Total Operating Expenses
Cost of Goods Sold
Gross Profit on Sales
Cost of Goods Sold
Less Merchandise Inventory, December 31
Total Merchandise Available for Sale
THE LACAL COMPANY
Comparative Income Statement
For the Years Ended December 31, 2013 and 2012
THE LACAL COMPANY
Net Sales
Less Sales Returns and Allowances
Sales
Revenue:
Net Purchases
Merchandise Inventory, January 1
Current Assets
Accounts Receivable
Cash
Supplies
Prepaid Expenses
Merchandise Inventory
302,722 223,275
75,000 75,000
82,500 82,500
(33,000) (24,750)
49,500 57,750
124,500 132,750
427,222 356,025
27,000 57,000
1,000 3,000
1,142 1,025
1,000 5,000
30,142 66,025
39,000 45,000
39,000 45,000
69,142 111,025
10,000 10,000
10,000 10,000
338,080 225,000
358,080 245,000
427,222 356,025
Selected ratios for other common-size companies in the same industry:
45%
0.6 to 1
2.5 to 1
4.5 times
Total Property, Plant, and Equipment
Net Book Value-Building and Equipment
Less Accumulated Depreciation
Building and Equipment
Land
Property, Plant, and Equipment
4. Merchandise inventory turnover
3. Asset turnover
2. Stockholders' equity to total equities
1. Rate of return on stockholders' equity
Retained Earnings
Paid-in-Capital - Common Stock
10,000 shares issued and outstanding)
Common Stock ($1 par, 10,000 shares authorized
Total Liabilities and Stockholders' Equity
Total Stockholders' Equity
Long-Term Liabilities
Stockholders' Equity
Total Liabilities
Accounts Payable
Total Assets
Additional Information:
Total Current Liabilities
Income Taxes Payable
Payroll Taxes Payable
Sales Tax Payable
Total Long-Term Liabilities
Mortgage Payable
Liabilities and Stockholders' Equity
Current Liabilities
Total Current Assets
Student Name:
Class:
a. $82,875 $131,250
$795,000 $650,000
Correct! Correct!
b. $120,500 $175,000
$350,000 $300,900
Correct! Correct!
c. $82,875 $131,250
$151,500 $221,100
Correct! Correct!
d. $82,875 $131,250
2,000 2,000
Correct! Correct!
e. $151,500 $221,100
$350,000 $300,900
Correct! Correct!
f. $125,000 $104,900
$98,500 $79,800
Correct! Correct!
g. $795,000 $650,000
$350,000 $300,900
Correct! Correct!
h. $151,500 $221,100
2,000 2,000
Correct! Correct!
$110.55
per
share
2.27
=
=
=
$75.75
per
share
=
:1
Times
=
2.16
=
=
=
Times
73.48%
Instructor
=
=
=
1.3
:1
=
1.3
McGraw-Hill/Irwin
=
=
=
=
Number of Shares of Common Stock
Net Income after Taxes
per
share
=
$65.63
per
share
=
=
=
43.29%
=
$41.44
Problem 23.03A
54.70%
=
=
FIVE, INC. and SIX, INC.
Financial Ratios
Five, Inc.
Six, Inc.
=
=
=
59.36%
Stockholders' Equity
Net Income After Taxes
20.19%
=
58.16%
=
10.42%
=
=
=
=
34.43%
Total Assets
Net Income Before Taxes and Interest
Sales
Rate of Return on
Stockholders' Equity
Rate of Return on Total Assets
Rate of Return on Net Sale
Earnings per share
Book Value per Share of
Common Stock
Asset Turnover
Current Ratio
Stockholder's Equity to Total
Equities
Net Income after Taxes
Current Liabilities
Current Assets
Total Equities
Stockholders' Equity
Number of Shares of Common Stock
Stockholders' Equity
Total Assets
Net Sales
650,000$
332,500
317,500$
125,000
192,500$
-
192,500$
48,125
144,375$
Correct!
Net Income Before Income Taxes
4. Would you grant a five-year loan to either company? Explain.
Based on current performance, both companies could probably handle the debt service that would be required. It should be noted that Five
Inc. already has $100,000 of Bonds Payable, which might concern investors and bankers should additional debt be assumed.
2. Comment on similarities or differences in the two companies' ratios.
Six inc. has a better rate of return on sales and also a better balance sheet due to the lack of any long-term debt. Both companies are
profitable. The current ratio and asset turnover ratios were the only similar ratios.
3. From the investors' point of view, is one company more at risk than the other?
The long-term debt of Five Inc. could be a negative from an investment point of view. Six Inc. has more net income on a smaller sales
amount.
The reduction of 5 percent will bring a 10 percent increase in return on sales (from 20.2 to 22.2) and also on the EPS (from$65.63 to $72.19).
This would be good news for investors.
Analyze: Discuss the implications to the rate of return on sales and earnings per share if the company can cut cost of goods by 5% in 2014
while maintaining net sales and operating expenses at 2013 levels. Assume a tax rate of 25%.
Net Income After Income Tax
Income Tax
Interest Expense
Net Income from Operations
Operating Expenses
Gross Profit
Cost of Goods Sold
Sales
Five, Inc. Six, Inc.
795,000$ 650,000$
505,000 350,000
290,000 300,000
169,500 125,000
120,500 175,000
10,000 -
110,500 175,000
27,625 43,750
82,875$ 131,250$
Five, Inc. Six, Inc.
125,000$ 104,900$
225,000 196,000
350,000$ 300,900$
98,500$ 79,800$
100,000 -
Current Liabilities
Interest Expense
Net Income From Operations
Liabilities and Stockholders' Equity
Liabilities
Balance Sheets
December 31, 2013
Total Long-Term Liabilities (Bonds Payable)
FIVE, INC. and SIX, INC.
Condensed Financial Statements
Year Ended December 31, 2013
Net Income After Income Taxes
Income Tax
Net Income Before Income Taxes
Total Assets
Property, Plant, and Equipment (net)
Current Assets
Given Data P23.03A
Operating Expenses
Gross Profit
Cost of Goods Sold
Sales (net)
Income Statements
Assets


