• The Best Buy family of brands and partnerships collectively generates more than $45 billion in
annual revenue and includes brands such as Best Buy; Audiovisions; The Carphone Warehouse;
Future Shop; Geek Squad, Jiangsu Five Star; Magnolia Audio Video; Napster; Pacific Sales; and
The Phone House.
• Best Buy employs more than 155,000 associates worldwide.
• Best Buy donated a combined $33.4 million in fiscal 2009 to improve the vitality of the
communities where its employees and customers live and work.
• Net sales were $49.6 billion in 2010.
1. Similar items are grouped, then computed at their cost and their market values. The lower of total
2. The item-by-item method should almost always yield the lowest value.
4. The cost flows used in valuing inventories are not intended to reflect actual physical flow of
5. Detailed records are kept of all factors affecting the selling price of merchandise available for sale.
6. Goods destroyed by fire or stolen; a quick estimate is needed for planning.
7. The goal is to provide physical protection of inventory at all times. Keeping accurate records of
Discussion Questions
Chapter Opener: Thinking Critically
MERCHANDISE INVENTORY
CHAPTER 17
Students should realize that In-Store Pickup provides Best Buy with merchandising data. The company
can generate reports on which products are in high demand in different geographic areas, improving
product selection in each store location.
Fast Facts
Managerial Implications: Thinking Critically
periodic physical count.
Neither. The gross profit and retail methods are intended as supplements, not replacements, for the
Discussion Questions (continued)
10. No. A physical count of inventory should be made at least once a year to verify accuracy of
perpetual records.
12. If there are few items in the inventory, each with significant cost and an individual identifying part
number or serial number, specific identification is logical.
14. The first in, first out assumption is that (for costing purposes only) the costs of merchandise should
15. Market is the current cost of acquiring identical items on the open market in normal quantities
purchased.
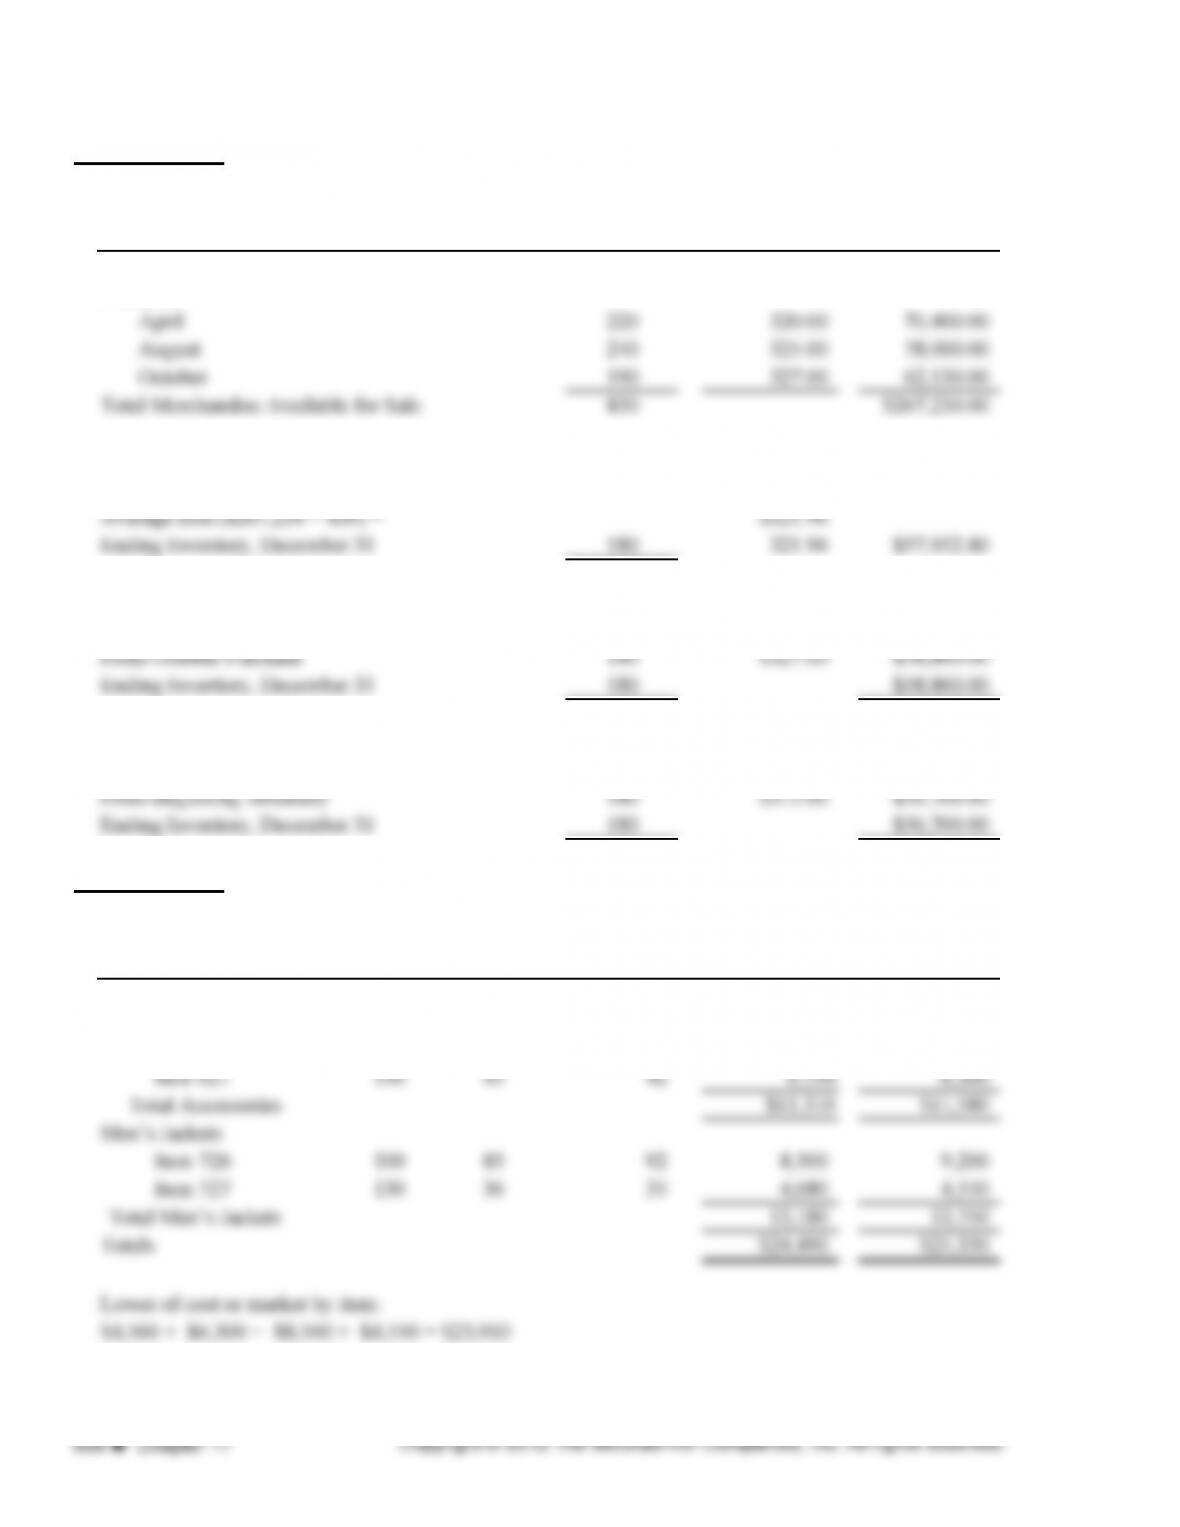
EXERCISE 17.1
Description
Number of
Units Unit Cost Total Cost
Beginning Inventory, January 1 180 $315.00 $56,700.00
Purchases:
1. Average Cost Method
2. FIFO Method
3. LIFO Method
EXERCISE 17.2
Description Quantity Unit Cost Market Value Total Cost Total Market
1. Item by Item
Accessories
240 $19 $22 $4,560 $5,280
Item 620
EXERCISE 17.2 (continued)
2. Total Cost or Total Market Value of Ending Inventory
3. By Groups
EXERCISE 17.3
EXERCISE 17.4
Beginning Inventory, January 1
$220,000
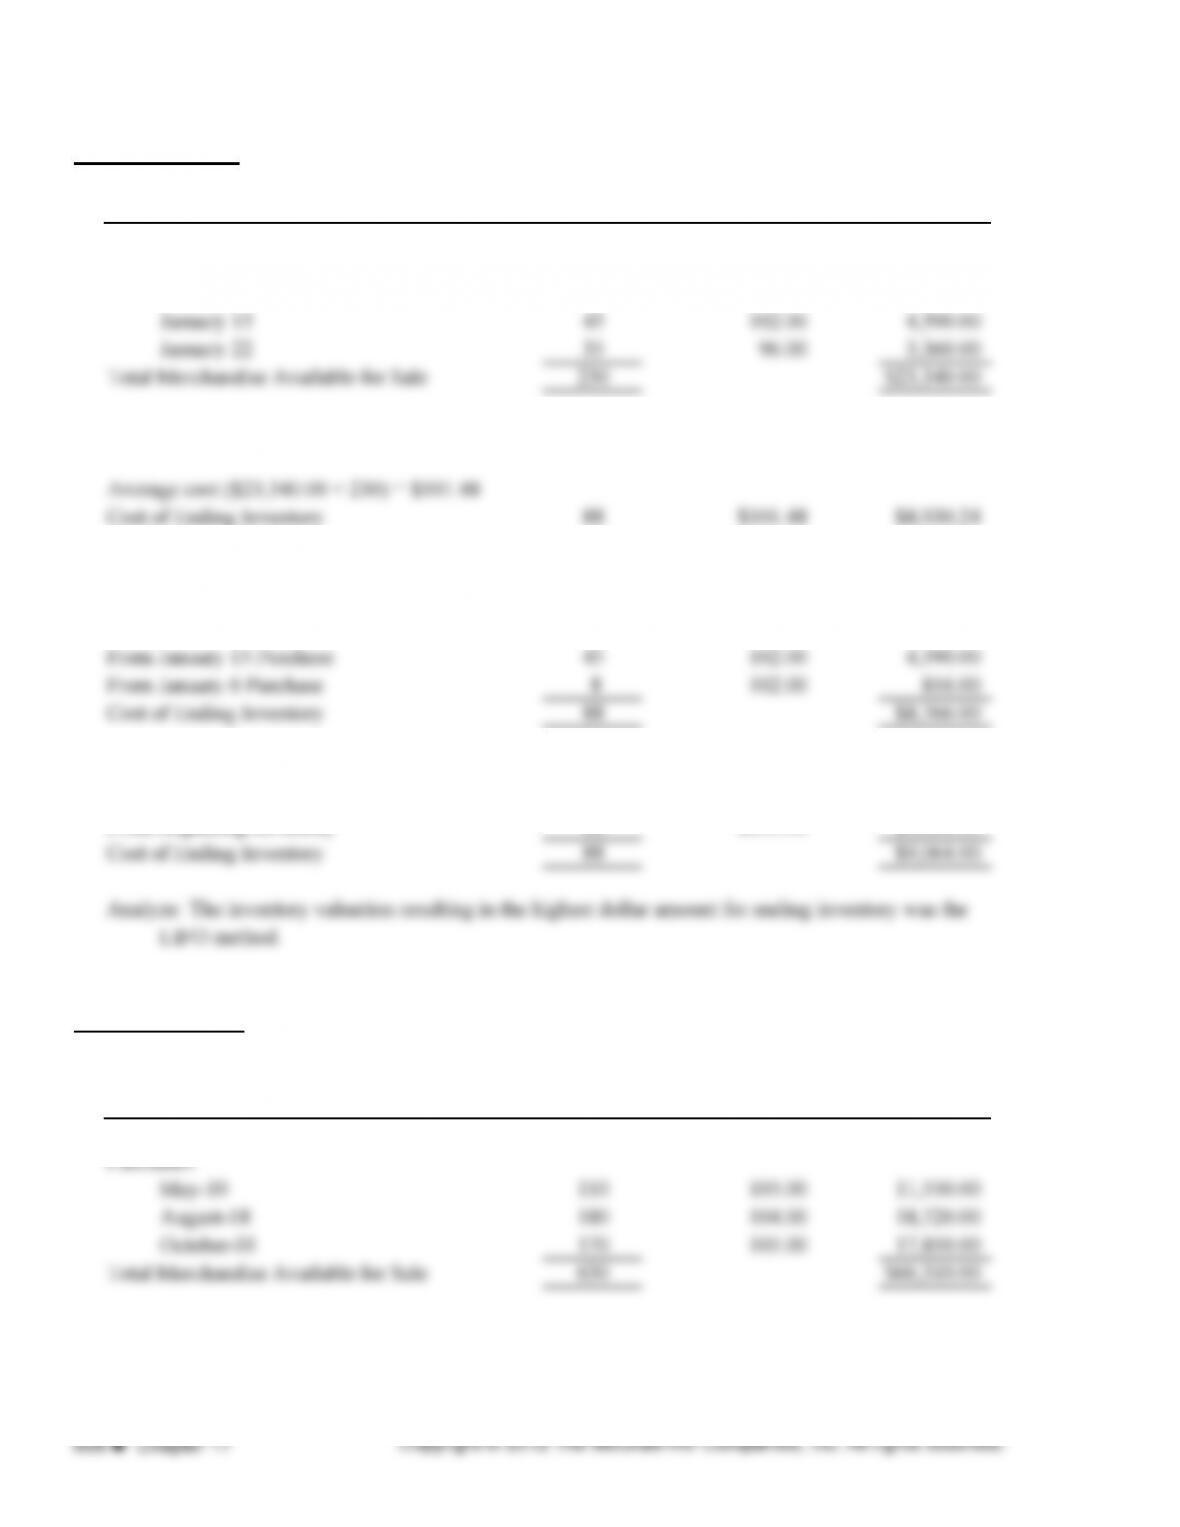
PROBLEM 17.1A
Description Number of Units Unit Cost Total Cost
Beginning Inventory, January 1 90 $103.00 $9,270.00
Purchases:
January 6 60 102.00 $6,120.00
a. Average Cost Method
b. FIFO Method
From January 22 Purchase 35 $96.00 $3,360.00
c. LIFO Method
From Beginning Inventory 88 $103.00 $9,064.00
PROBLEM 17.2A
1.
Description Number of Units Unit Cost Total Cost
Beginning Inventory, January 1 170 $107.00 $18,190.00
PROBLEM 17.2A (continued)
Description
Number of
Units Unit Cost
Inventory
Valuation
Cost Of
Goods Sold
a. FIFO Method
From October 1 Purchase 170 $105.00 $17,850.00
c. Average Cost Method
Avg. cost per unit ($66,310.00 ÷ 630) $105.25
2.
Lower of
Cost
or Market
a. FIFO 175 $18,370.00 $18,418.75 Cost $18,370.00
Valuation Based on:
Method
Number of
Units Cost Market
Valuation
Basis
PROBLEM 17.3A
Description Quantity Unit Cost
Market
Value Total Cost
Total
Market
Lower of
Cost or
Market
Printer Cartridges
Item 119 50 $16.00 $16.50 $800.00 $825.00 $800.00
Item 120 60 17.25 17.10 1,035.00 1,026.00 1,026.00
Item 121 90 23.00 23.50 2,070.00 2,115.00 2,070.00
Total Cartridges $3,905.00 $3,966.00 $3,896.00
Fax Machines
Item 210 15 $86.00 $89.00 $1,290.00 $1,335.00 $1,290.00
Item 211 10 192.00 186.00 1,920.00 1,860.00 1,860.00
Item 212 9 225.00 210.00 2,025.00 1,890.00 1,890.00
Total Fax Machines $5,235.00 $5,085.00 $5,040.00
Grand Totals $9,140.00 $9,051.00 $8,936.00
Inventory Valuations Lower of Cost or Market
1. Lower of cost or market by individual items
2. Lower of total cost or total market
3. Lower of total cost or total market by groups
Total inventory by groups
Analyze: The valuation method that will yield the highest net income is the lower of cost or market by total.
$8,990.00
$8,936.00
$9,051.00
$3,905.00
5,085.00
PROBLEM 17.4A
Beginning Inventory, January 1, 2013 $117,000.00
Purchases 1,170,000.00
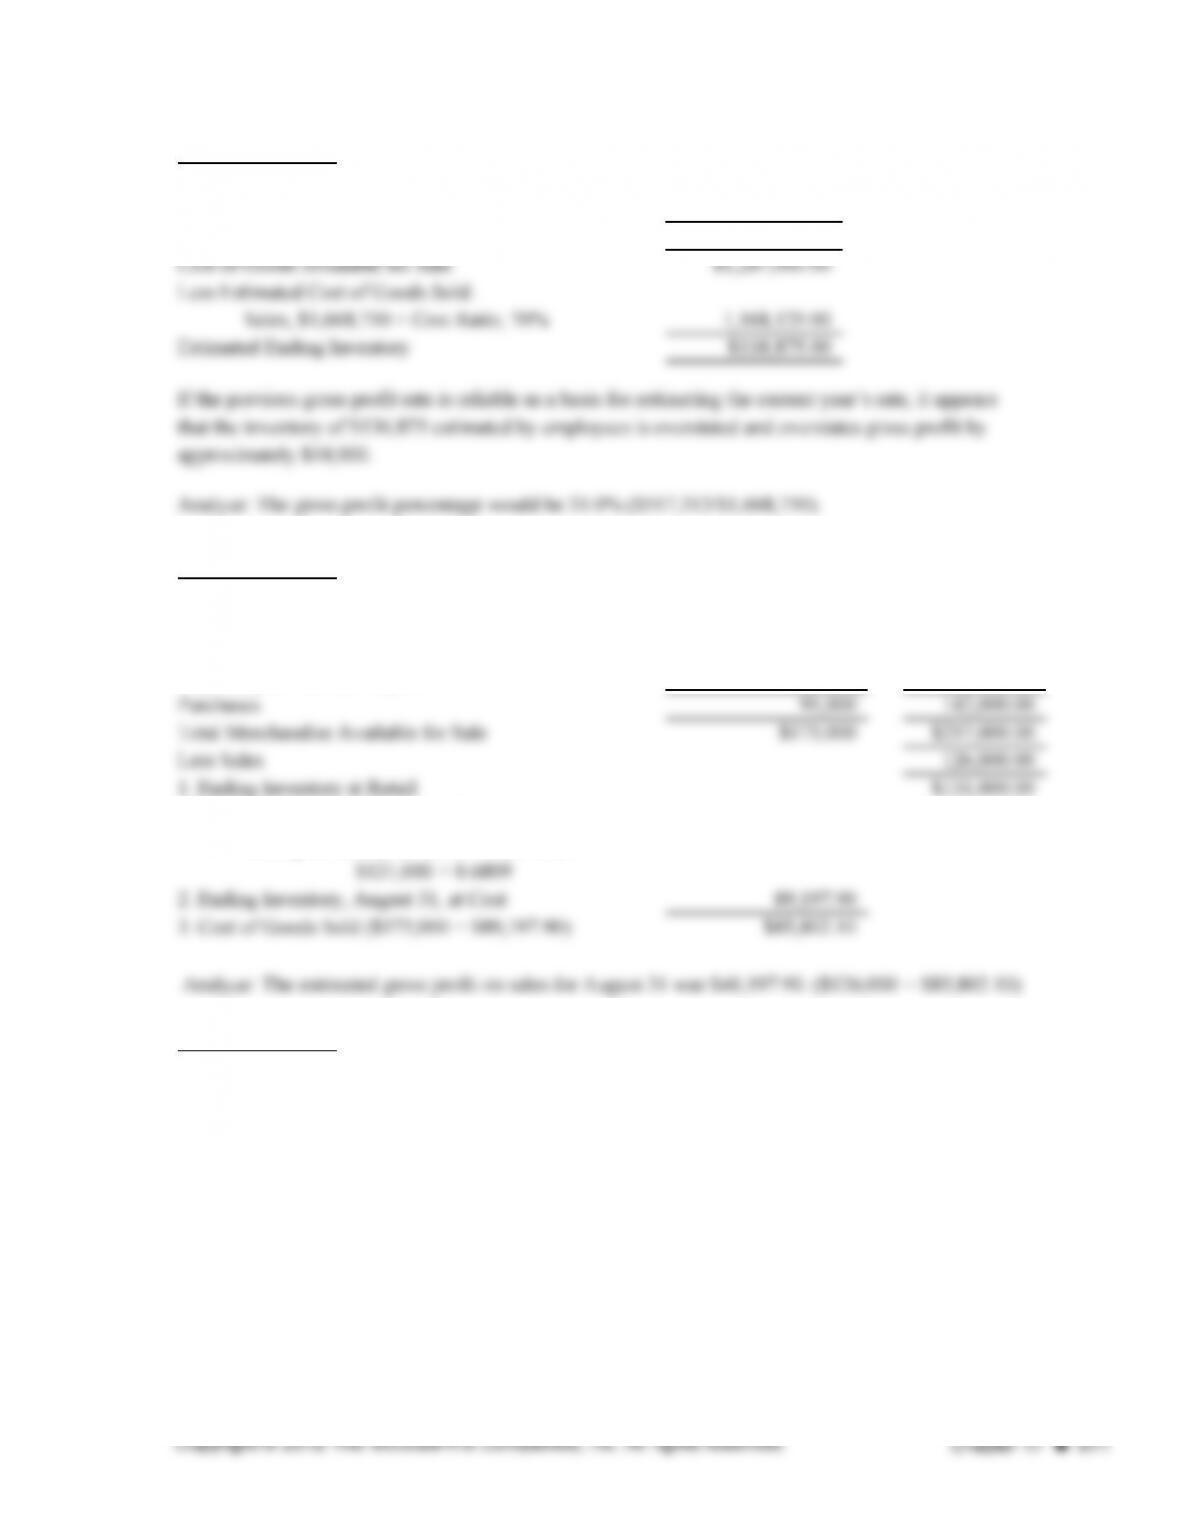
PROBLEM 17.5A
Estimated Inventory Cost Retail
Beginning Inventory, August 1 $115,000.00
$80,000
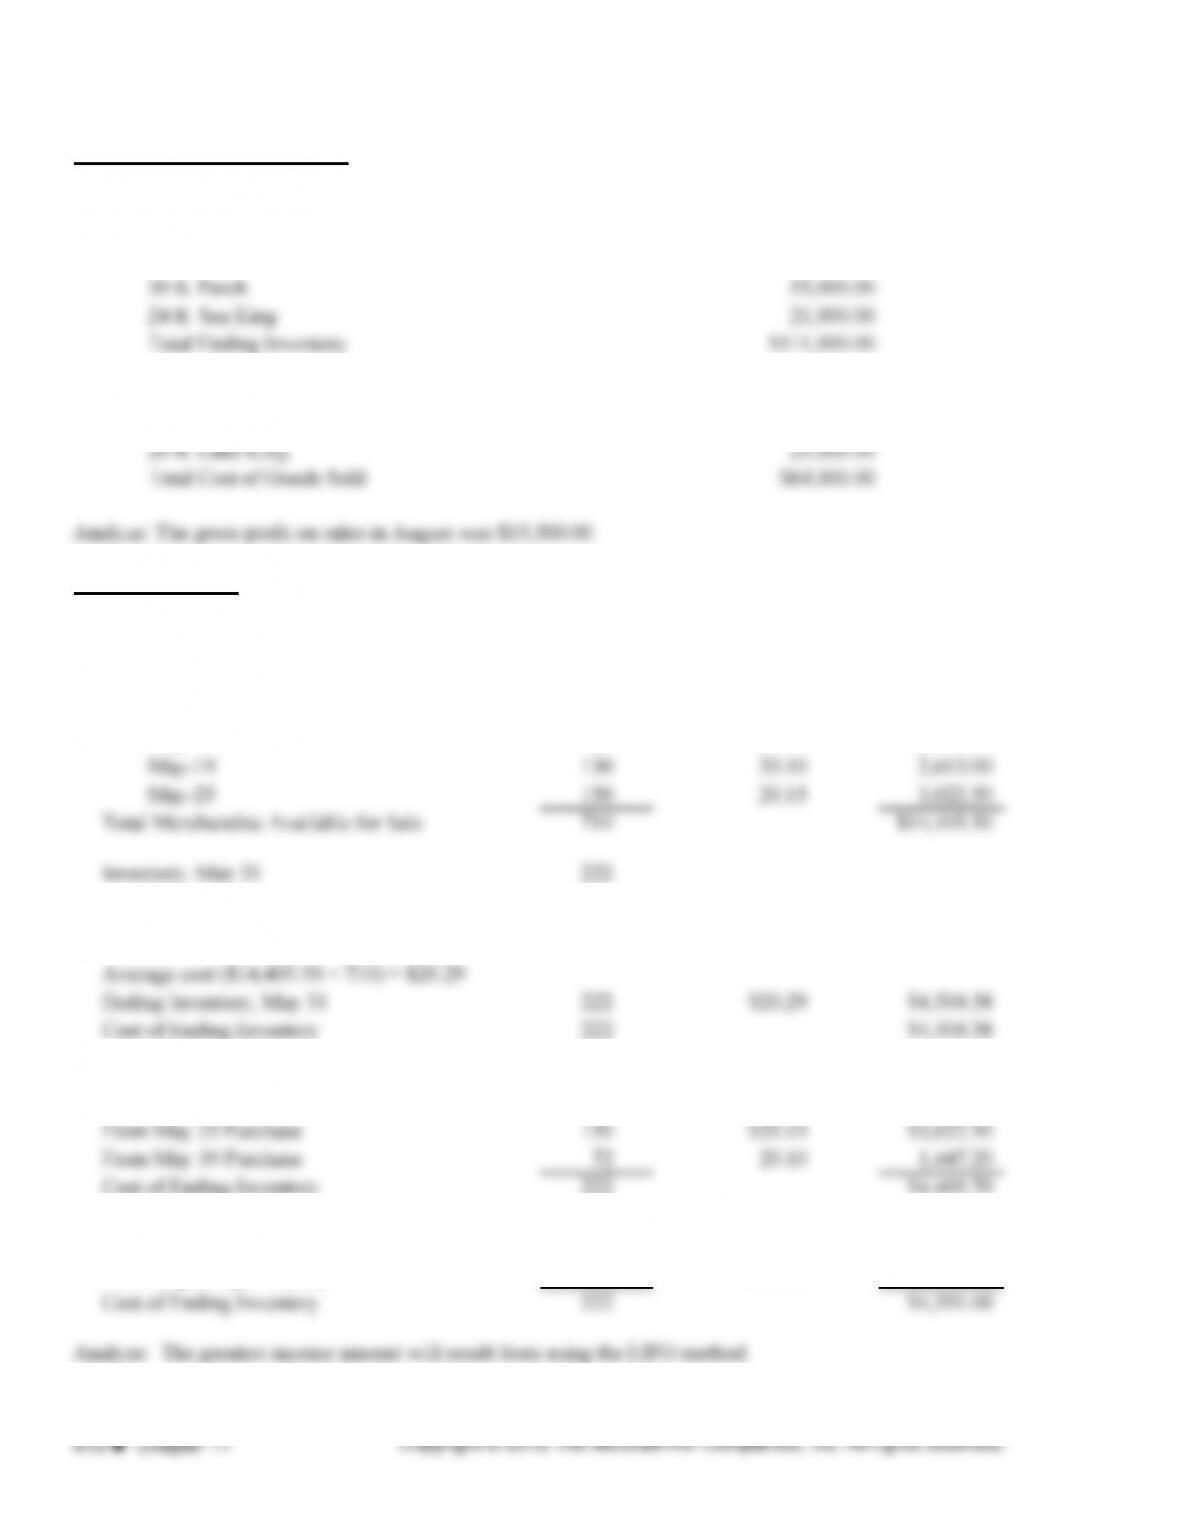
PROBLEM 17.6A (continued)
2. Cost of items still on hand in ending inventory on August 31:
Item
28 ft. Starfish
3. Cost of Goods Sold during August:
30 ft. Holiday
PROBLEM 17.1B
Description Number of Units Unit Cost Total Cost
Beginning Inventory, May 1 250 $20.50 $5,125.00
Purchases:
May-10 180 20.25 $3,645.00
a. Average Cost Method
b. FIFO Method
c. LIFO Method
From Beginning Inventory 222 $20.50 $4,551.00
$41,000.00
Cost
$35,000.00
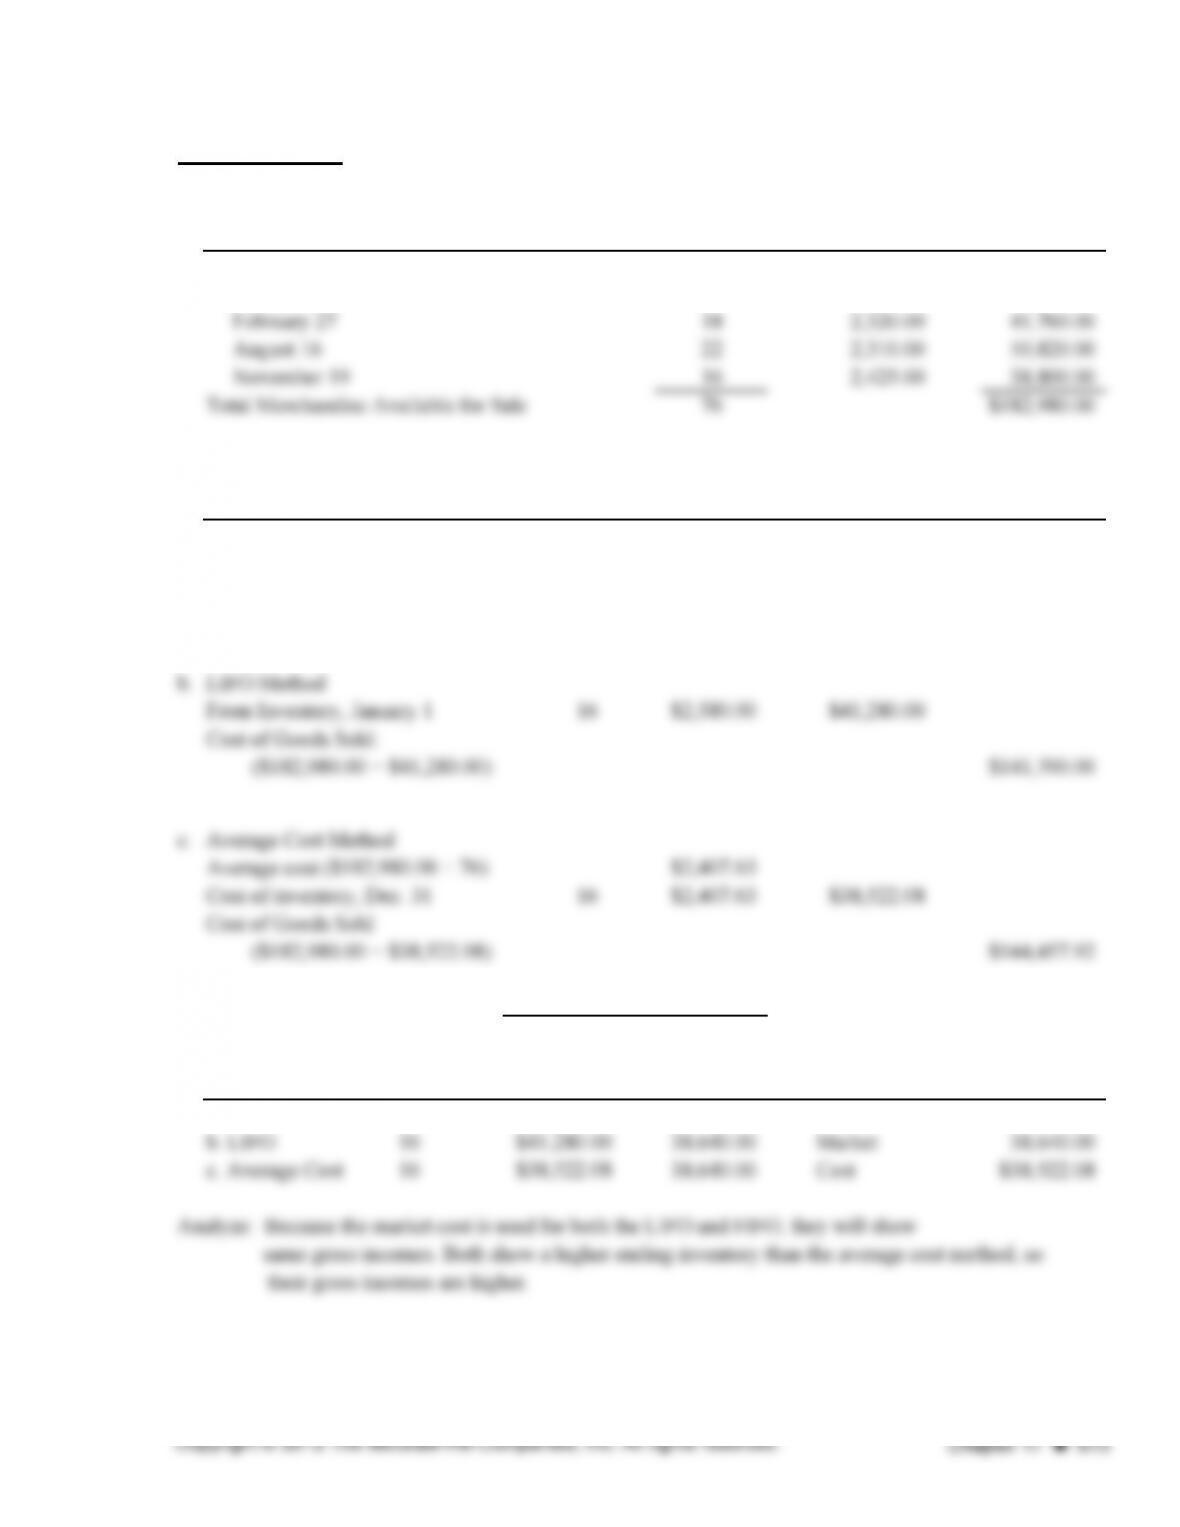
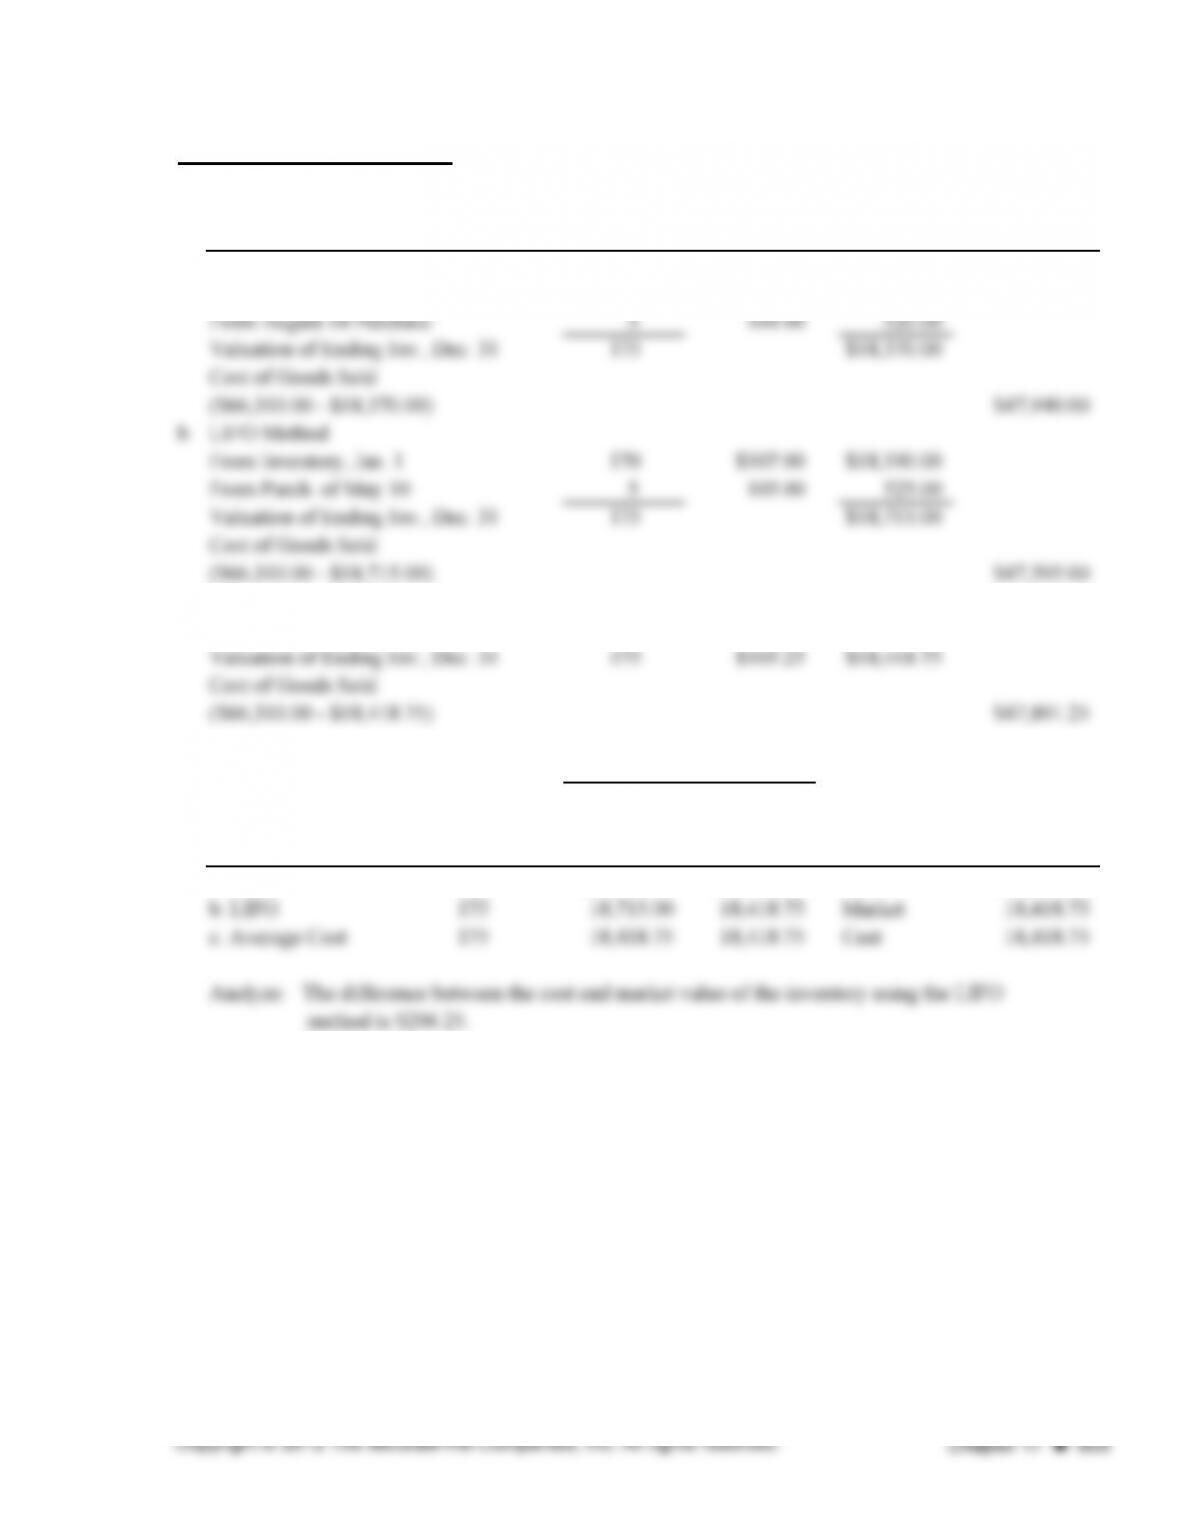
PROBLEM 17.2B
1.
Description Number of Units Unit Cost Total Cost
20 $2,580.00 $51,600.00
Description Unit Cost
Ending
Inventory
Cost
Cost Of
Goods Sold
a. FIFO Method
From November 19 Purchase $2,425.00 $38,800.00
Cost of Goods Sold:
($182,980.00 − $38,800.00) $144,180.00
2.
Number
of
Lower of
Cost
Method Units or Market
a. FIFO 16 $38,640.00 Market $38,640.00
Analyze: Because the market cost is used for both the LIFO and FIFO, they will show
same gross incomes. Both show a higher ending inventory than the average cost method, so
their gross incomes are higher.
$38,800.00
Valuation Based on:
Beginning Inventory, January 1
Number
of Units
Purchases:
Cost Market
Valuation
Basis
16
PROBLEM 17.3B
Description Quantity Unit Cost Market Value Total Cost Total Market
Lower of
Cost or
Market
Motor Bike Department
Model 705 15 $9,800.00 $9,675.00 $147,000.00 $145,125.00 $145,125.00
Model 766 25 10,250.00 11,390.00 256,250.00 284,750.00 256,250.00
Model 815 12 12,475.00 12,800.00 149,700.00 153,600.00 149,700.00
Total Motor Bikes $552,950.00 $583,475.00 $551,075.00
Boat Department
Model BX12 8 $5,290.00 $5,395.00 $42,320.00 $43,160.00 $42,320.00
Model BX14 7 7,125.00 6,980.00 49,875.00 48,860.00 48,860.00
Model BX16 6 5,100.00 5,325.00 30,600.00 31,950.00 30,600.00
Total Boats $122,795.00 $123,970.00 $121,780.00
Grand Totals $675,745.00 $707,445.00 $672,855.00
Inventory Valuations
1. Lower of cost or market by individual items
2. Lower of total cost or total market
3. Lower of total cost or total market by groups
Motor Bikes
Boats
Total inventory by groups
Analyze: The lower of total cost or total market method yields the same inventory valuation as the lower of cost or
market by group. Both of these would yield higher income than lower of cost or market by individual items.
$672,855.00
Lower of Cost or Market
$675,745.00
$552,950.00
122,795.00
$675,745.00
PROBLEM 17.4B
Beginning Inventory, January 1, 2013
Purchases
PROBLEM 17.5B
Estimated Inventory Cost
Beginning Inventory, April 1
1. Ending Inventory at Retail
2. Ending Inventory, April 30, at Cost
PROBLEM 17.6B
1. Specific identification. Each item is easily identified and has high value.
575,717
$866,000
$ 410,000.00
4,160,000.00
$918,000
$1,340,000
Retail
PROBLEM 17.6B (continued)
2. Cost of items still on hand in ending inventory:
Item Cost
Unit #06-92 $ 790,000.00
3. Cost of Goods Sold during August:
Unit #06-94 $ 873,000.00
Unit #06-95 1,900,000.00
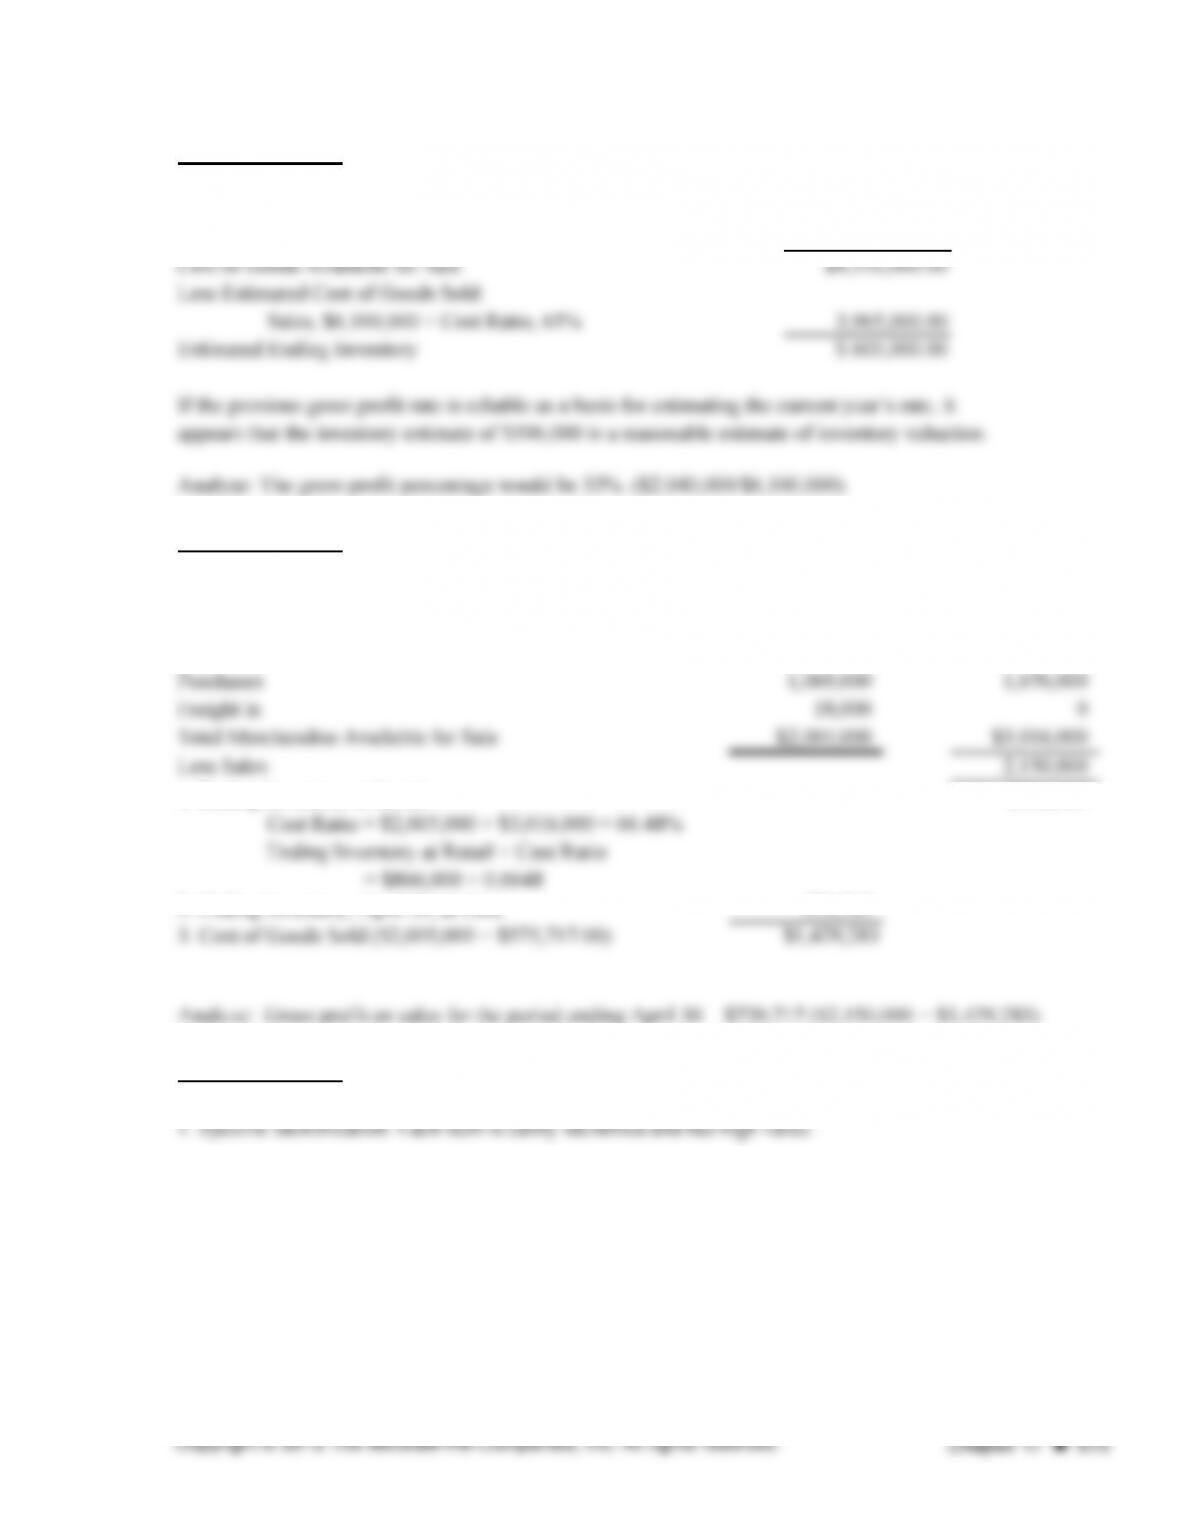
CRITICAL THINKING PROBLEM 17.1
Estimated Inventory Retail
Beginning Inventory, January 1 $80,000.00 $107,560.00
Purchases, January 1–March 18 240,000.00 320,500.00
Freight in 8,200.00
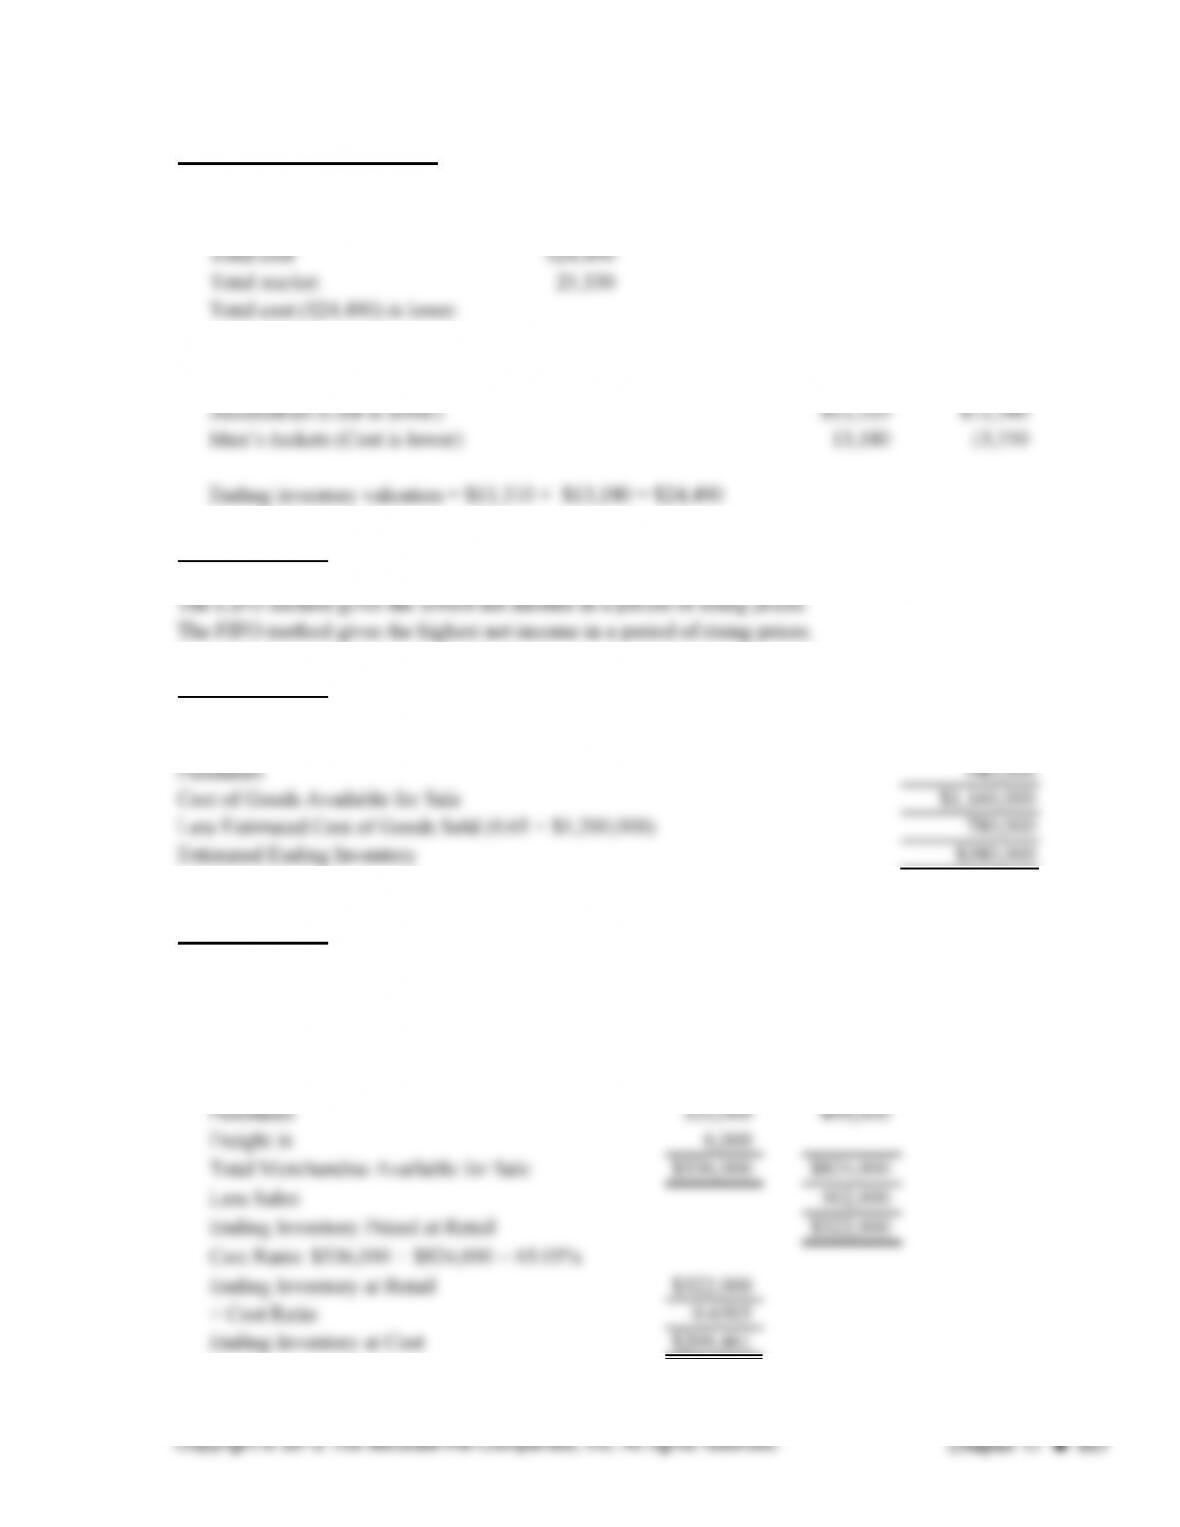
Because the accounting records have been preserved, the retail inventory method may be used to
estimate the inventory destroyed in the fire. The approximate cost is $59,848.60 computed as
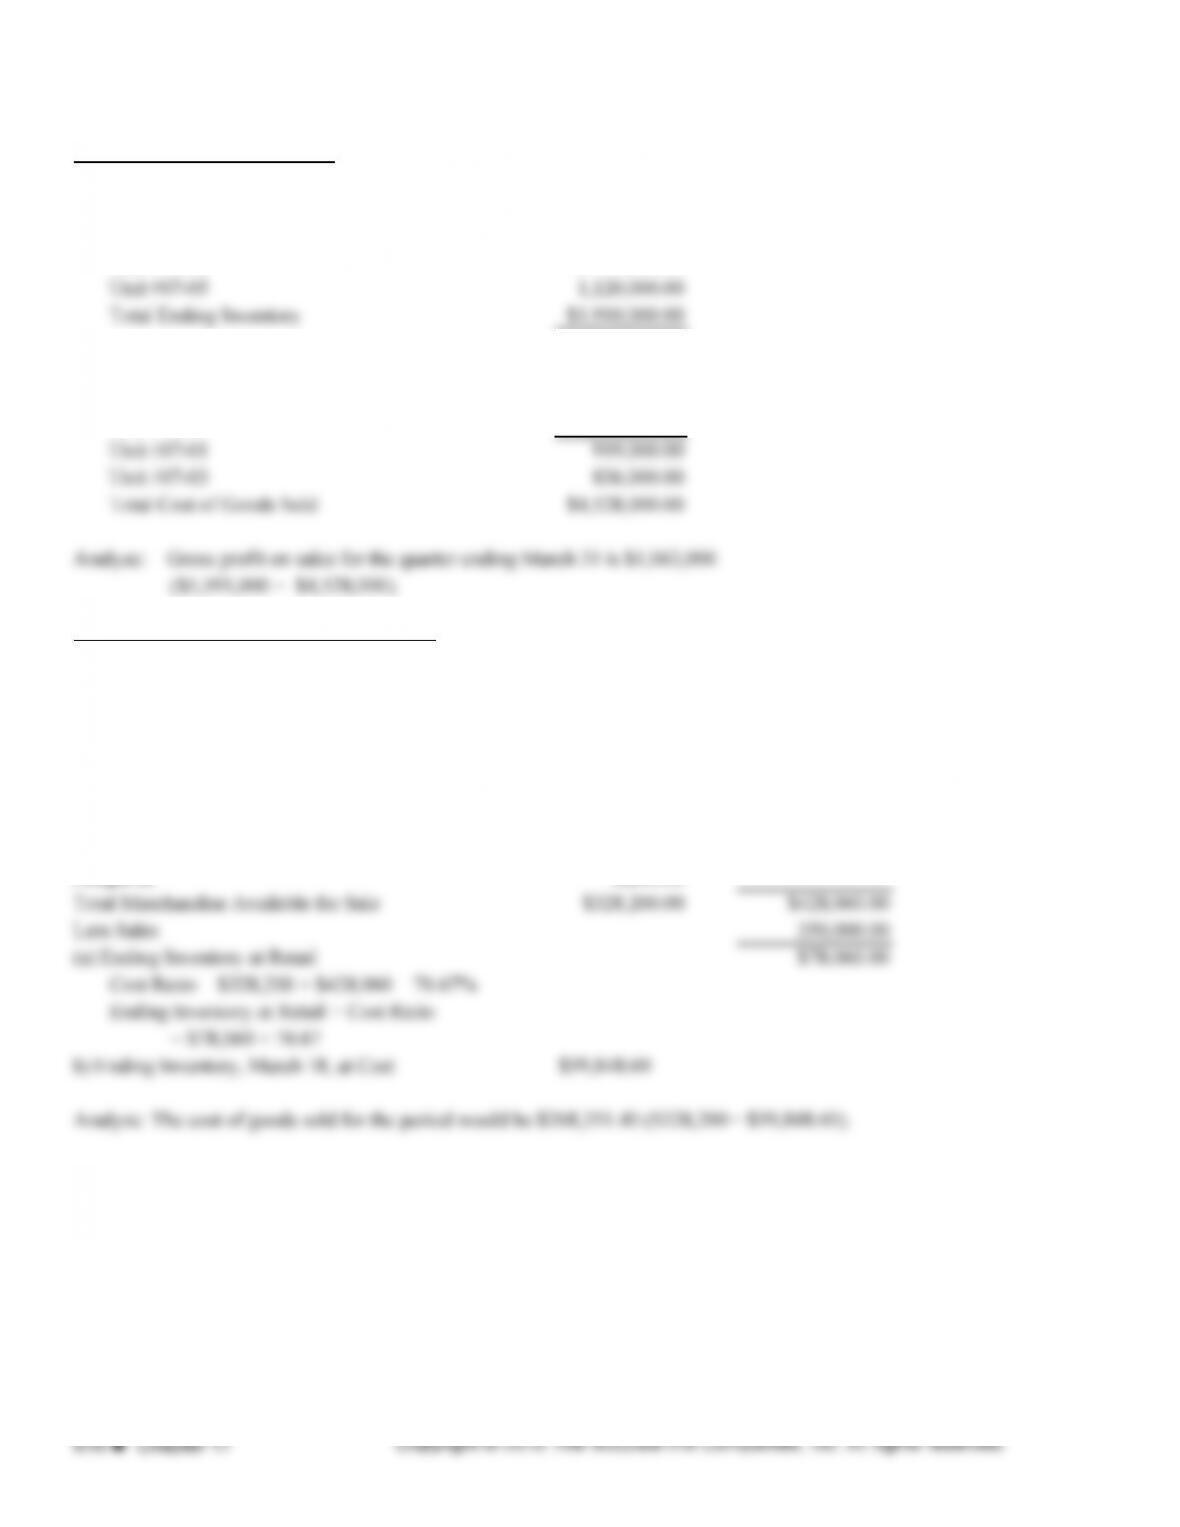
CRITICAL THINKING PROBLEM 17.2
The gross profit method may be employed. By examining the income statement for the past few years,
the rate of gross profit on sales and the percentage of cost of goods sold to sales can be determined for
those years. This rate can be applied to sales for the period from the first of the year to the date of the
fire to estimate cost of goods sold for that period. The cost of goods available for sale during the
period is available from records of beginning inventory, purchases, purchase returns and allowances,
freight in, etc. By subtracting the estimated cost of goods sold for the period from the cost of goods
available for sale, the estimated cost of ending inventory (inventory destroyed by the fire) can be
estimated.
SOLUTIONS TO BUSINESS CONNECTIONS
Managerial Focus:
2.
4.
6.
Ethical Dilemma:
Use the retail method to estimate inventory cost.
May perceive that the perpetual inventory system will require too much record keeping
and paperwork.
If strong inventory control systems are in place, the manager is probably correct. A
Nancy has been giving away baby clothes to her friends, thus reducing the inventory. No sales
Part A True-False
2. TRUE
4. FALSE
6. TRUE
8. TRUE
10. TRUE
12. FALSE
Part B Matching
1. d (markdown)
5. g (specific identification)
SOLUTIONS TO PRACTICE TEST