• Whole Foods operates 284 stores with an average store size of 37,000 square feet.
• The stores feature over 30,000 natural and organic items.
• To underscore the company’s focus on health, it recently created a new Core Company Value –
Promoting the health of our stakeholders through healthy eating education.
• Whole Foods employs 52,000 people in North America and the United Kingdom.
Managers can use financial statements to learn about a company’s operating efficiency by using ratios
and measurements to analyze the financial statement results and compare them to those measurements
of prior periods and to similar businesses in the same industry.
1. Other Revenue and Expense consists of items that are routine and recurring, but not properly included in
2. Operating expenses arise from the normal operating activities of the business. Financing expenses are
generally excluded from operating expenses and included in Other Revenues and Expenses.
4. It shows the firm’s financial position on a specific date through a presentation of the assets, liabilities
and owner’s equity.
5. Cash, items that will be converted into cash within one year, and items that will be used up within one
7. It reports the beginning and ending owner’s equity and the changes that occurred in owner’s equity
during the year.
8. a. Ending merchandise inventory is shown in both the income statement and the balance sheet.
Note to instructor : These questions are designed to check students’ understanding of new terms, concepts, and
procedures presented in the chapter.
Discussion Questions
Chapter Opener: Thinking Critically
FINANCIAL STATEMENTS AND CLOSING PROCEDURES
CHAPTER 13
Students should realize information such as stock prices, dividend earnings, net income, gross profit, net sales,
and changes in stockholders’ equity are all indicators of the financial strength of a company.
Fast Facts
Managerial Implications: Thinking Critically
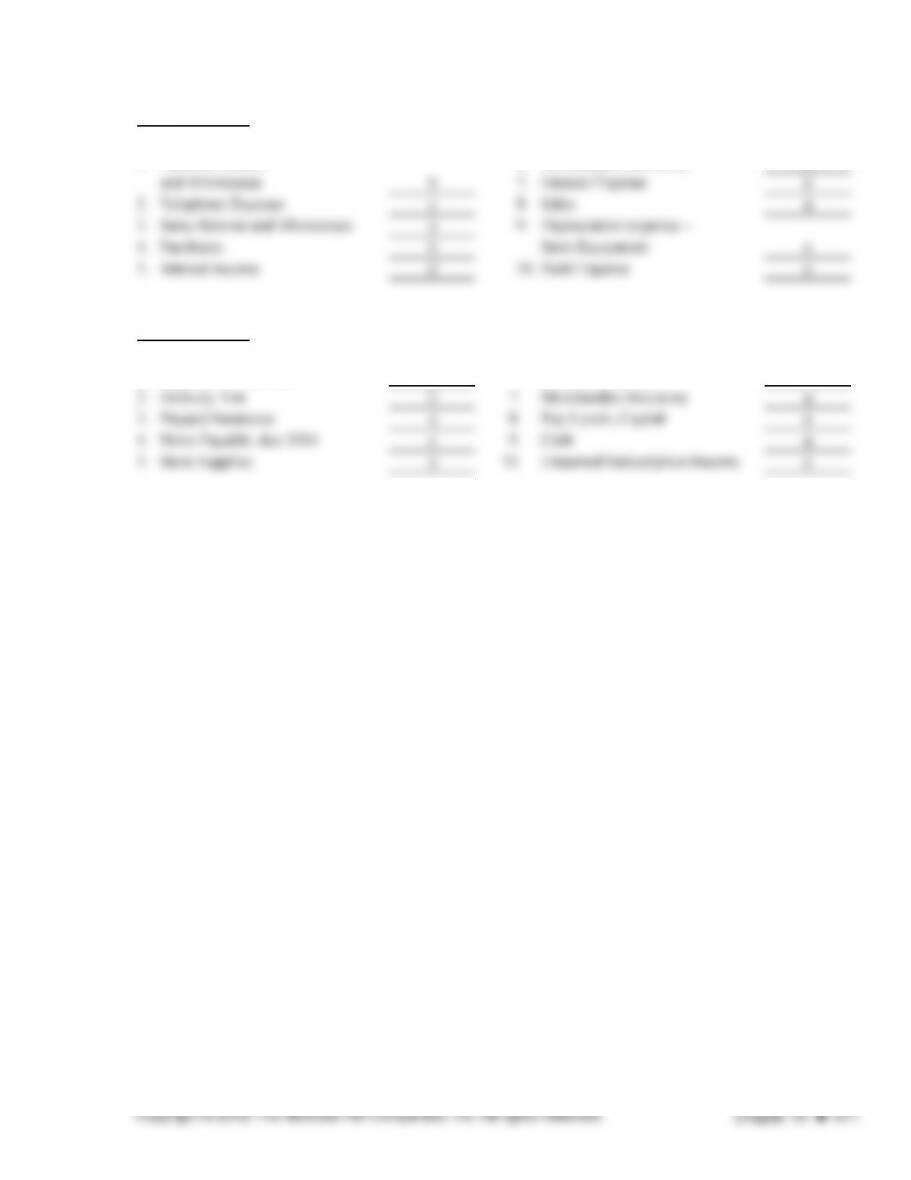
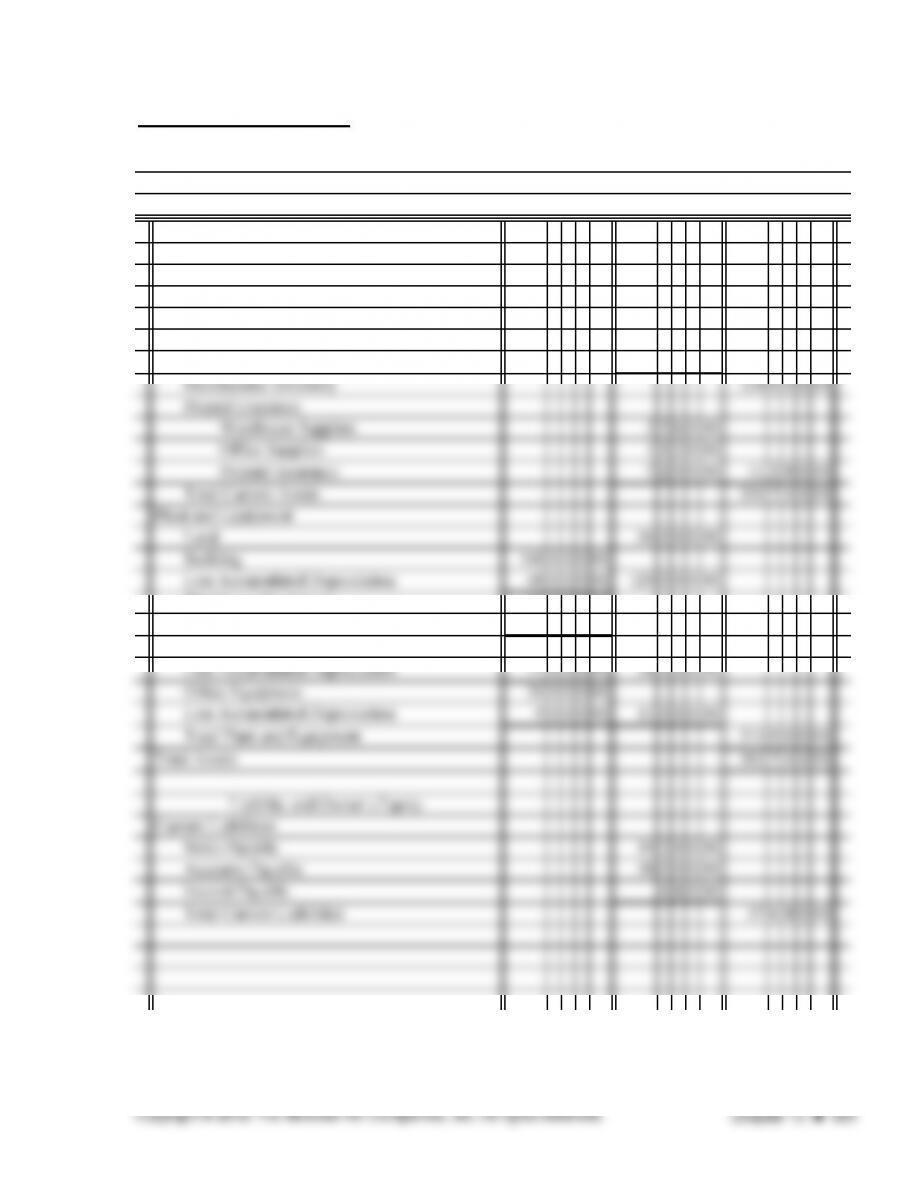
EXERCISE 13.1
1. Purchase returns 6. Merchandise Inventory b
EXERCISE 13.2
1. Accounts Receivable a 6. Accounts Payable c
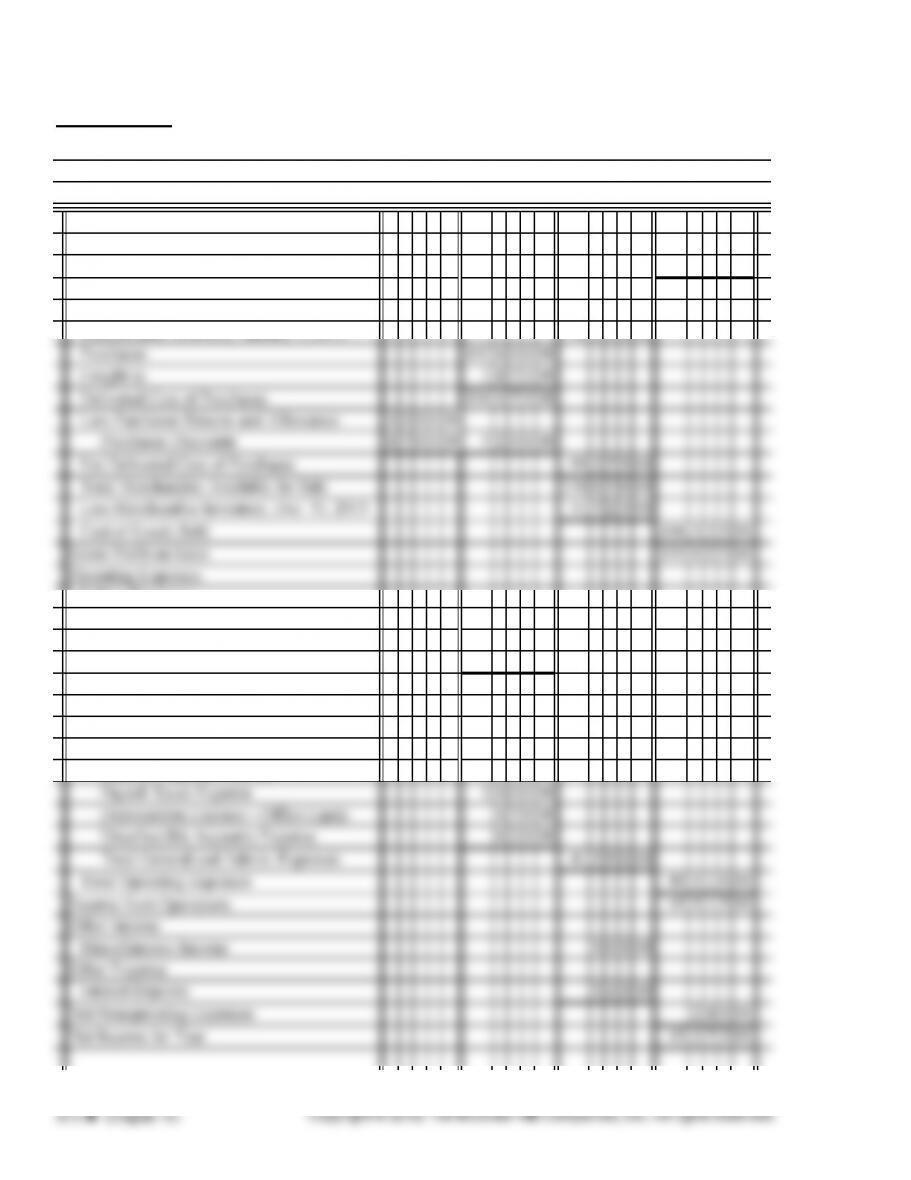
EXERCISE 13.3
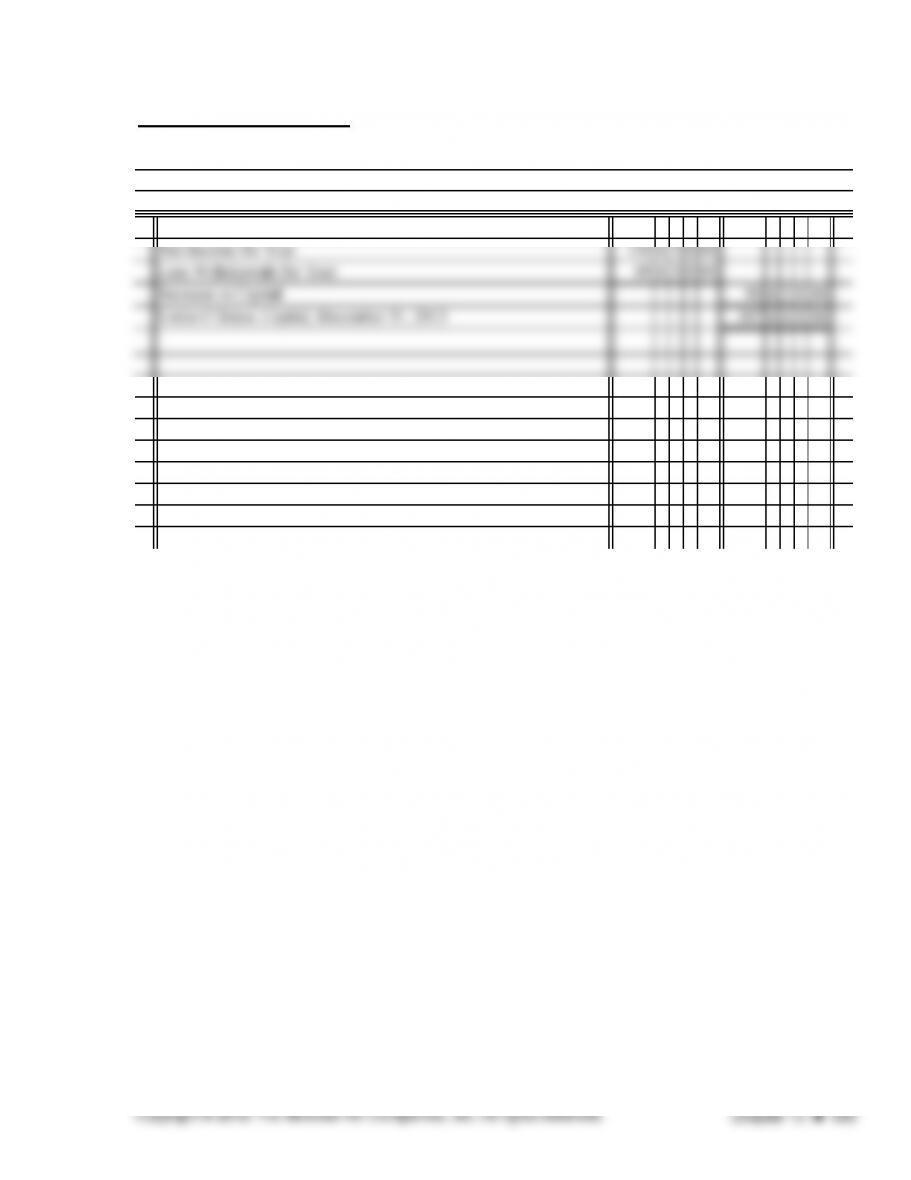
Operating Revenue
Sales 245 6 0 0 00
Less Sales Returns and Allowance 4 2 5 0 00
Net Sales 241 3 5 0 00
Cost of Goods Sold
Merchandise Inventory, January 1, 2013 5877500
Selling Expenses
Salaries Expense—Sales 4430000
Store Supplies Expense 221000
Depreciation Expense—Store Equip. 141000
Total Selling Expense 4792000
General and Administrative Expenses
Rent Expense 1250000
Utilities Expense 290000
Salaries Expense—Office 2010000
Alec’s Office Su
pp
lies
Income Statement
Year Ended December 31, 2013
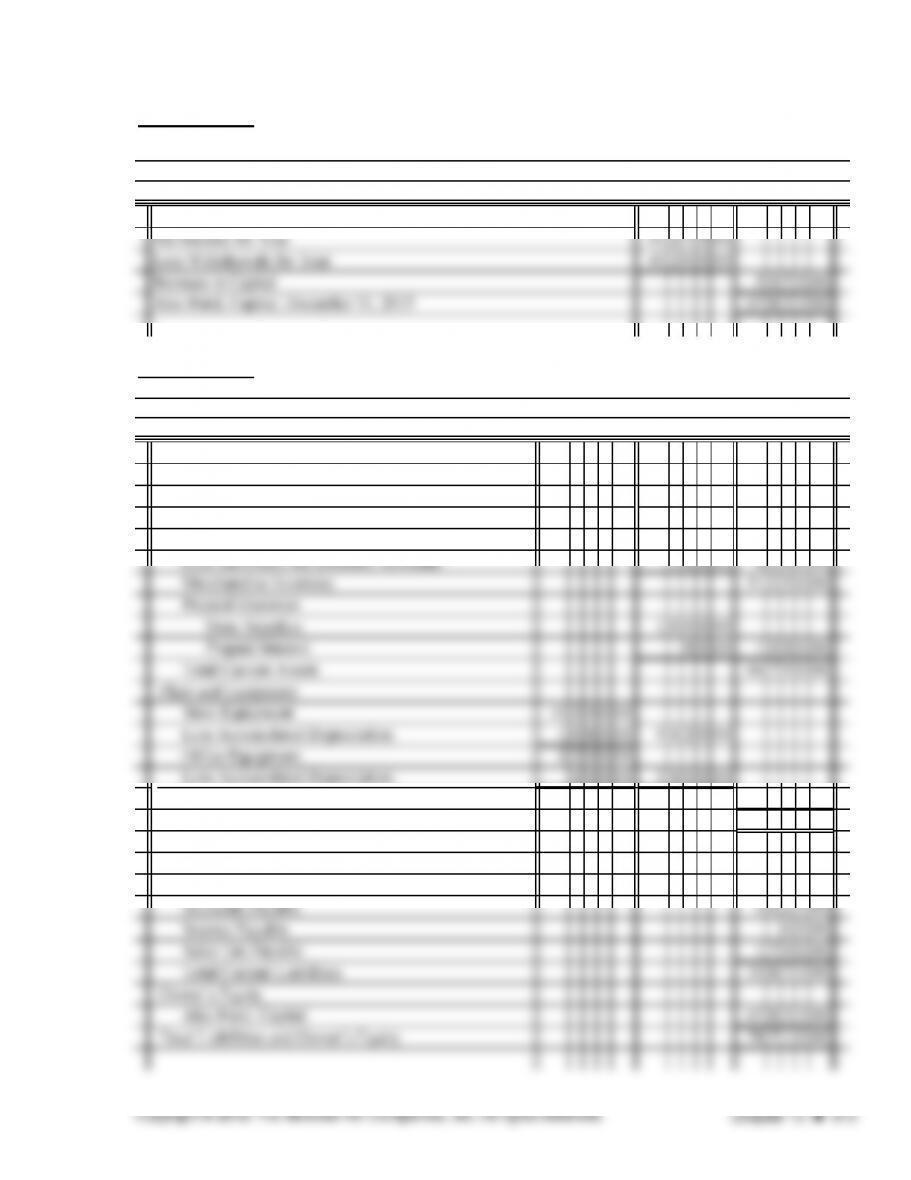
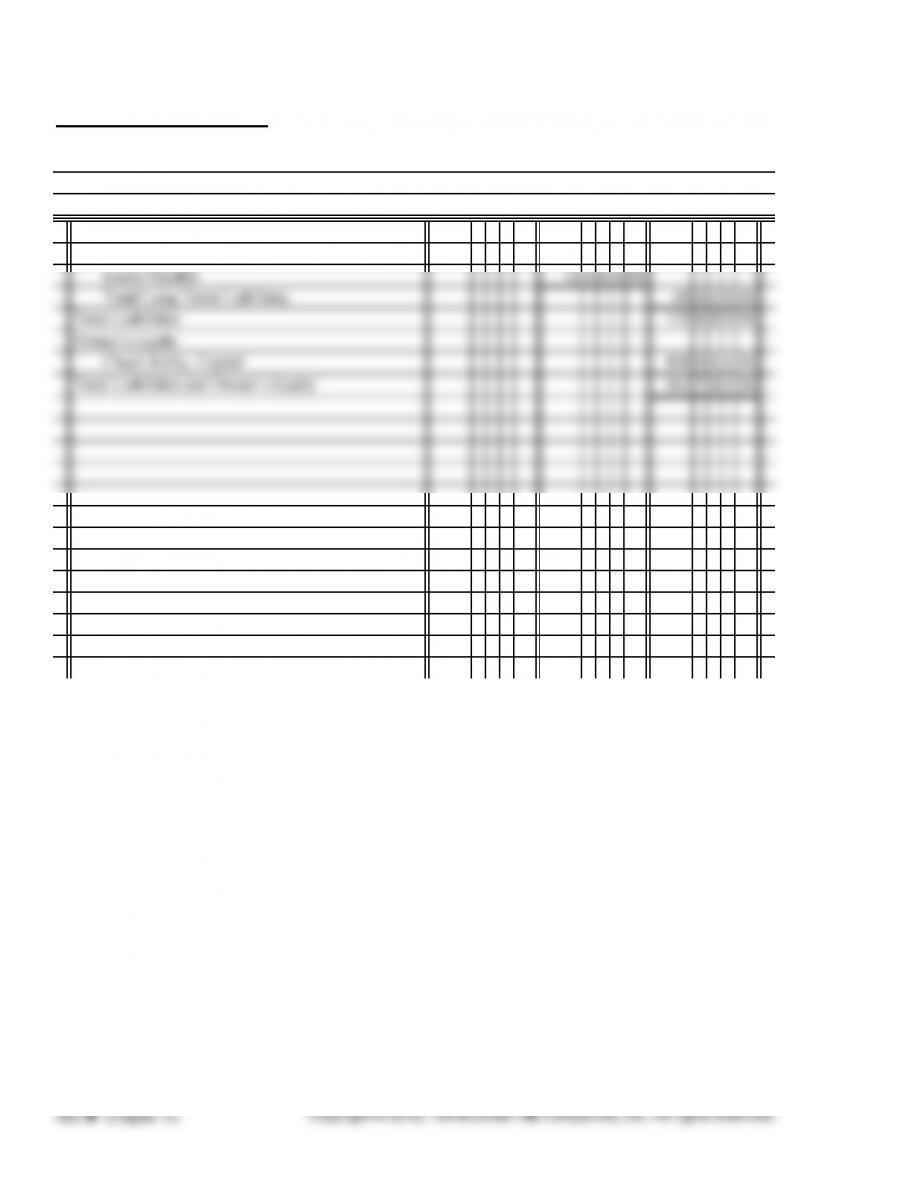
EXERCISE 13.4
6276000
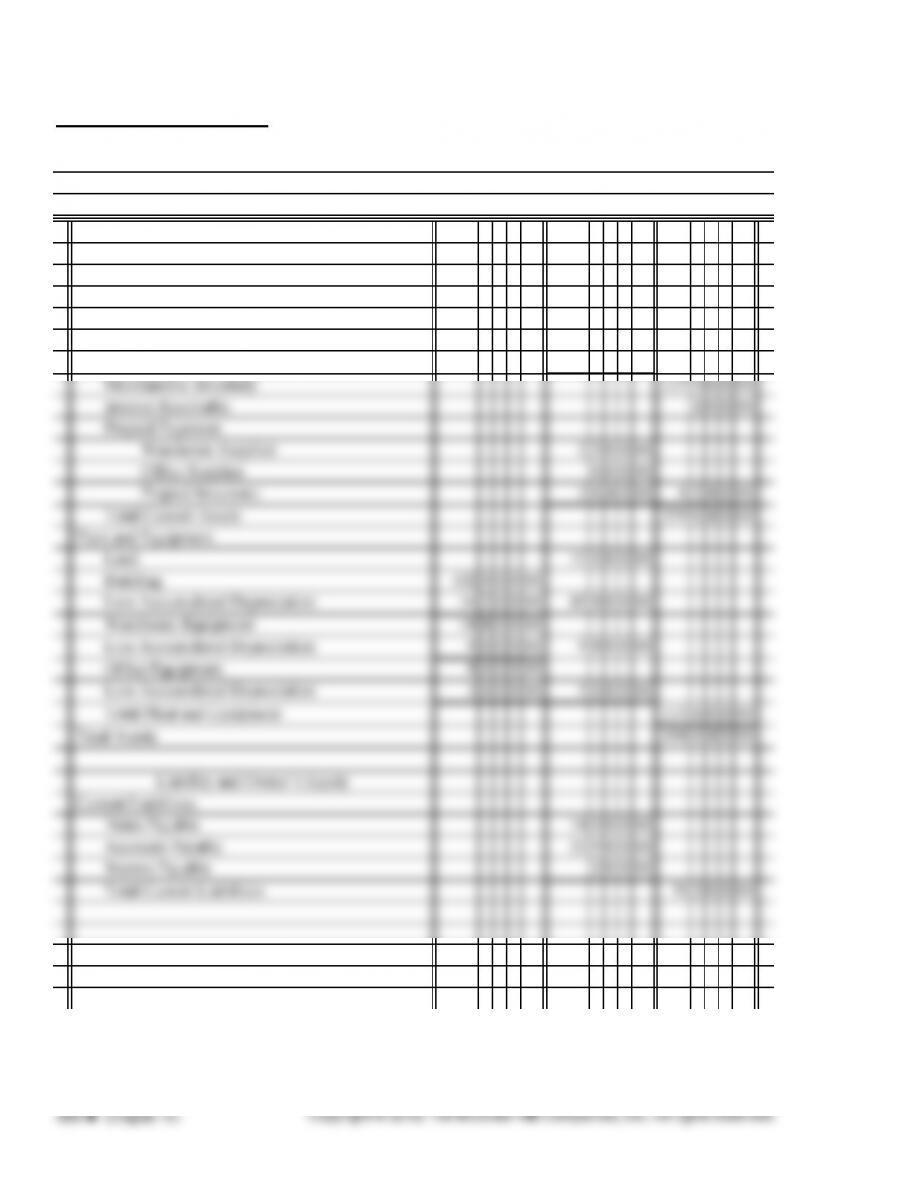
EXERCISE 13.5
Current Assets
Cash 978000
Change Fund 4 0 0 00
Accounts Receivable 504000
Total Plant and Equipment 1192000
Total Assets 7871000
Current Liabilities
Notes Payable 540000
Balance Sheet
December 31
,
2013
Statement of Owner’s E
q
uit
y
Year Ended December 31, 2013
Liabilities and Owner’s Equity
Alec Patel, Capital, January 1, 2013
Alec’s Office Su
pp
lies
Assets
Alec’s Office Su
pp
lies
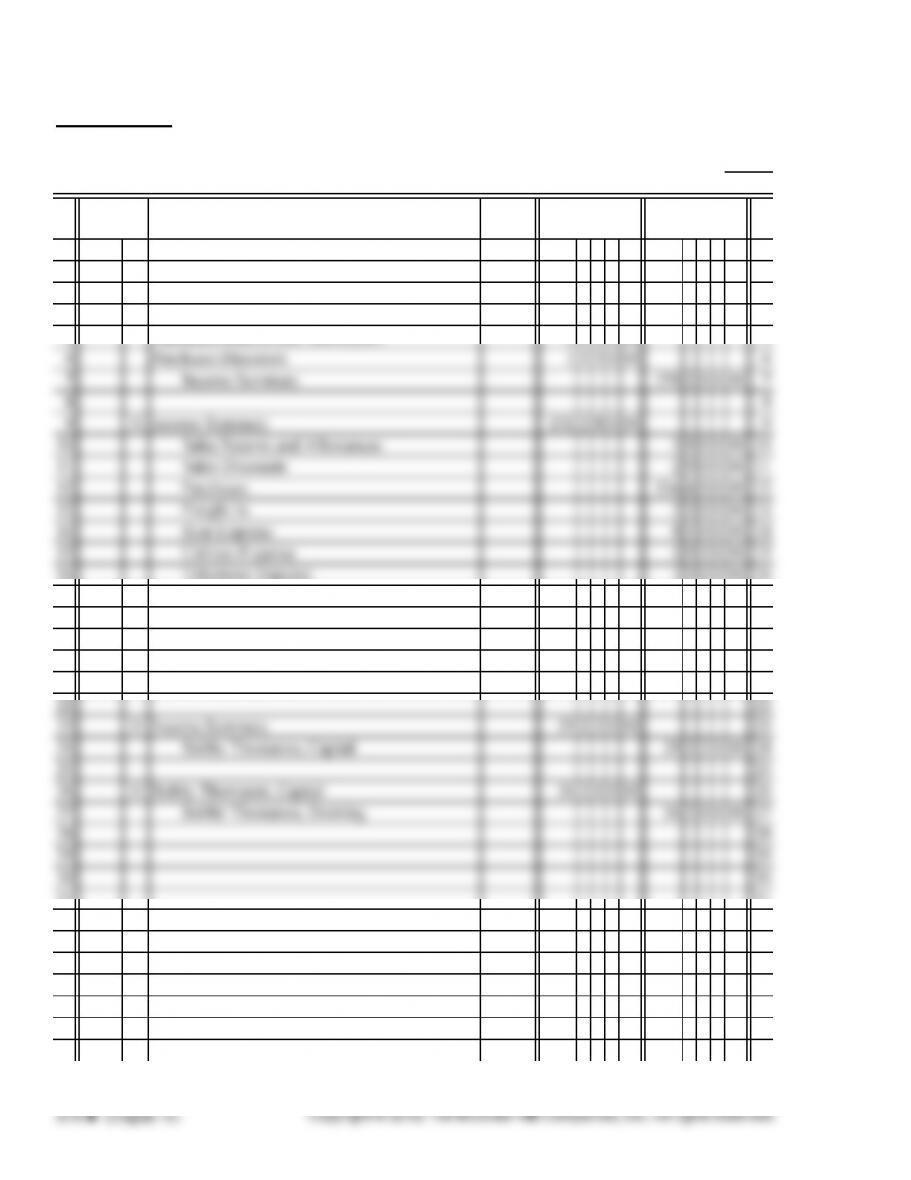
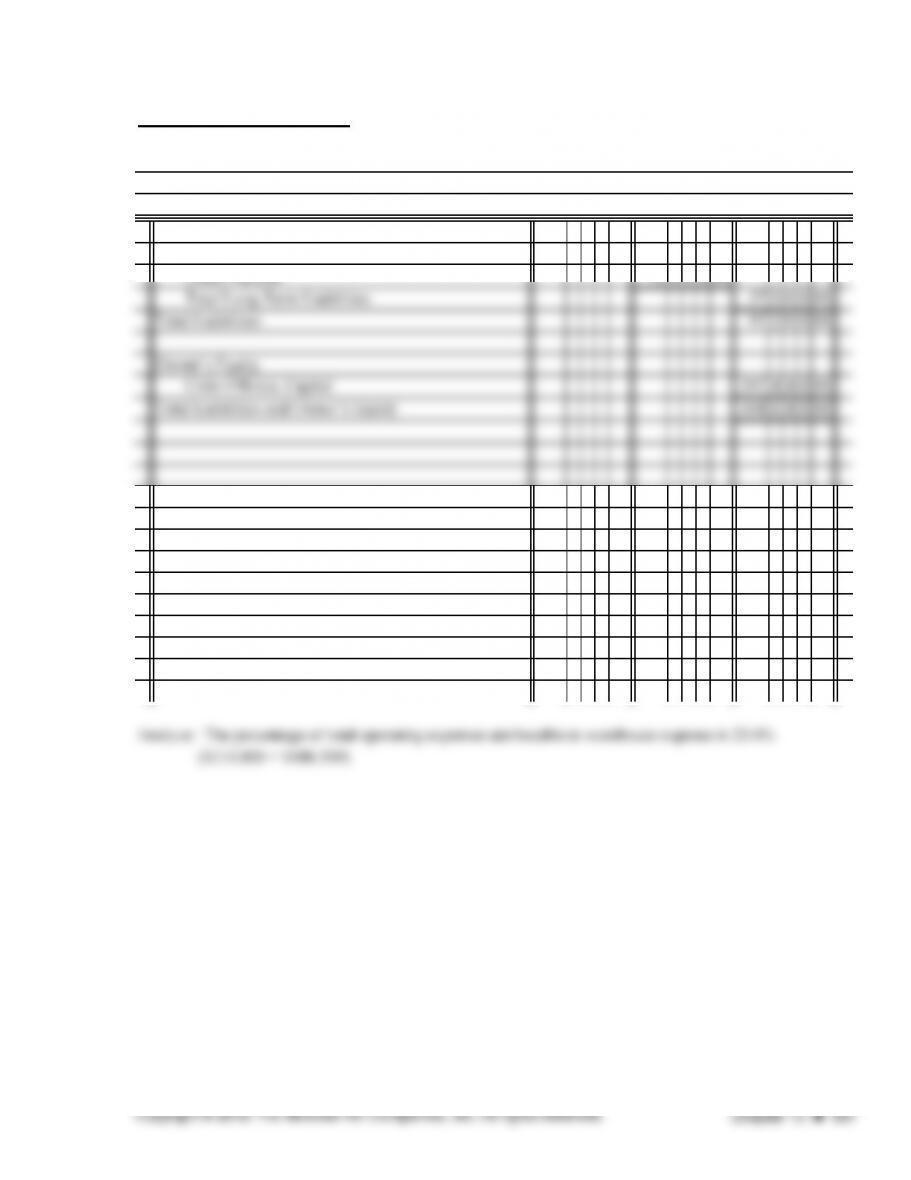
EXERCISE 13.6
POST.
REF.
1 1
2 2013 2
3 Dec. 31 Sales 254 5 0 0 00 3
4 Interest Income 1 7 0 00 4
5 Purchases Returns and Allowances 2 0 0 0 00 5
16 Telephone Expense 154000 16
17 Salaries Expense 6610000 17
18 Payroll Taxes Expense 527000 18
19 Supplies Expense 170000 19
20 Depreciation Expense 250000 20
21 Interest Expense 3 4 0 00 21
31 31
32 32
33 33
34 34
35 35
36 36
37 37
DEBIT CREDIT
Closing Entries
16
DATE DESCRIPTION
GENERAL JOURNAL PAGE
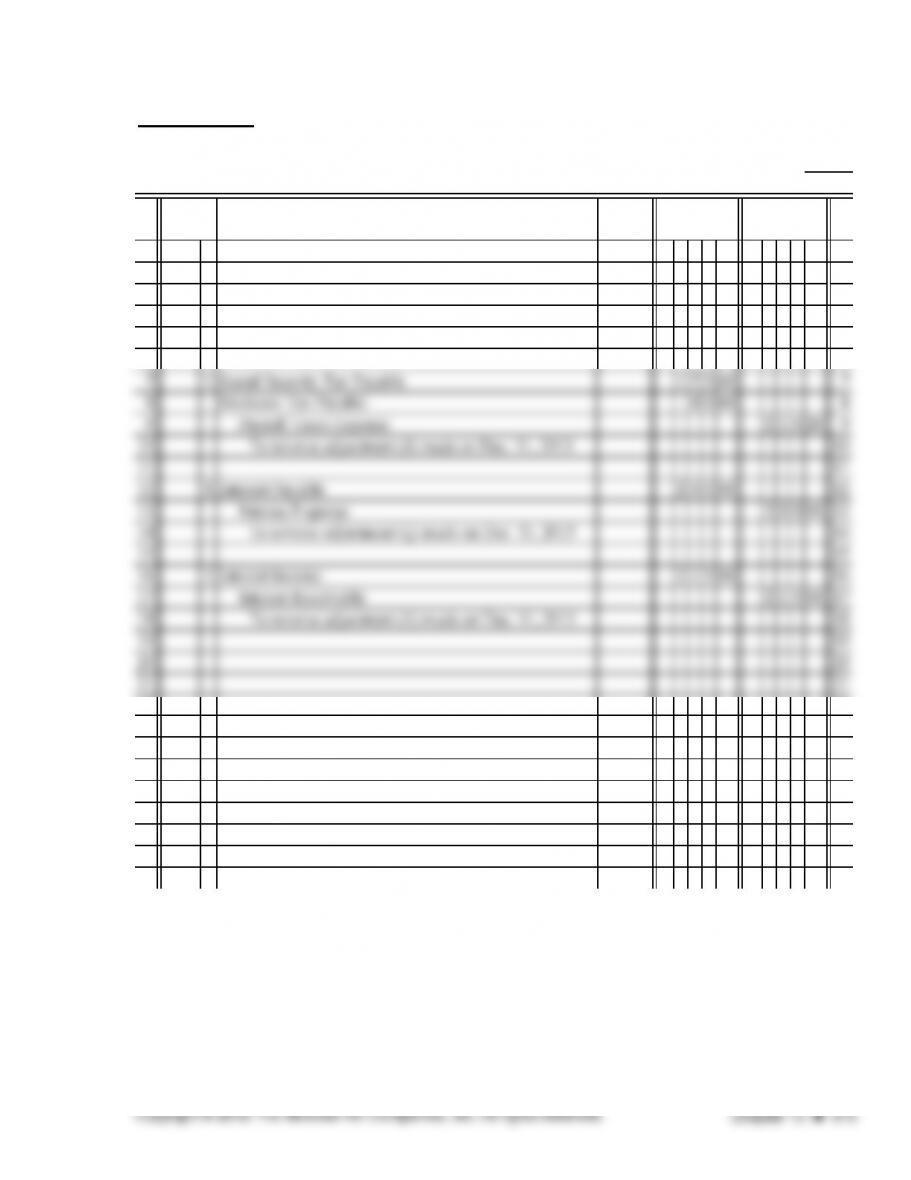
EXERCISE 13.7
P
AGE
POST.
REF.
1 1
2 2014 2
3 Jan. 1 Salaries Payable 2 8 0 0 00 3
4 Salaries Expense—Office 2 8 0 0 00 4
5 To reverse adjustment (e) made on Dec. 31, 2013 5
6 6
22 22
23 23
24 24
25 25
26 26
27 27
28 28
29 29
30 30
DEBIT CREDIT
Reversing Entries
21
DATE DESCRIPTION
GENERAL JOURNAL
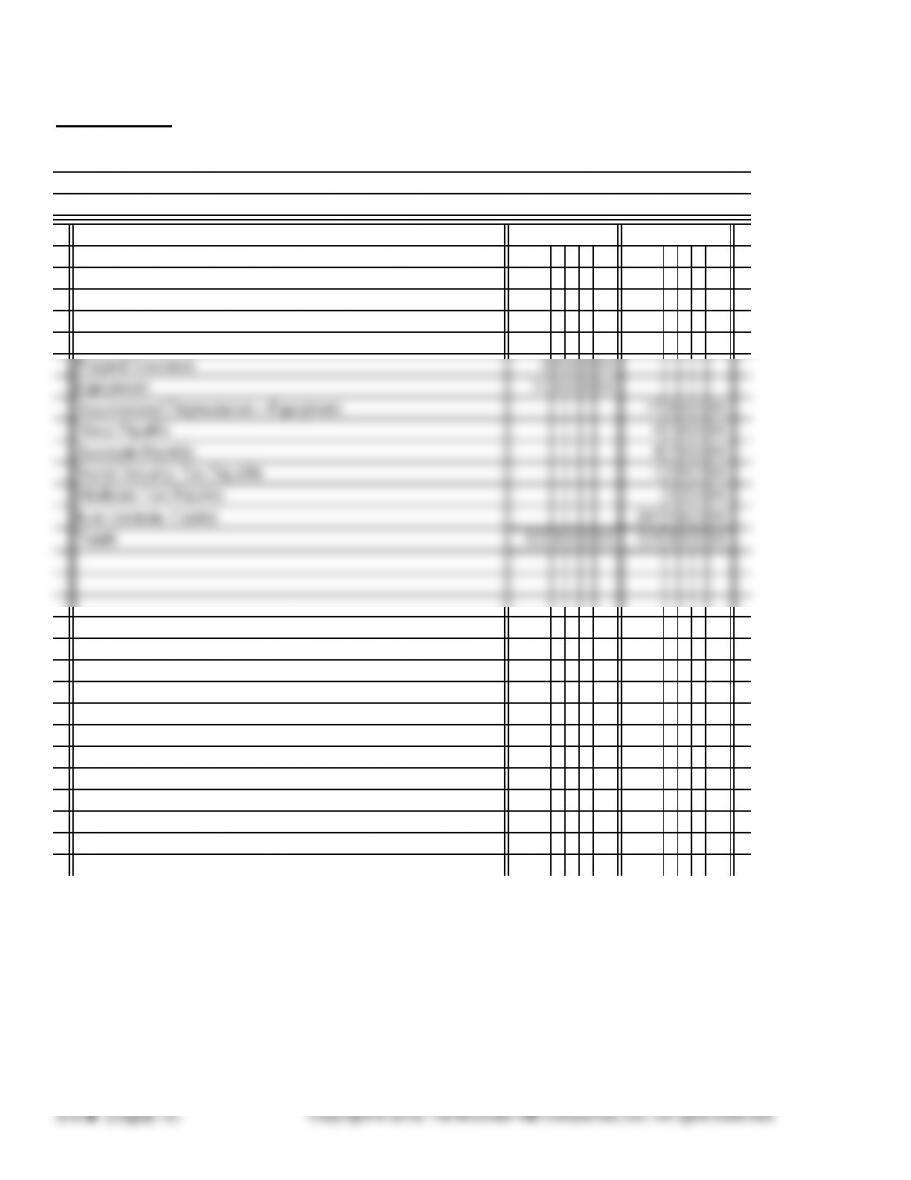
EXERCISE 13.8
Cash 1860000
Accounts Receivable 5980000
Allowance for Doubtful Accounts 1 2 0 00
Merchandise Inventory 18620000
Supplies 714000
Harmon Farm Supply
Post-closing Trial Balance
December 31, 2013
ACCOUNT NAME DEBIT CREDIT
EXERCISE 13.9
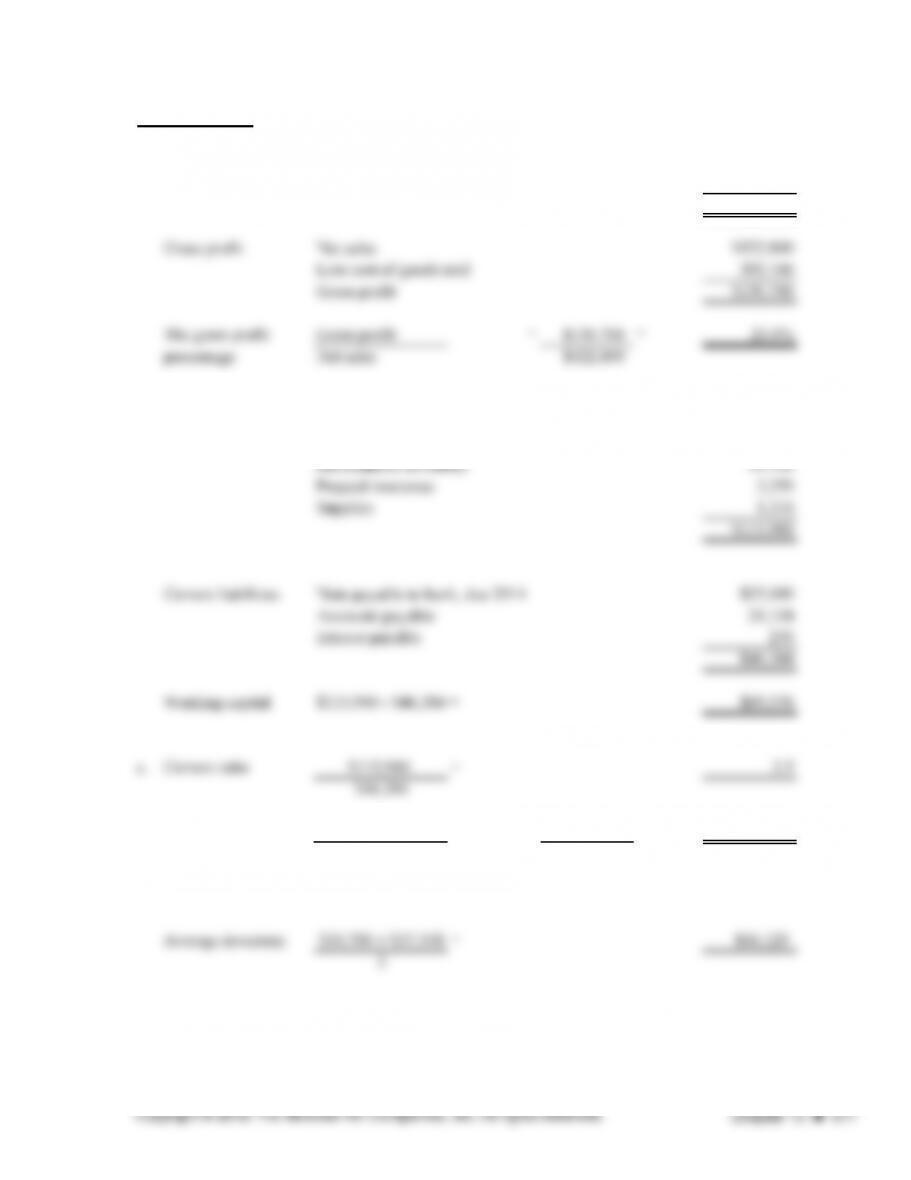
a. Net Sales Sales $525,000
Less Sales Discounts 2,200
Net Sales $522,800
b. Current assets Cash $22,500
Accounts receivable 46,700
Note receivable, due 2014 8,500
d. Inventory Cost of goods sold $392,100 8.5 times
turnover Average inventory $46,129
Average inventory $34,700 + $57,558 $46,129
2
=
==
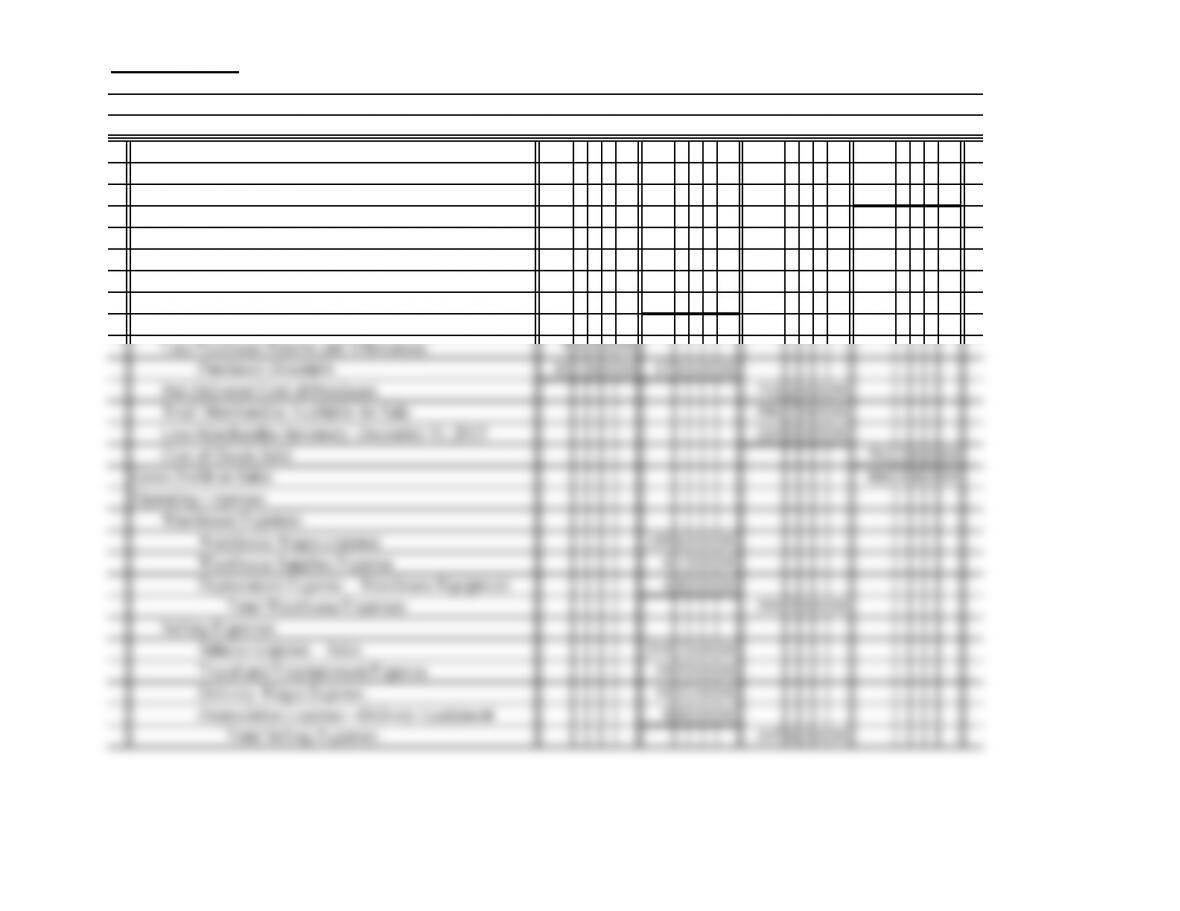
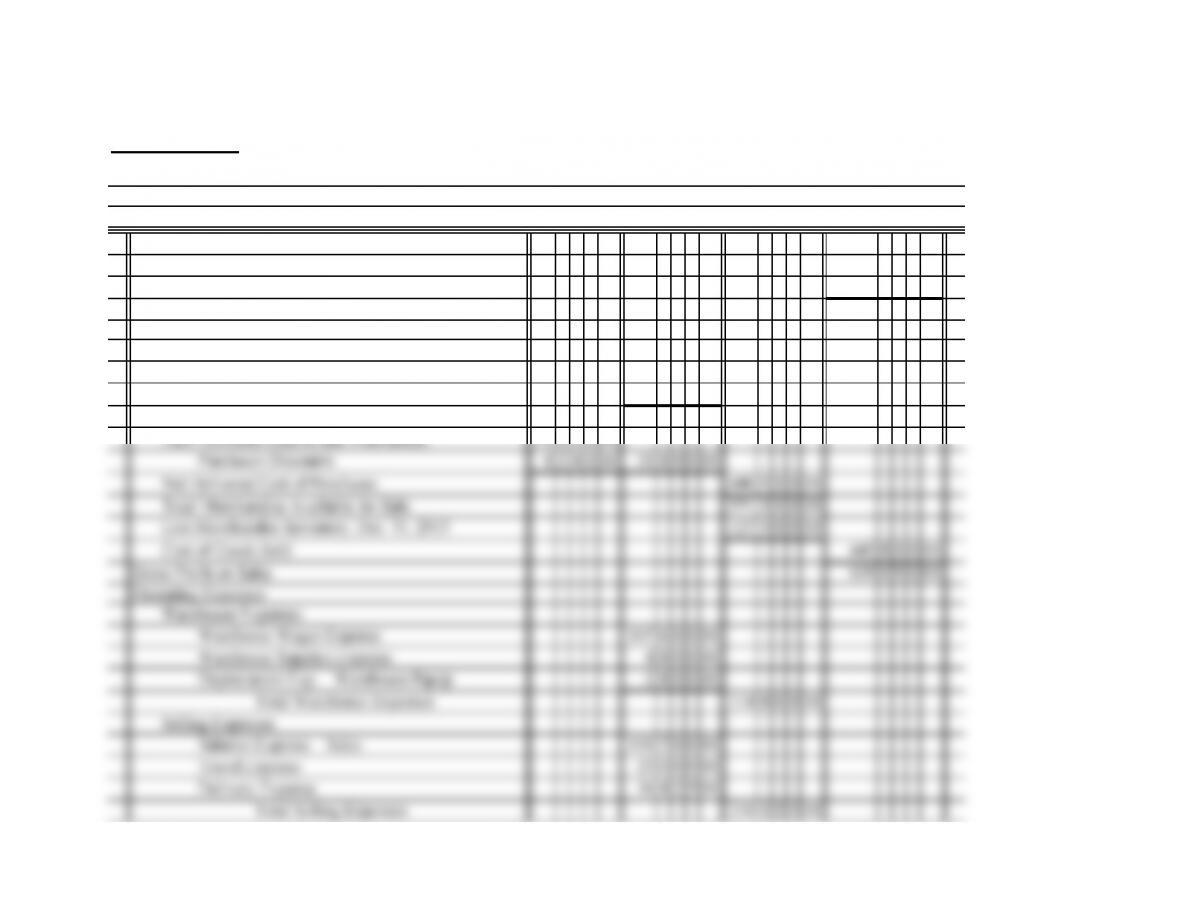
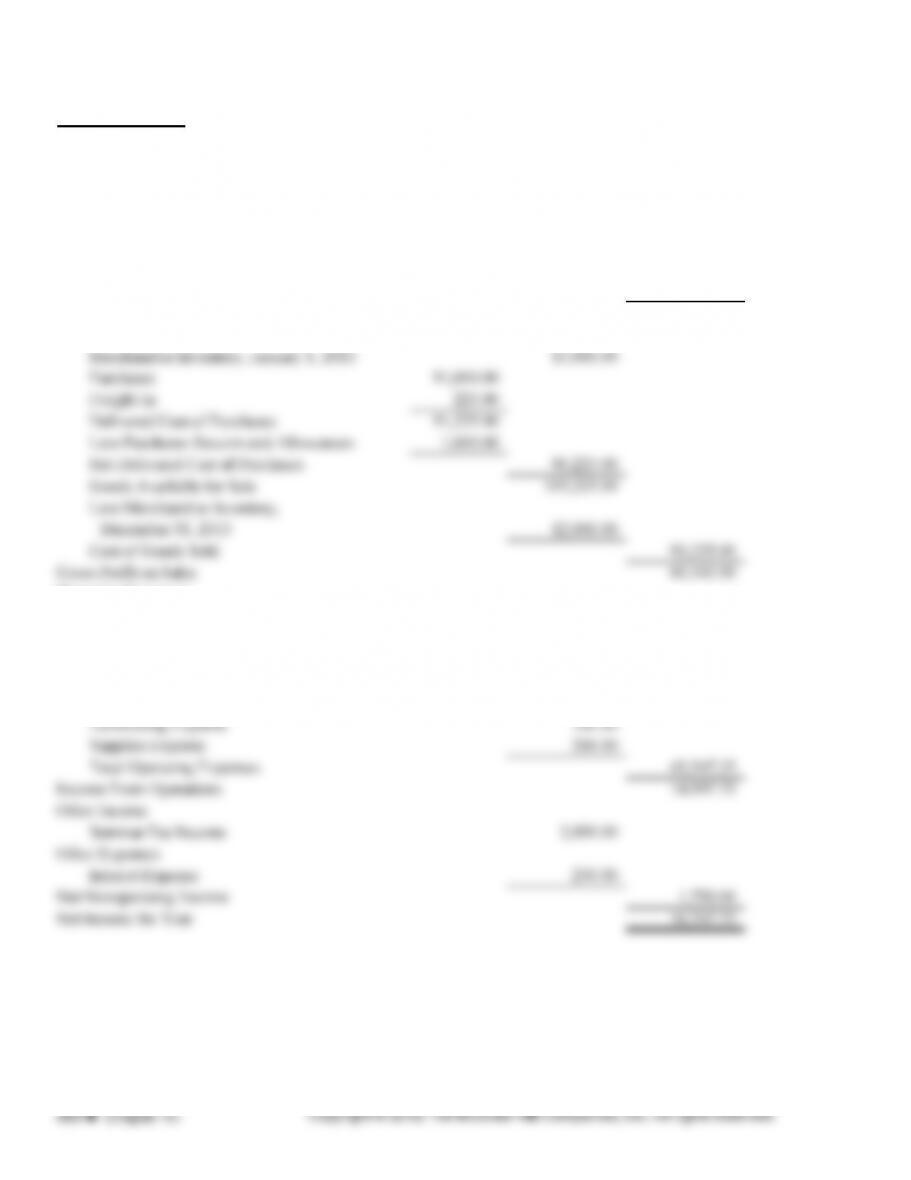
PROBLEM 13.1A
Operating Revenue
Sales 1,66588400
Less Sales Returns and Allowances 1720000
Net Sales 1,64868400
Cost of Goods Sold
Merchandise Inventory, January 1, 2013 23400000
Purchases 75700000
Freight In 1280000
Delivered Cost of Purchases 76980000
Income Statement
Year Ended December 31, 2013
Wood Desi
g
n Com
p
an
y
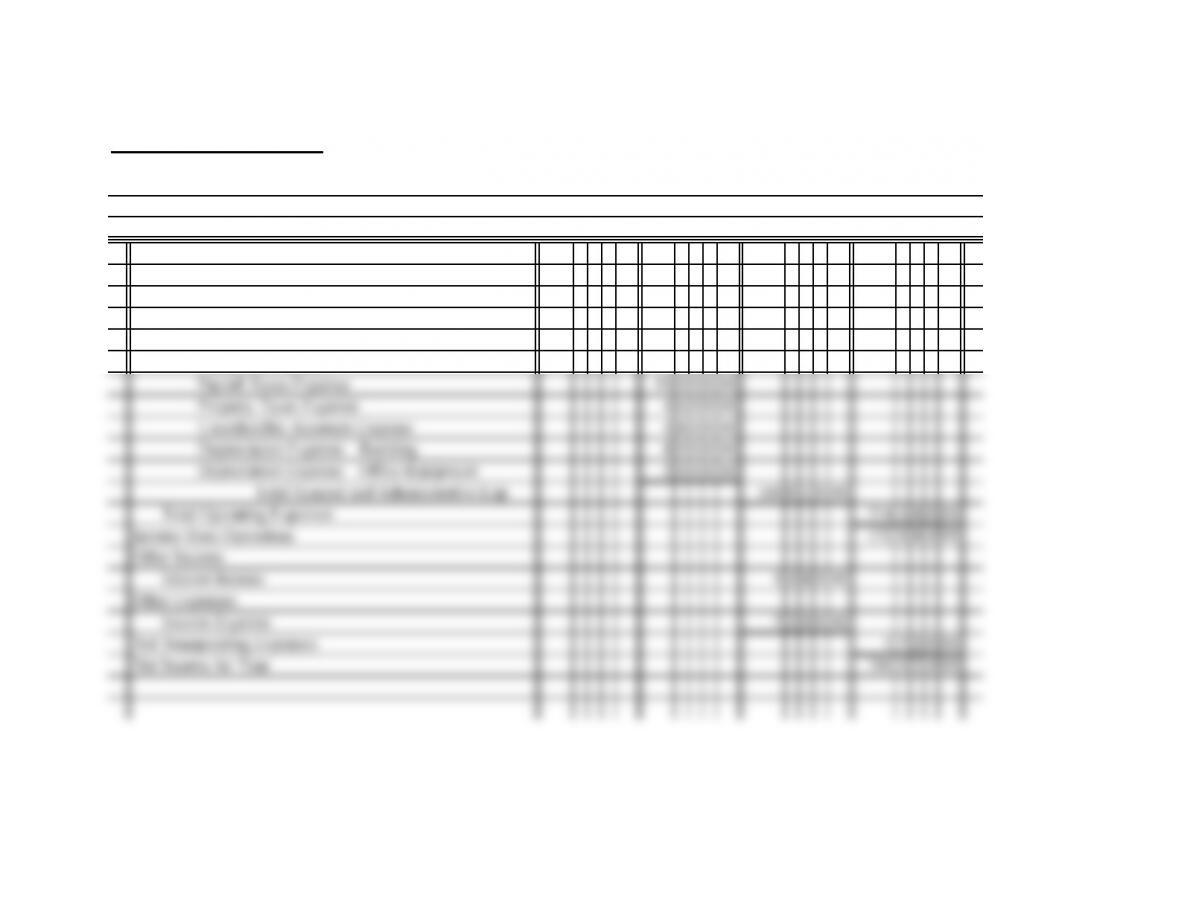
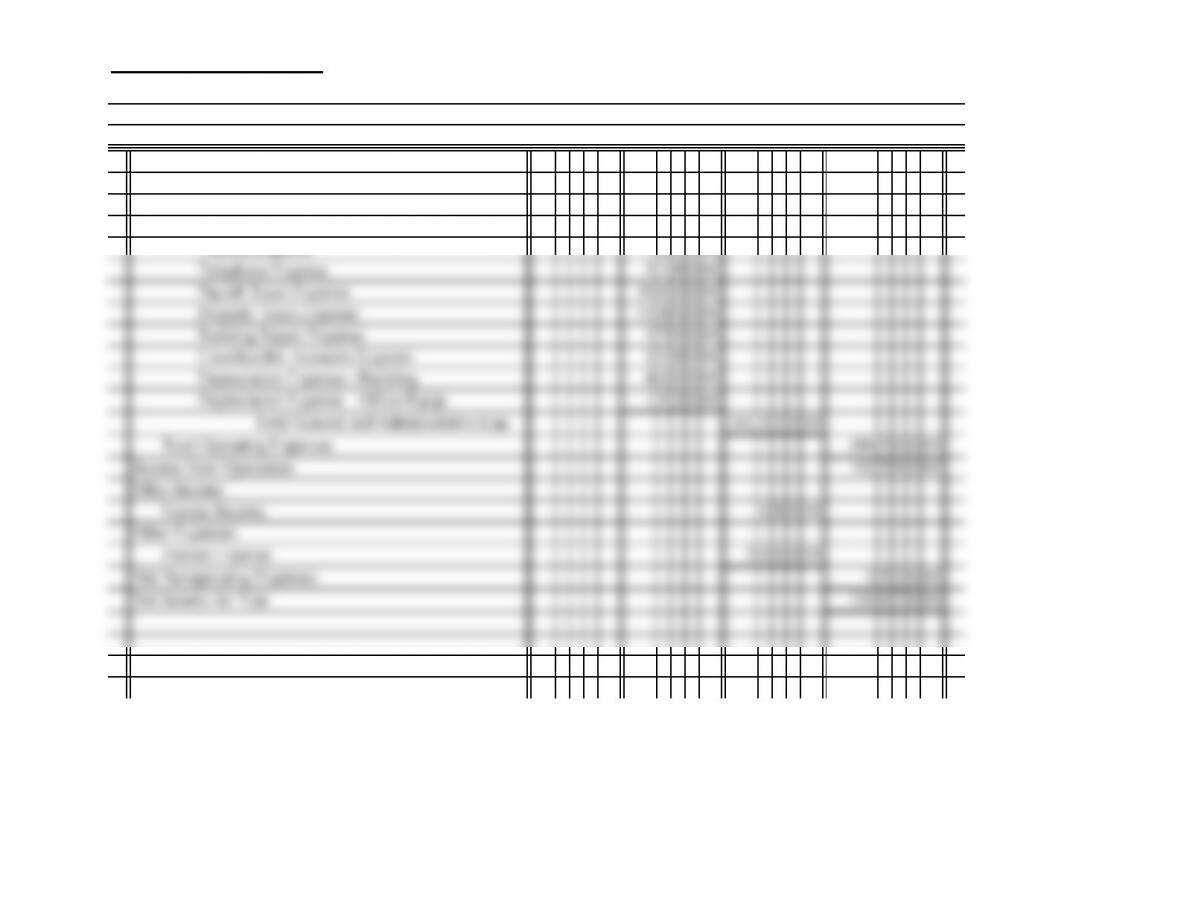
PROBLEM 13.1A (continued)
General and Administrative Expenses
Salaries Expense—Office 6960000
Office Supplies Expense 300000
Insurance Expense 520000
Utilities Expense 829000
Telephone Expense 552000
Wood Desi
g
n Com
p
an
y
Income Statement (continued)
Year Ended December 31, 2013
PROBLEM 13.1A (continued)
Chuck Kirby, Capital, January 1, 2013 39764000
Wood Design Company
Statement of Owner’s Equity
Year Ended December 31, 2013
PROBLEM 13.1A (continued)
Current Assets
Cash 2310000
Petty Cash Fund 4 0 0 00
Notes Receivable 1080000
Accounts Receivable 8616400
Less Allowance for Doubtful Accounts 500000 8116400
Warehouse Equipment 3200000
Less Accumulated Depreciation 1440000 1760000
Delivery Equipment 4600000
Current Liabilities
Notes Payable 1920000
Accounts Payable 3800000
Interest Payable 4 8 0 00
Total Current Liabilities 5768000
Wood Design Company
Balance Sheet
December 31, 2013
Assets
PROBLEM 13.1A (continued)
Long-Term Liabilities
Mortgage Payable 5600000
Analyze: The company’s current ratio is 6.08 to 1 ($350,744 ÷ $57,680).
Wood Design Company
Balance Sheet (continued)
December 31, 2013
PROBLEM 13.2A
Operating Revenue
Sales 1,09030000
Less Sales Returns and Allowances 740000
Net Sales 1,08290000
Cost of Goods Sold
Merchandise Inventory, January 1, 2013 13040000
Purchases 45300000
Freight In 880000
Delivered Cost of Purchases 46180000
Income Statement
Year Ended December 31, 2013
Good to Go Auto Products
PROBLEM 13.2A (continued)
General and Administrative Expenses
Salaries Expense—Office 8400000
Office Supplies Expense 112000
Insurance Expense 887500
Utilities Expense 700000
Good to Go Auto Products
Income Statement (continued)
Year Ended December 31, 2013
PROBLEM 13.2A (continued)
Colin O’Brien, Capital, January 1, 2013 31702000
Good to Go Auto Products
Statement of Owner’s Equity
Year Ended December 31, 2013
PROBLEM 13.2A (continued)
Current Assets
Cash 9800000
Petty Cash Fund 5 0 0 00
Notes Receivable 1000000
Accounts Receivable 13920000
Less Allowance for Doubtful Accounts 280000 13640000
Current Liabilities
Notes Payable 1400000
Accounts Payable 5590000
Interest Payable 3 0 0 00
Total Current Liabilities 7020000
Good to Go Auto Products
Balance Sheet
December 31, 2013
Assets
PROBLEM 13.2A (continued)
Long-Term Liabilities
Mortgage Payable 1500000
Loans Payable 1200000
Good to Go Auto Products
Balance Sheet (continued)
December 31, 2013
PROBLEM 13.3A
Operating Revenue
Sales 153,970.00
Less Sales Discount 200.00
Net Sales 153,770.00
Cost of Goods Sold
Operating Expenses
Rent Expense 13,200.00
Wages Expense 24,500.00
Payroll Taxes Expense 3,362.25
Depreciation Expense, Store Equipment 3,125.00
Depreciation Expense, Office Equipment 1,000.00
The Wine Shop
Income Statement
Year Ended December 31, 2013