Chapter 08S – The Transportation Model
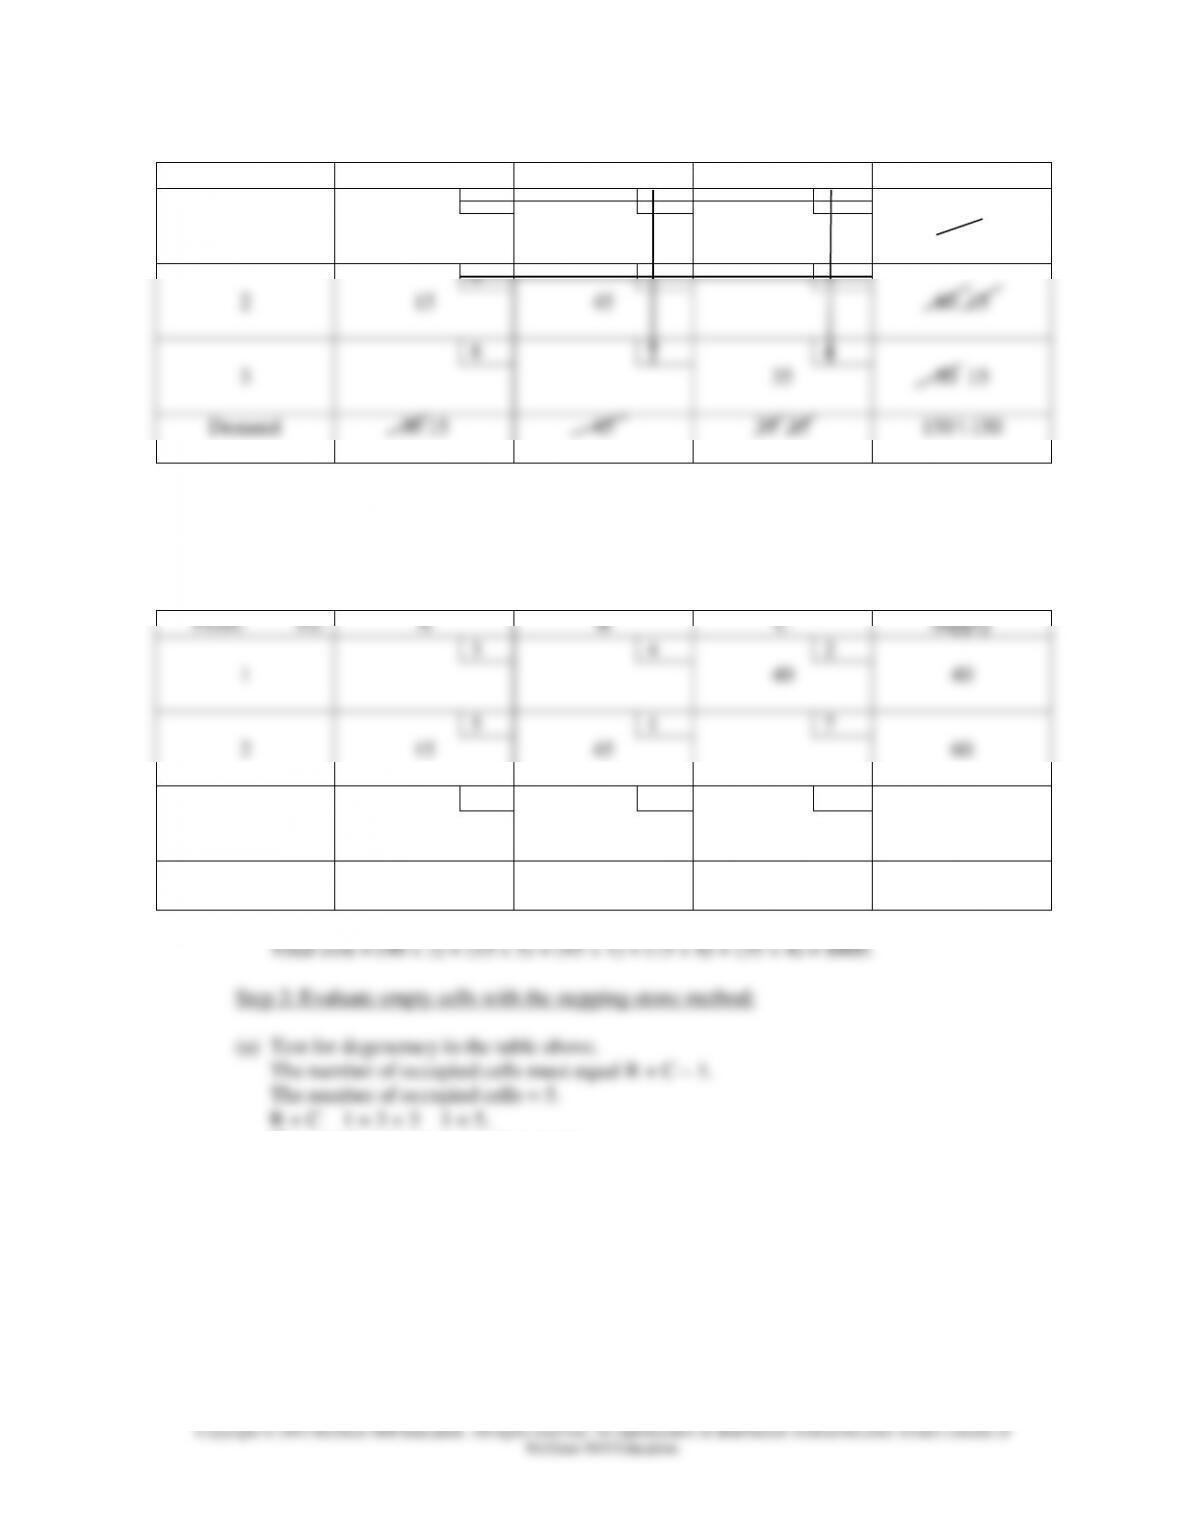
(g) Test for degeneracy in the table above.
The number of occupied cells must equal R + C – 1.
The number of occupied cells = 5.
R + C – 1 = 3 + 3 – 1 = 5.
Chapter 08S – The Transportation Model
(i) Evaluate the empty cells using the following formula:
Chapter 08S – The Transportation Model
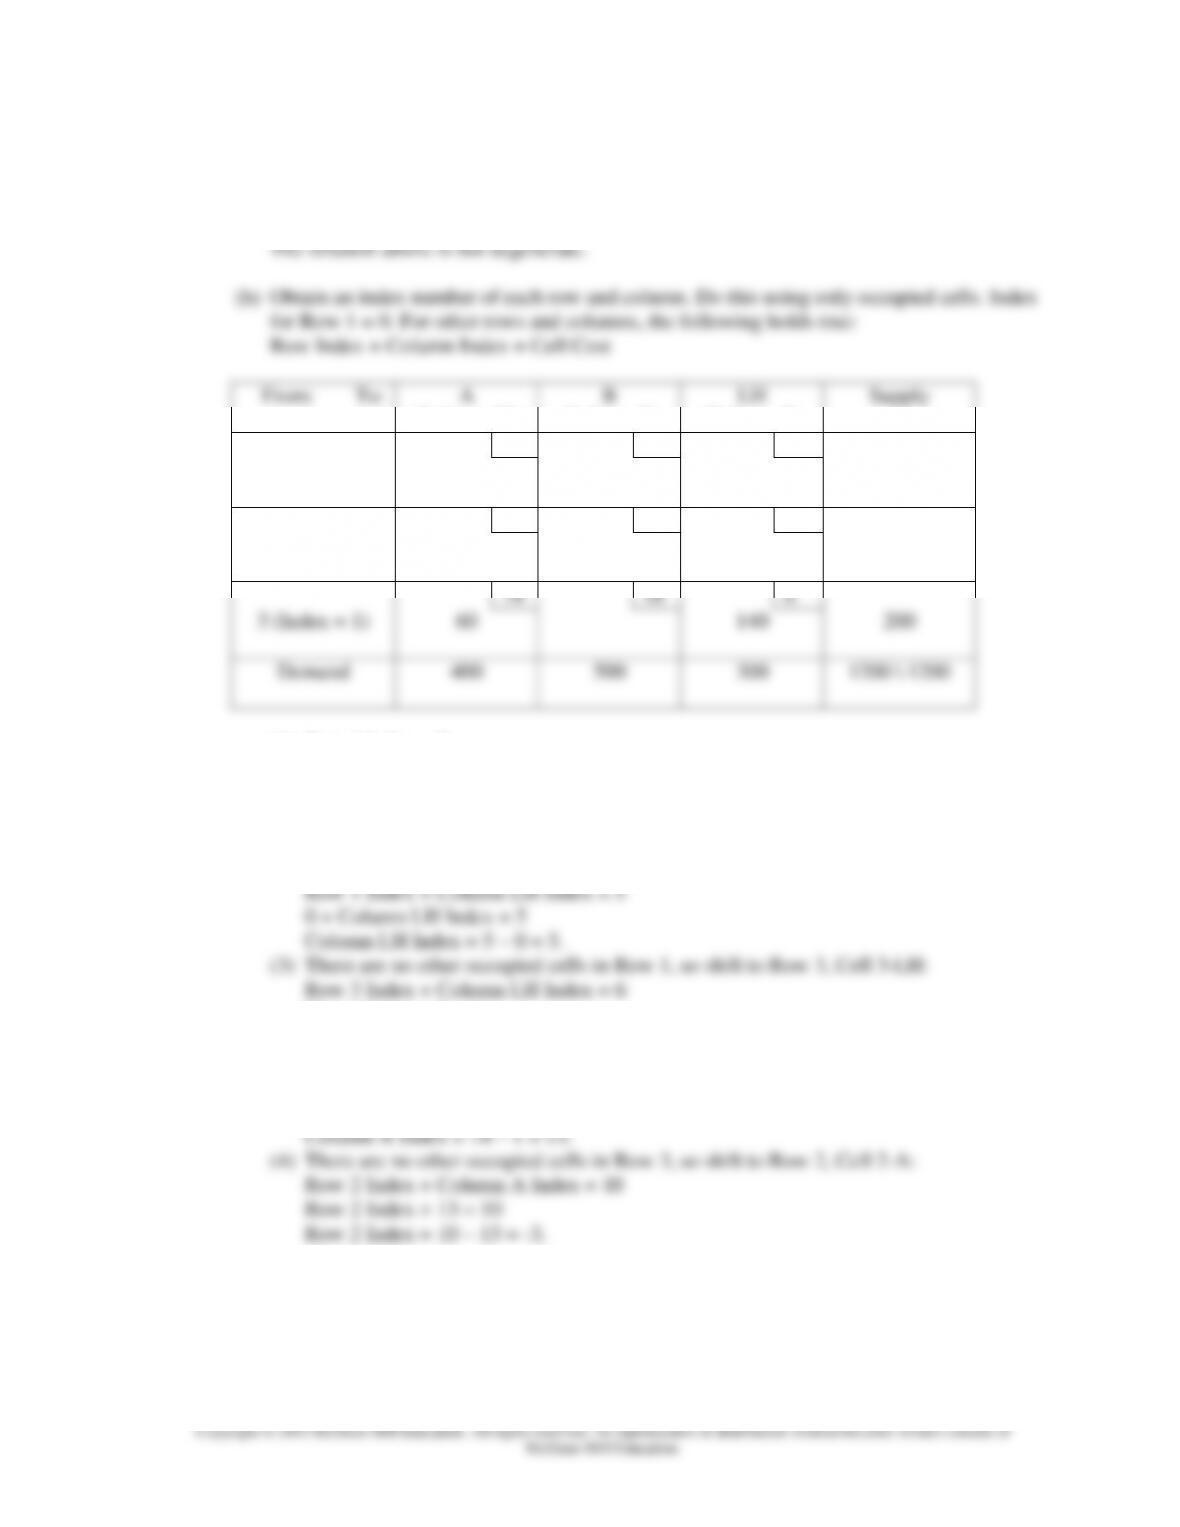
5. Obtain the optimal distribution plan. Develop the initial solution using the intuitive lowest–
cost approach. Use the stepping-stone method for cell evaluations.
Given:
From:
To:
A
B
C
Supply
3
4
2
1
40
5
1
7
2
60
8
7
4
3
50
Demand
30
45
75
150 \ 150
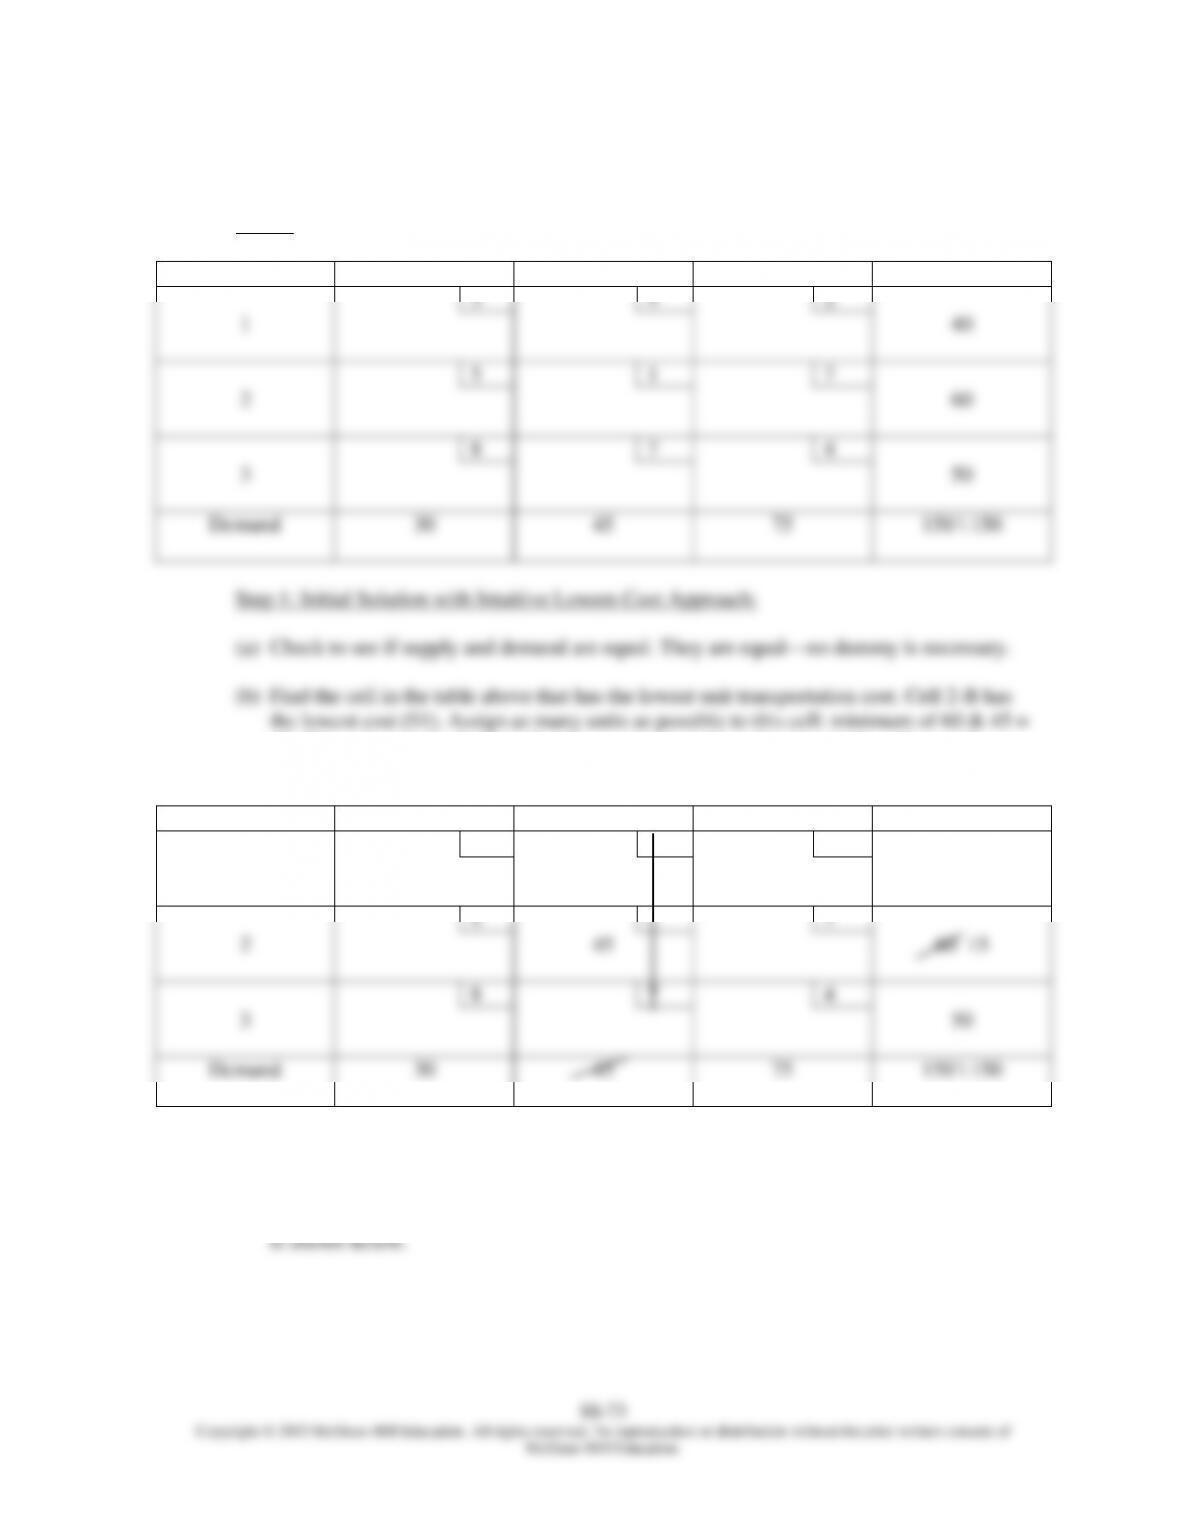
Step 1: Initial Solution with Intuitive Lowest-Cost Approach:
(a) Check to see if supply and demand are equal. They are equal—no dummy is necessary.
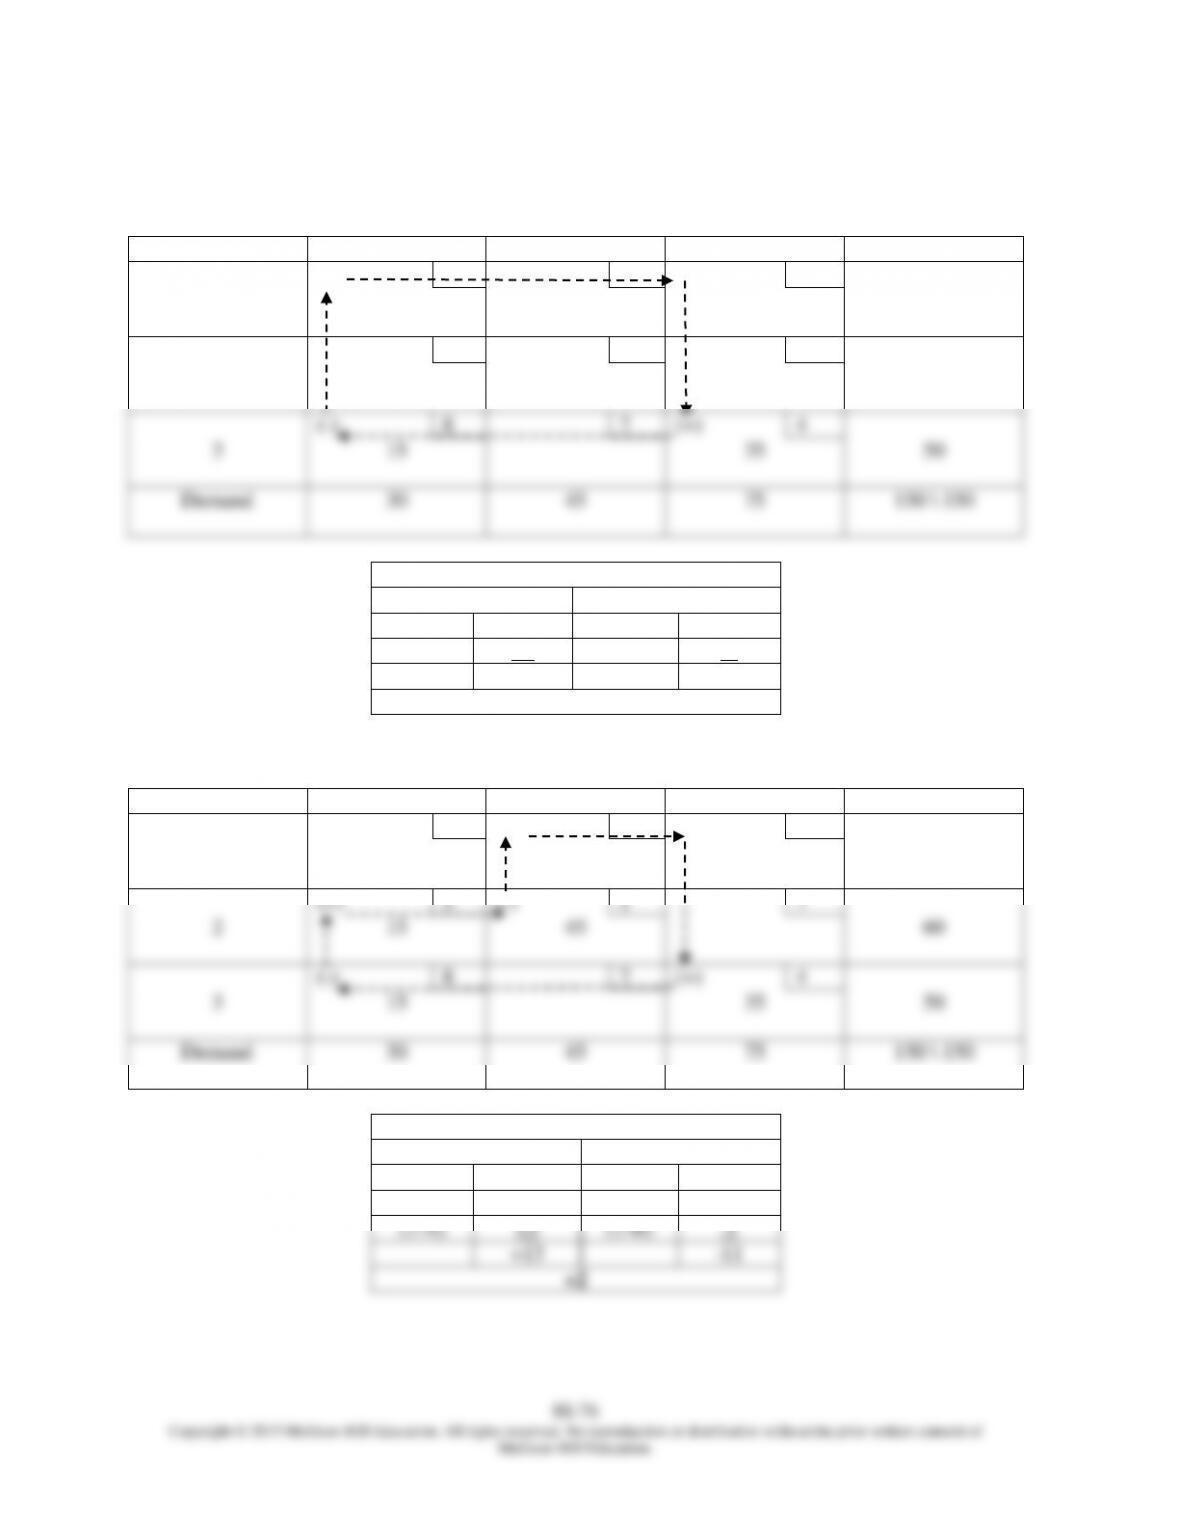
(b) Find the cell in the table above that has the lowest unit transportation cost. Cell 2-B has
the lowest cost ($1). Assign as many units as possible to this cell: minimum of 60 & 45 =
45. This exhausts the Column B total, so cross out 45, and cross out the cell costs for
Column B. Revise the Row 2 total to 15. The result is shown below.
From:
To:
A
B
C
Supply
3
4
2
1
40
5
1
7
2
45
60 15
8
7
4
3
50
Demand
30
45
75
150 \ 150
(c) Find the cell (that is not crossed out) in the table above that has the next lowest unit
transportation cost. Cell 1-C has the next lowest cost ($2). Assign as many units as
possible to this cell: minimum of 40 & 75 = 40. This exhausts the Row 1 total, so cross
out 40, and cross out the cell costs for Row 1. Revise the Column C total to 35. The result
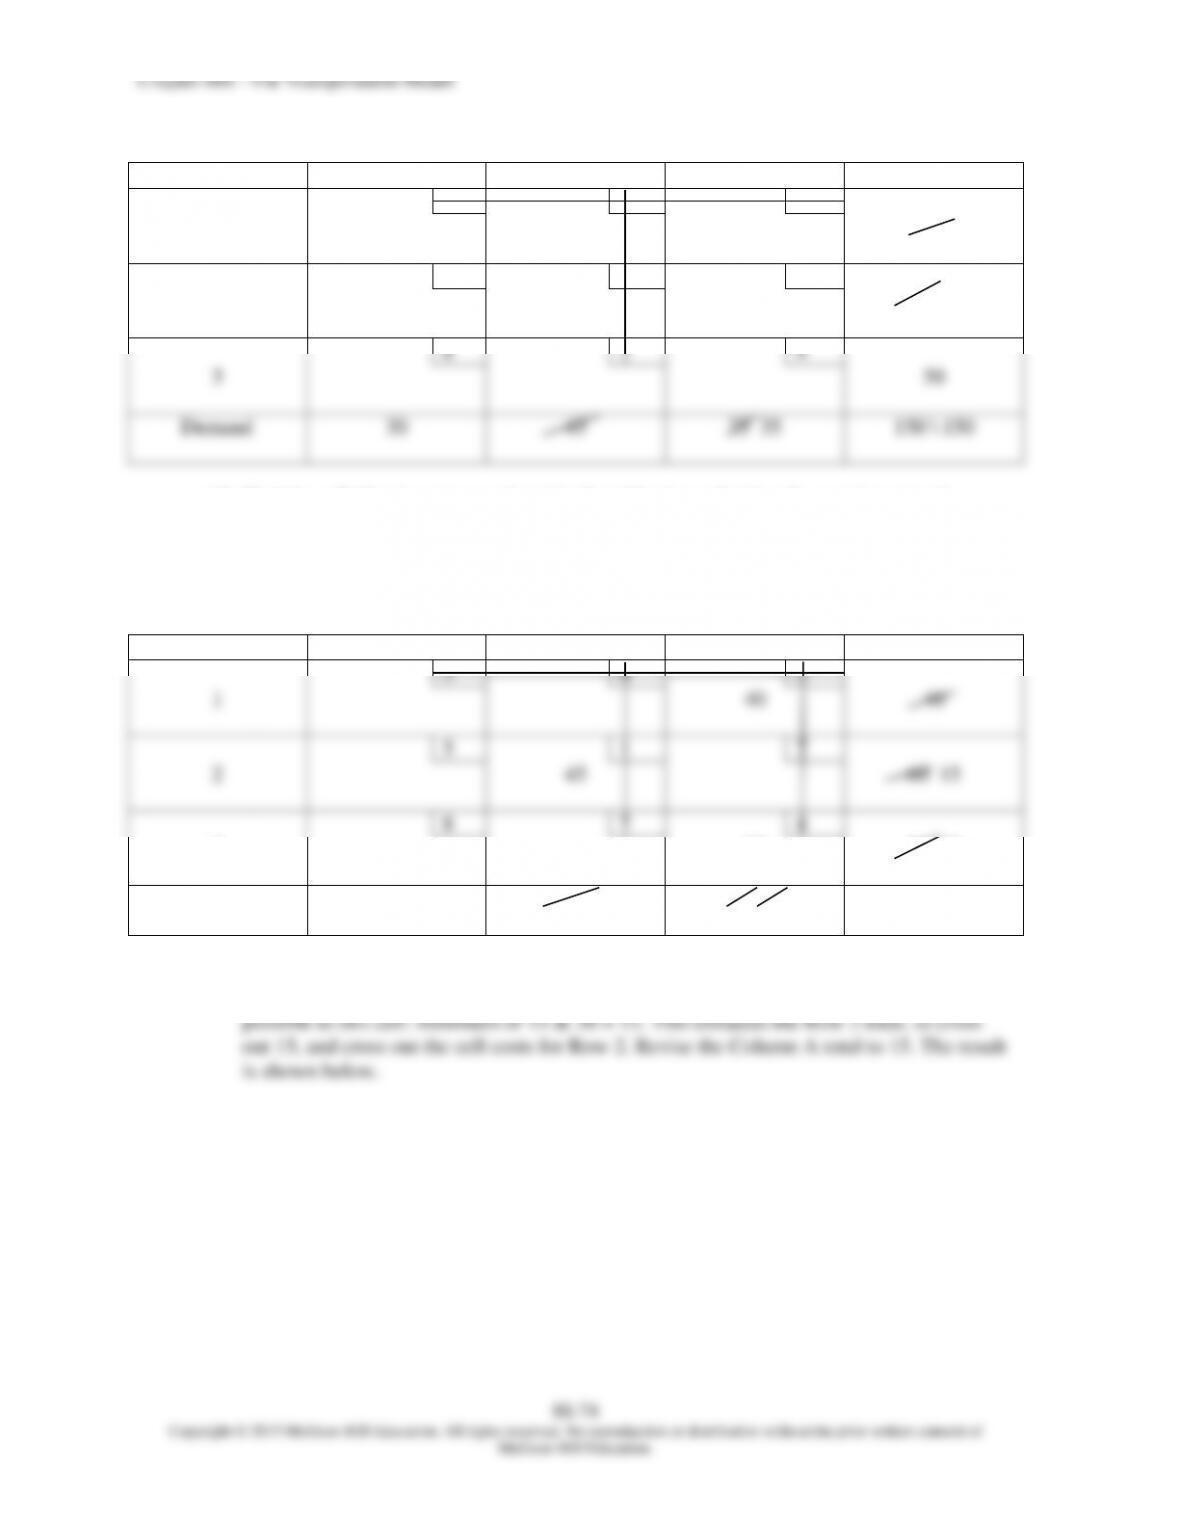
Chapter 08S – The Transportation Model
8S–75
From:
To:
A
B
C
Supply
3
4
2
1
40
40
5
1
7
2
15
45
60 15
8
7
4
3
35
50 15
Demand
30 15
45
75 35
150 \ 150
(f) Find the cell (that is not crossed out) in the table above that has the next lowest unit
transportation cost. Cell 3-A has the next lowest cost ($8). Assign as many units as
possible to this cell: minimum of 15 & 15 = 15. This exhausts the Row 3 and Column A
totals, so we are finished. The initial solution is shown below.
From:
To:
A
B
C
Supply
3
4
2
1
40
40
5
1
7
2
15
45
60
8
7
4
3
15
35
50
Demand
30
45
75
150 \ 150
The solution above is not degenerate.
Chapter 08S – The Transportation Model
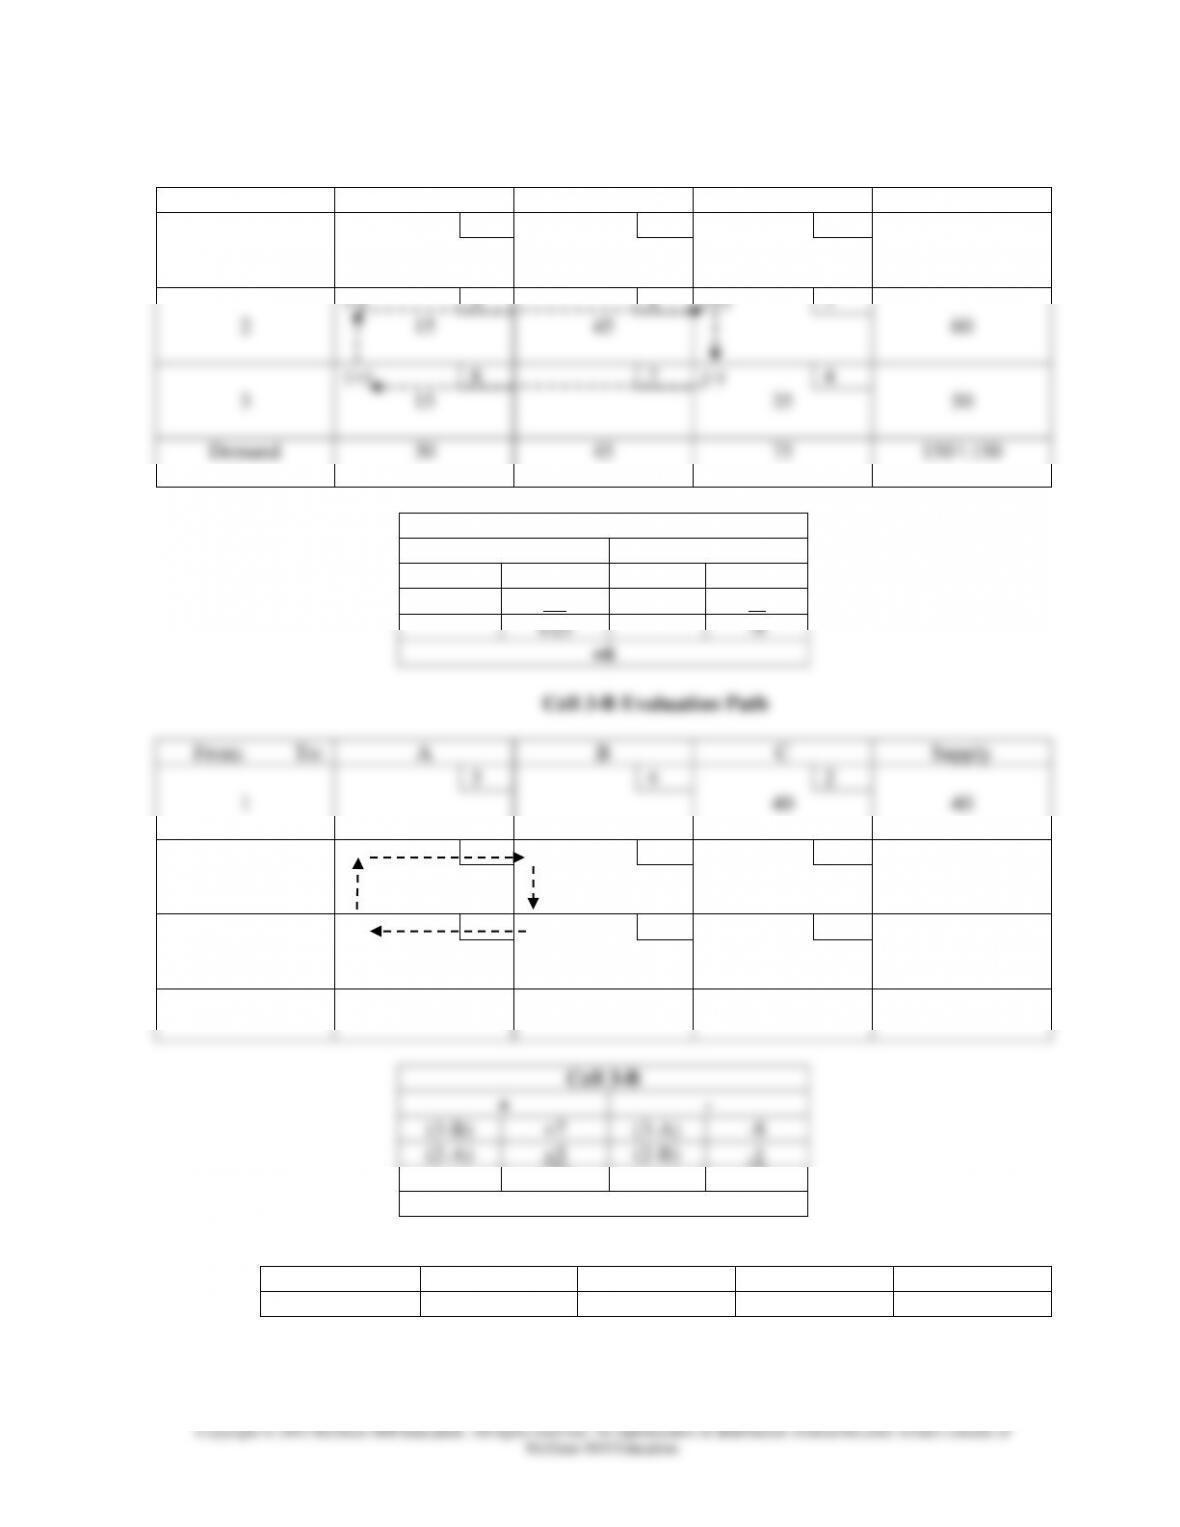
(b) Evaluate empty cells:
Cell 1-A Evaluation Path
From:
To:
A
B
C
Supply
(+)
3
4
(-)
2
1
40
40
5
1
7
2
15
45
60
(-)
8
7
(+)
4
3
15
35
50
Demand
30
45
75
150 \ 150
Cell 1-A
+
–
(1–A)
+3
(1–C)
-2
(3–C)
+4
(3–A)
-8
+7
-10
-3
Cell 1-B Evaluation Path
From:
To:
A
B
C
Supply
3
(+)
4
(-)
2
1
40
40
(+)
5
(-)
1
7
2
15
45
60
(-)
8
7
(+)
4
3
15
35
50
Demand
30
45
75
150 \ 150
Cell 1-B
+
–
(1–B)
+4
(1–C)
-2
(3–C)
+4
(3–A)
-8
(2–A)
+5
(2–B)
-1
+13
-11
+2
Chapter 08S – The Transportation Model
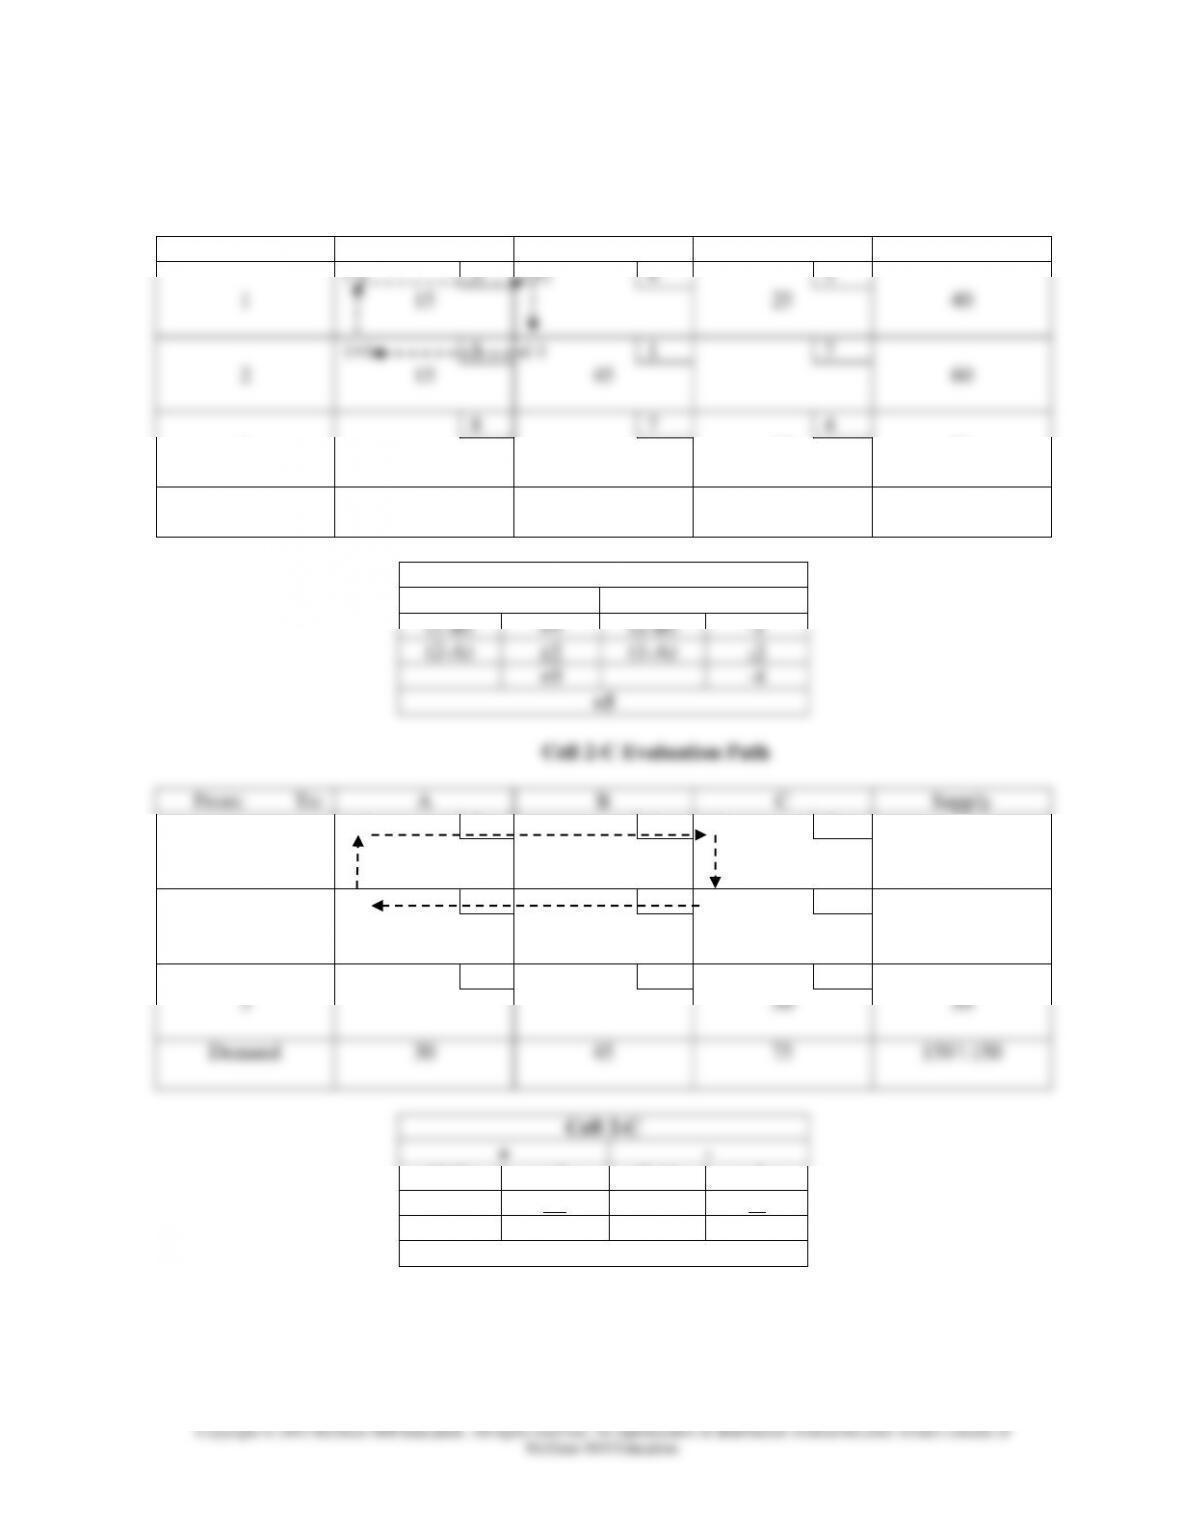
Cell 2-C Evaluation Path
From:
To:
A
B
C
Supply
3
4
2
1
40
40
(-)
5
1
(+)
7
2
15
45
60
(+)
8
7
(-)
4
3
15
35
50
Demand
30
45
75
150 \ 150
Cell 2-C
+
–
(2-C)
+7
(3-C)
-4
(3-A)
+8
(2-A)
-5
+15
-9
+6
Cell 3-B Evaluation Path
From:
To:
A
B
C
Supply
3
4
2
1
40
40
(+)
5
(-)
1
7
2
15
45
60
(-)
8
(+)
7
4
3
15
35
50
Demand
30
45
75
150 \ 150
(3-B)
+7
-8
-9
8S–78
Copyright © 2015 McGraw-Hill Education. All rights reserved. No reproduction or distribution without the prior written consent of
McGraw-Hill Education.
Cell 1-A Evaluation Path
From:
To:
A
B
C
Supply
(+)
3
4
(-)
2
1
40
40
5
1
7
2
15
45
60
(-)
8
7
(+)
4
3
15
35
50
Demand
30
45
75
150 \ 150
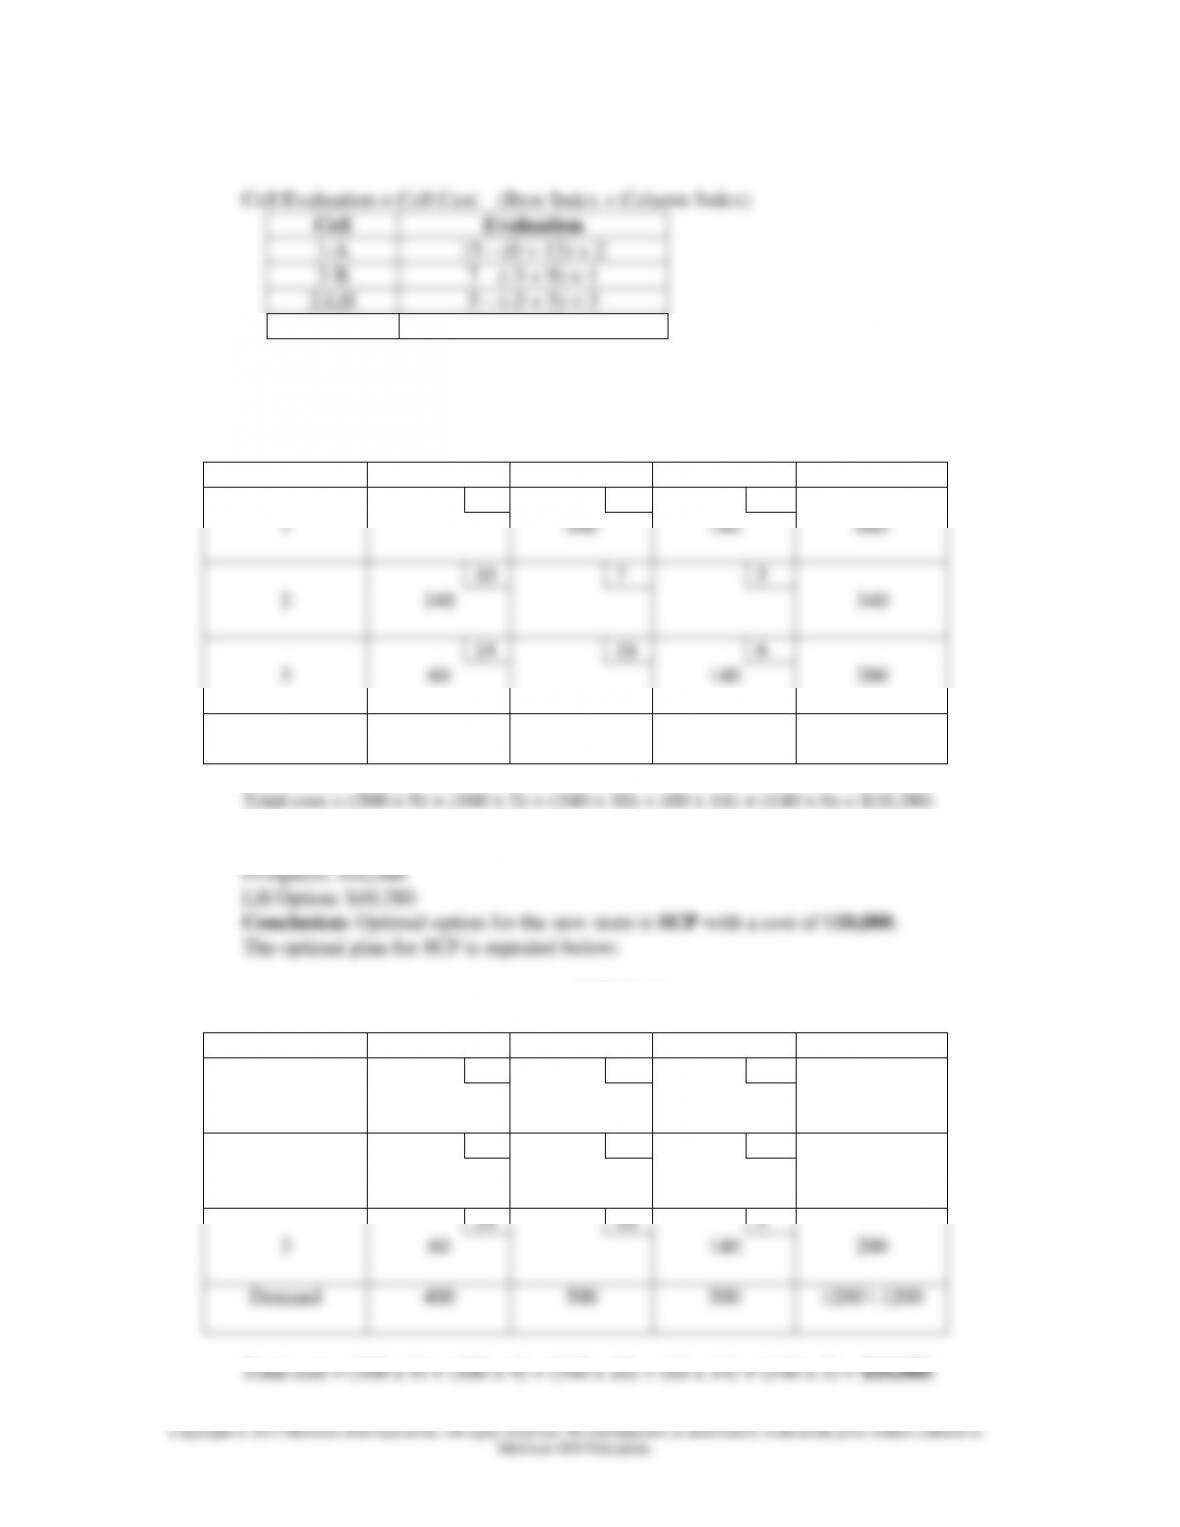
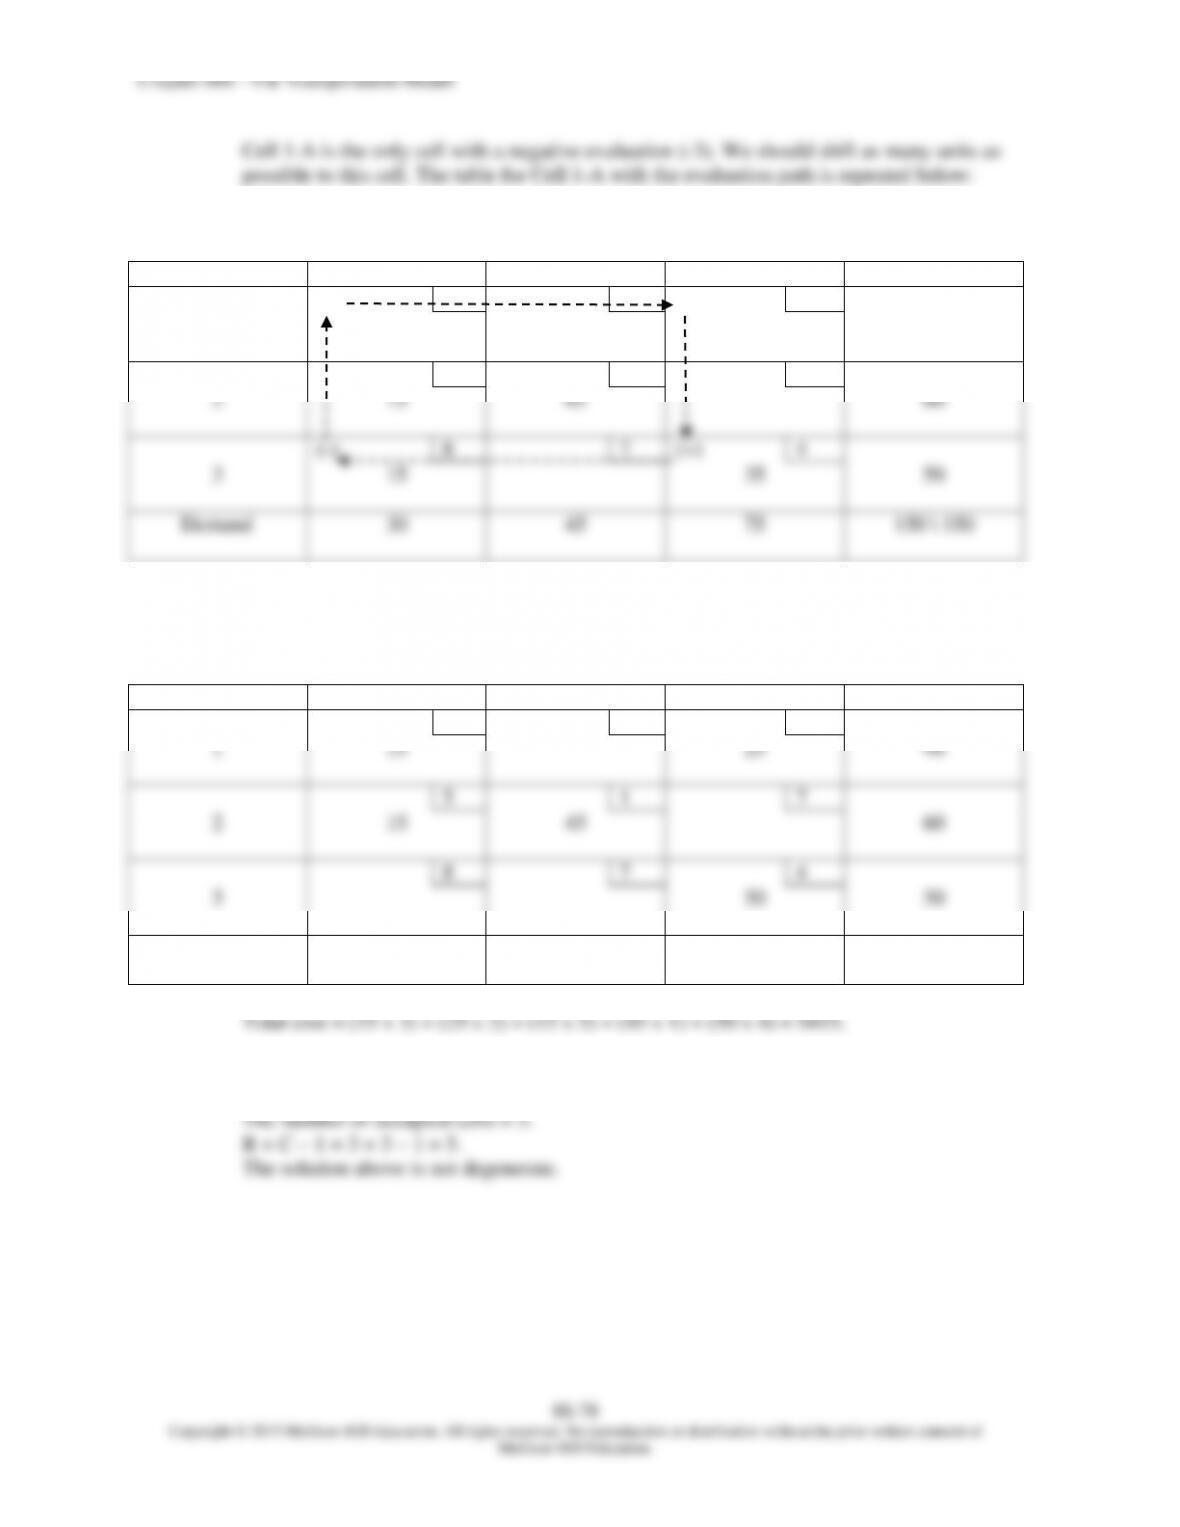
The quantities in the cells that have – signs are potential candidates for shifting units. Cell
1-C has 40 units and Cell 3-A has 15 units. Therefore, 15 units can be shifted. The result
is shown below.
From:
To:
A
B
C
Supply
3
4
2
1
15
25
40
5
1
7
2
15
45
60
8
7
4
3
50
50
Demand
30
45
75
150 \ 150
Total cost = (15 x 3) + (25 x 2) + (15 x 5) + (45 x 1) + (50 x 4) = $415.
(c) Test for degeneracy in the table above.
The number of occupied cells must equal R + C – 1.
Chapter 08S – The Transportation Model
(d) Evaluate empty cells:
Cell 1-B Evaluation Path
From:
To:
A
B
C
Supply
(-)
3
(+)
4
2
1
15
25
40
(+)
5
(-)
1
7
2
15
45
60
8
7
4
3
50
50
Demand
30
45
75
150 \ 150
Cell 1-B
+
–
(1-B)
+4
(2-B)
-1
(2-A)
+5
(1-A)
-3
+9
-4
+5
Cell 2-C Evaluation Path
From:
To:
A
B
C
Supply
(+)
3
4
(-)
2
1
15
25
40
(-)
5
1
(+)
7
2
15
45
60
8
7
4
3
50
50
Demand
30
45
75
150 \ 150
(1-A)
+3
-2
-7
Chapter 08S – The Transportation Model
8S–80
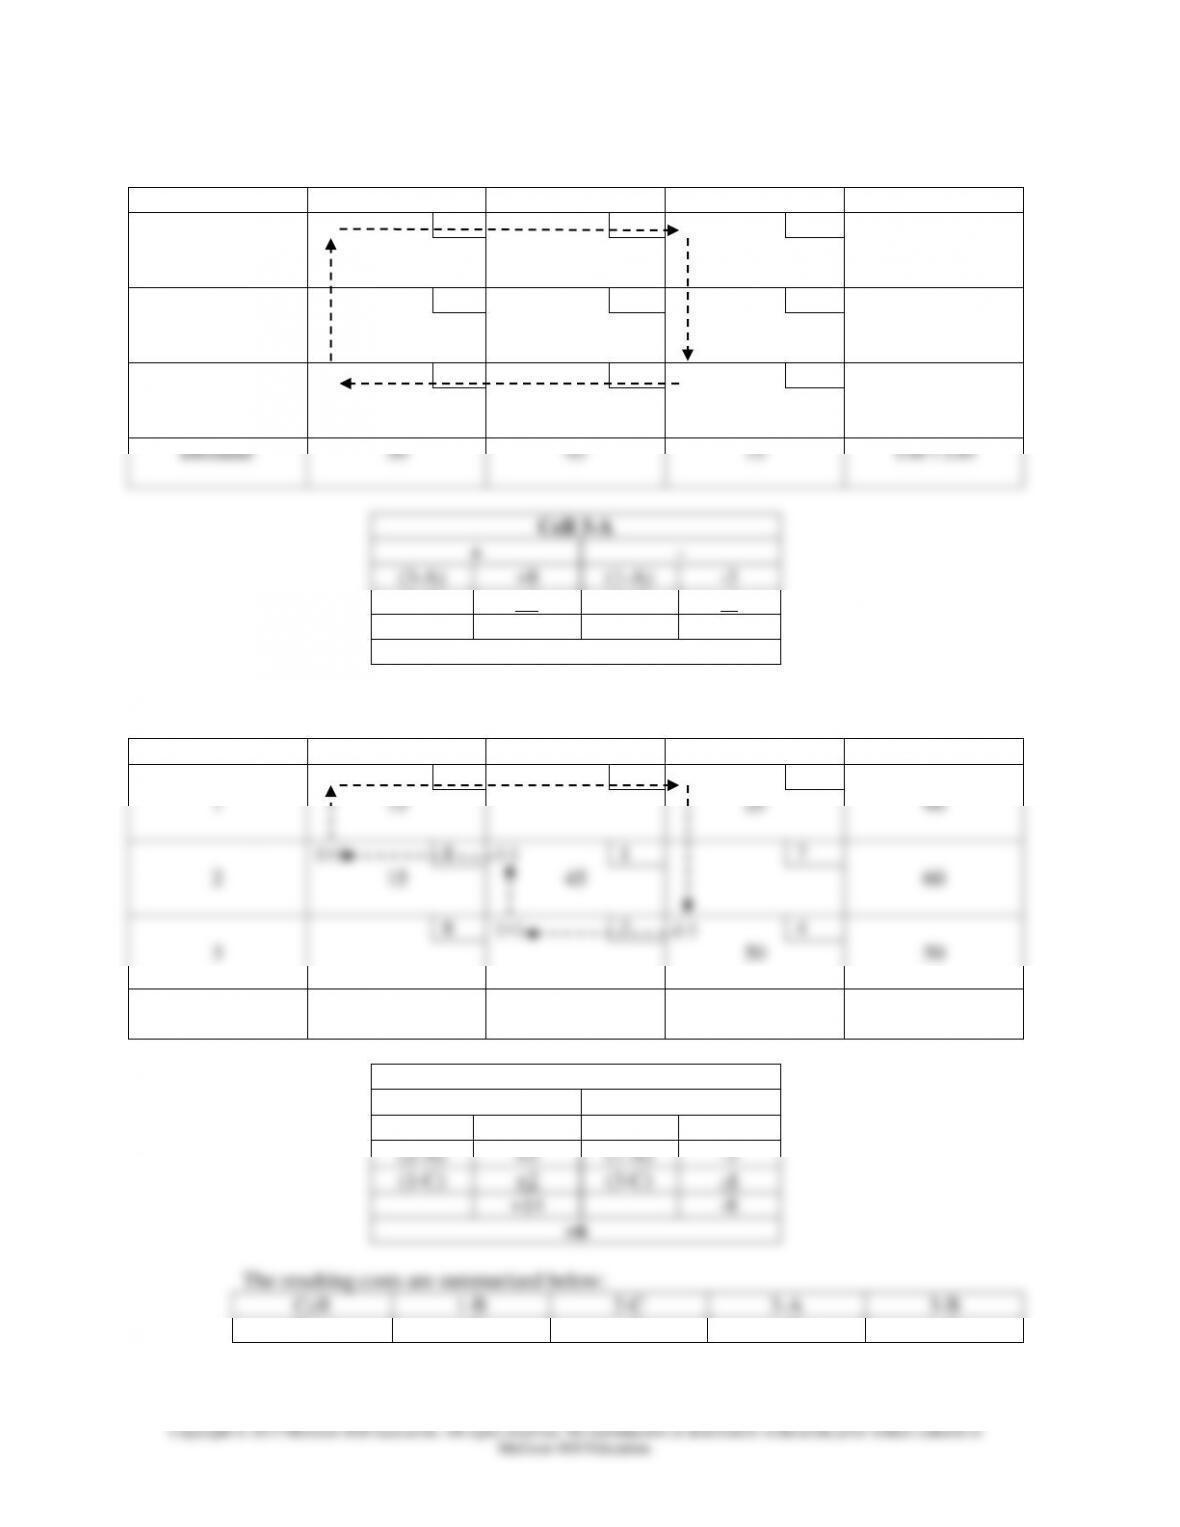
Cell 3-A Evaluation Path
From:
To:
A
B
C
Supply
(-)
3
4
(+)
2
1
15
25
40
5
1
7
2
15
45
60
(+)
8
7
(-)
4
3
50
50
Demand
30
45
75
150 \ 150
Cell 3-A
+
–
(3-A)
+8
(1-A)
-3
(1-C)
+2
(3-C)
-4
+10
-7
+3
Cell 3-B Evaluation Path
From:
To:
A
B
C
Supply
(-)
3
4
(+)
2
1
15
25
40
(+)
5
(-)
1
7
2
15
45
60
8
(+)
7
(-)
4
3
50
50
Demand
30
45
75
150 \ 150
Cell 3-B
+
–
(3-B)
+7
(2-B)
-1
(2–A)
+5
(1–A)
-3
(1-C)
+2
(3-C)
-4
+14
-8
+6
The resulting costs are summarized below:
Cell
1-B
2-C
3-A
3-B
Cost
+5
+3
+3
+6