Chapter 08S – The Transportation Model
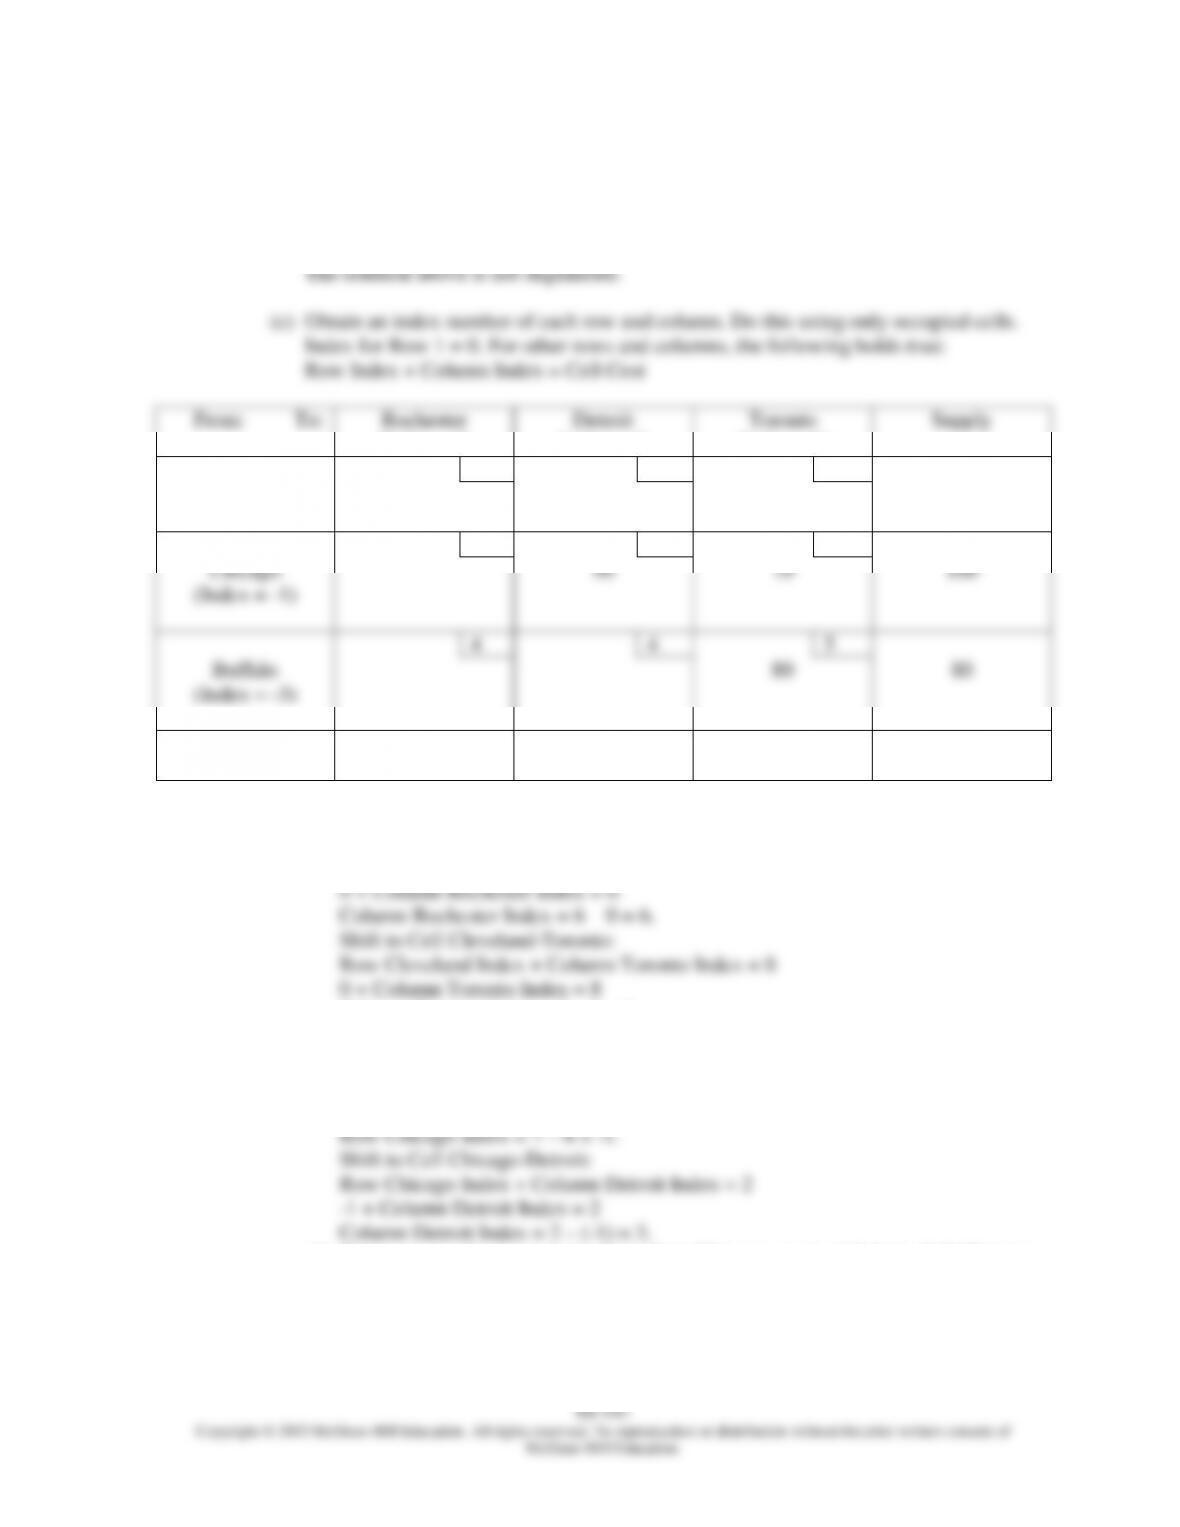
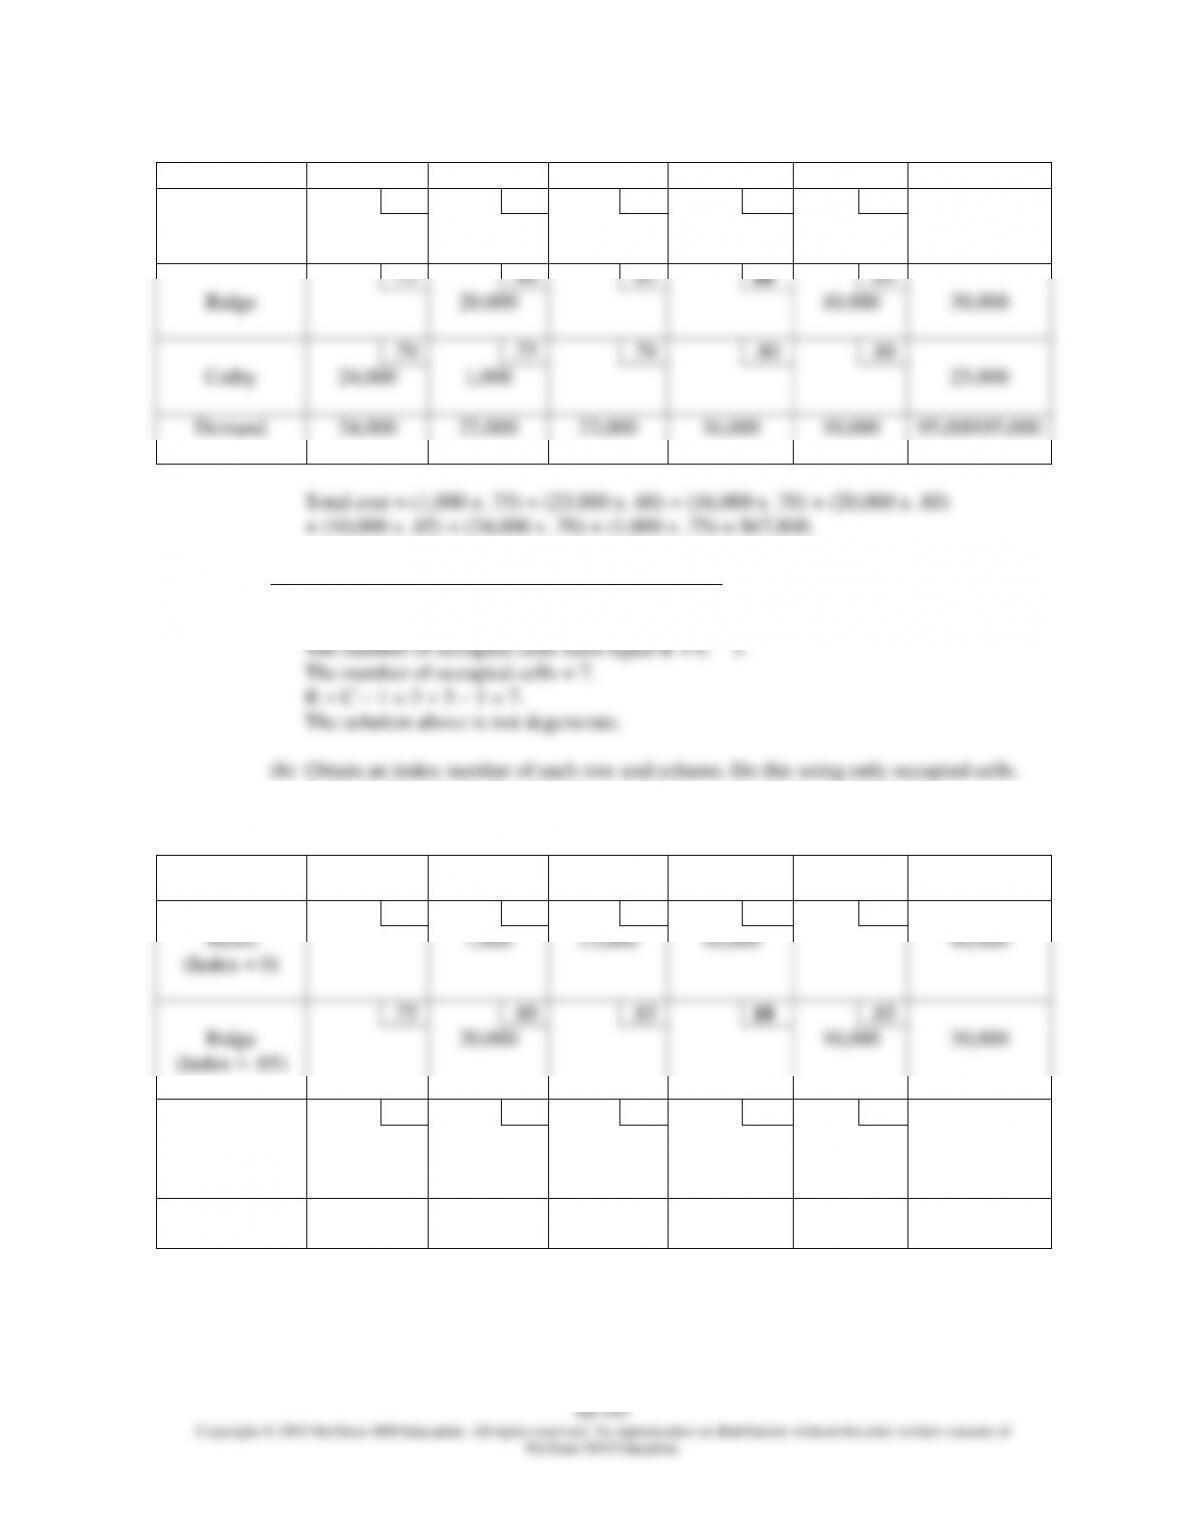
(d) Test for degeneracy in the table above.
The number of occupied cells must equal R + C – 1.
The number of occupied cells = 5.
R + C – 1 = 3 + 3 – 1 = 5.
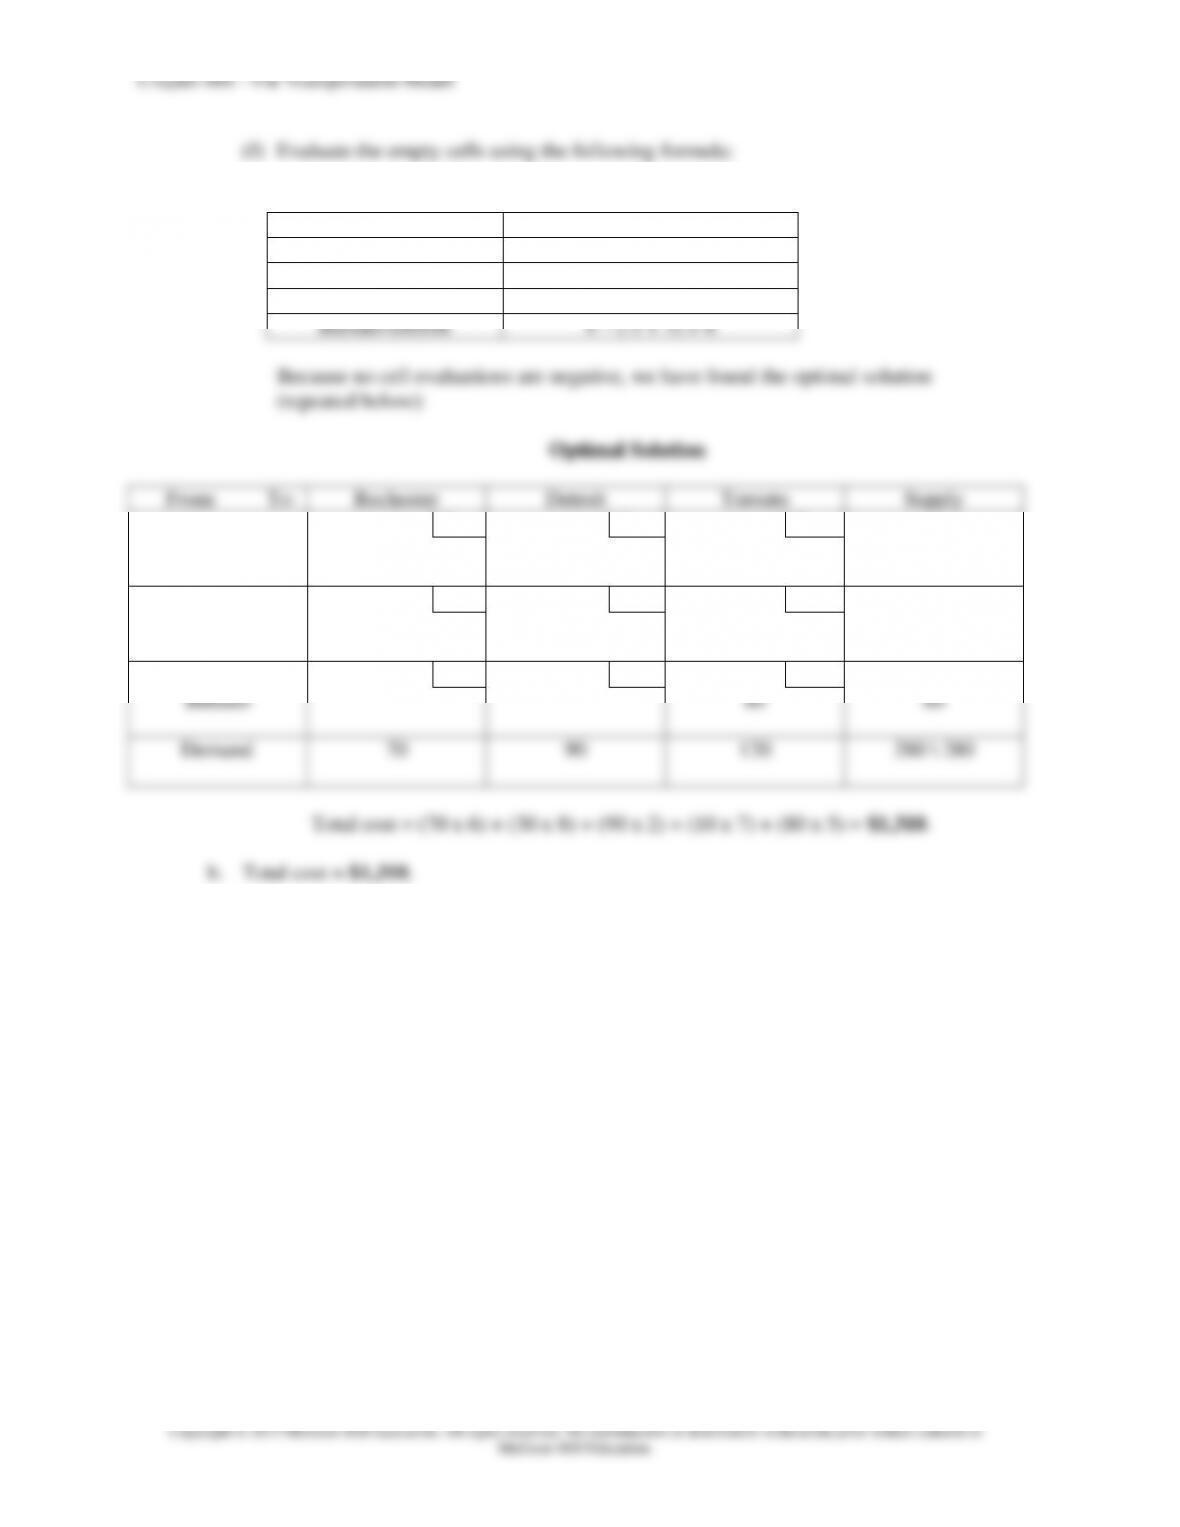
(f) Evaluate the empty cells using the following formula:
Cell Evaluation = Cell Cost – (Row Index + Column Index)
Cell
Evaluation
Cleveland-Detroit
4 – (0 + 3) = 1
Chicago-Rochester
7 – (-1 + 6) = 2
Buffalo-Rochester
4 – (-3 + 6) = 1
Buffalo-Detroit
4 – (-3 + 3) = 4
Chapter 08S – The Transportation Model
8S–143
12. A soft drink manufacturer wants to determine shipping routes and costs. The capacity of each
plant is given below:
Plant
Capacity
Metro
40,000
Ridge
30,000
Colby
25,000
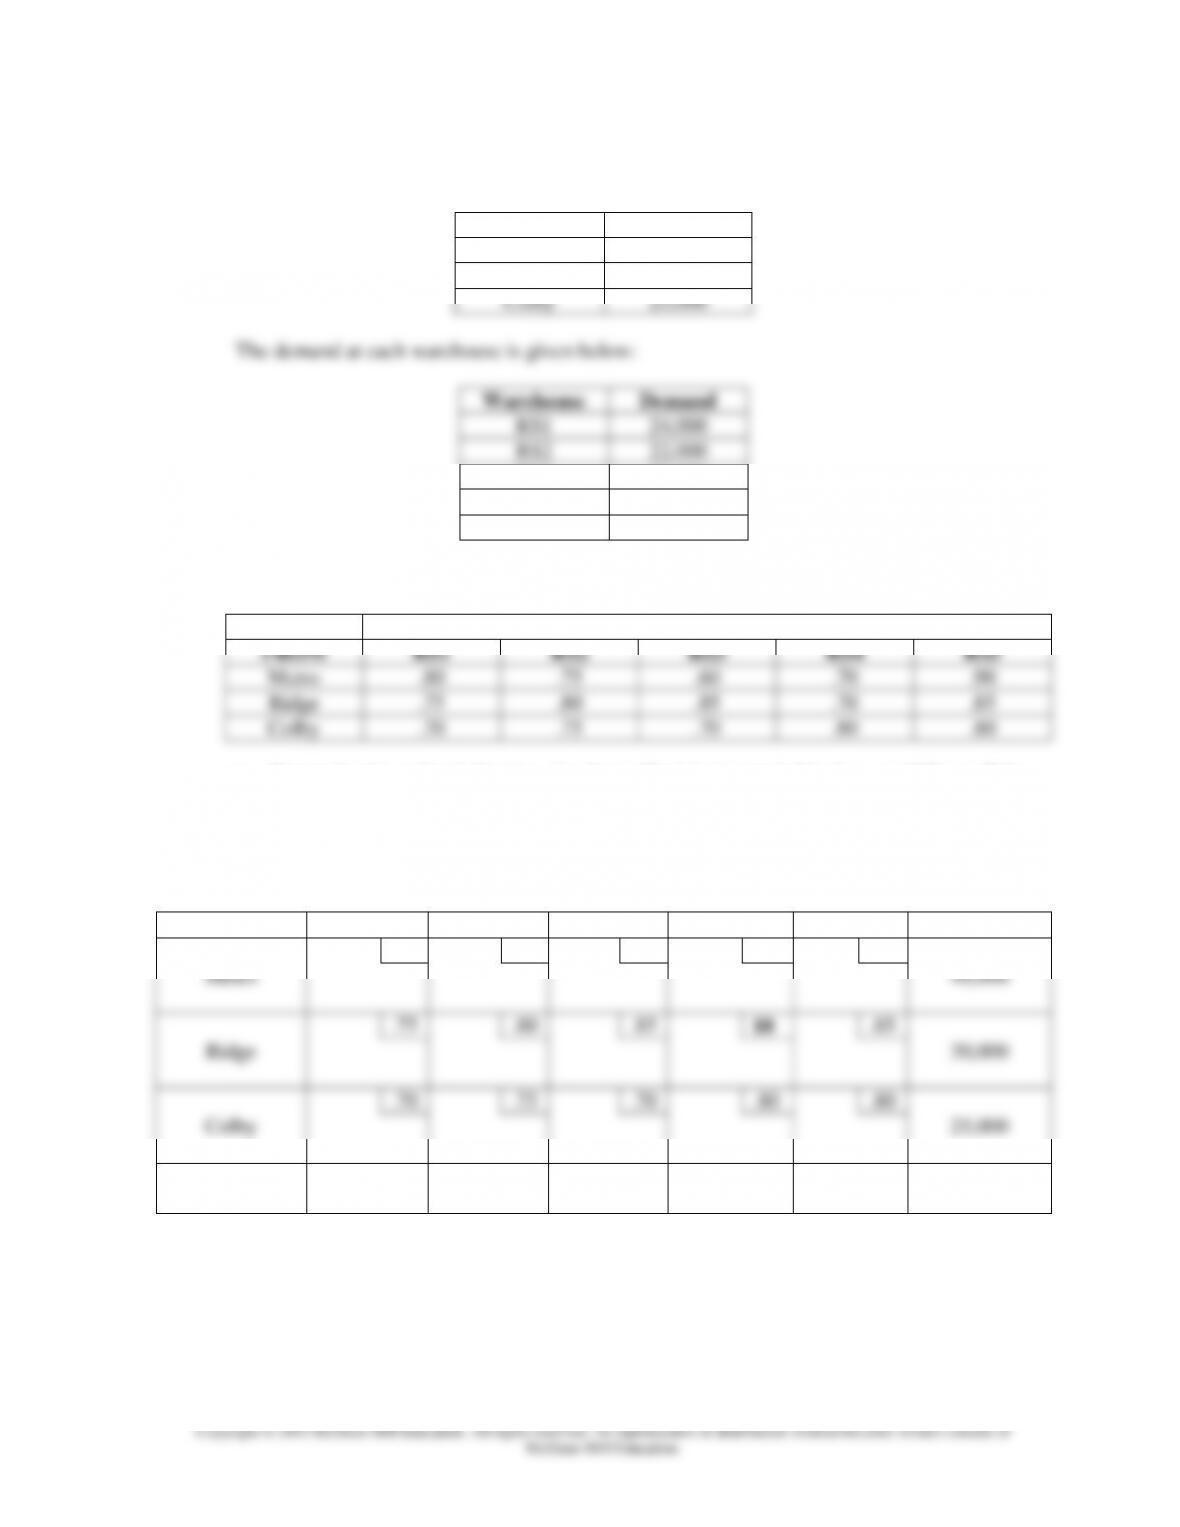
The demand at each warehouse is given below:
Warehouse
Demand
RS1
24,000
RS2
22,000
RS3
23,000
RS4
16,000
RS5
10,000
The estimated shipping costs per case are given below:
TO
FROM
RS1
RS2
RS3
RS4
RS5
Metro
.80
.75
.60
.70
.90
Ridge
.75
.80
.85
.70
.85
Colby
.70
.75
.70
.80
.80
RS4 is unacceptable:
We can assign this route a very high cost to ensure that it will not be selected. We will
change the shipping cost per case to $10 in the table below:
From:
To:
RS1
RS2
RS3
RS4
RS5
Supply
.80
.75
.60
.70
.90
Metro
40,000
.75
.80
.85
10
.85
Ridge
30,000
.70
.75
.70
.80
.80
Colby
25,000
Demand
24,000
22,000
23,000
16,000
10,000
95,000\95,000
8S–144
Copyright © 2015 McGraw-Hill Education. All rights reserved. No reproduction or distribution without the prior written consent of
McGraw-Hill Education.
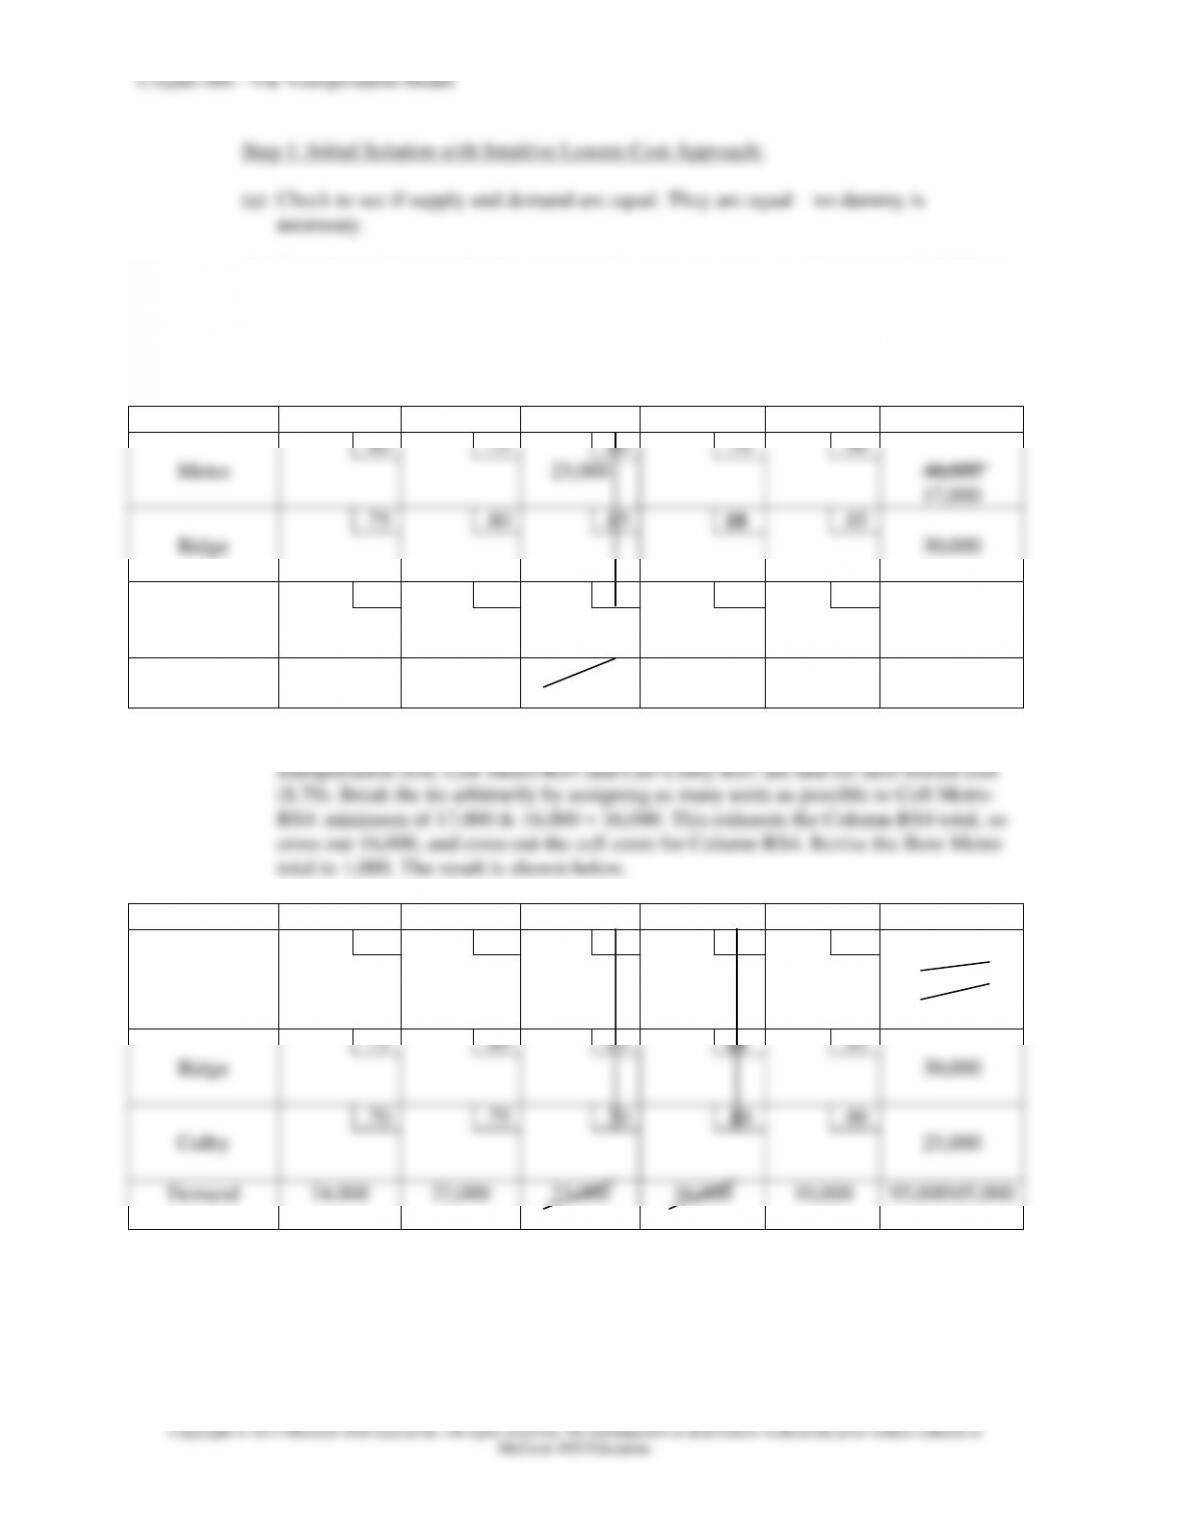
Step 1: Initial Solution with Intuitive Lowest-Cost Approach:
(a) Check to see if supply and demand are equal. They are equal—no dummy is
necessary.
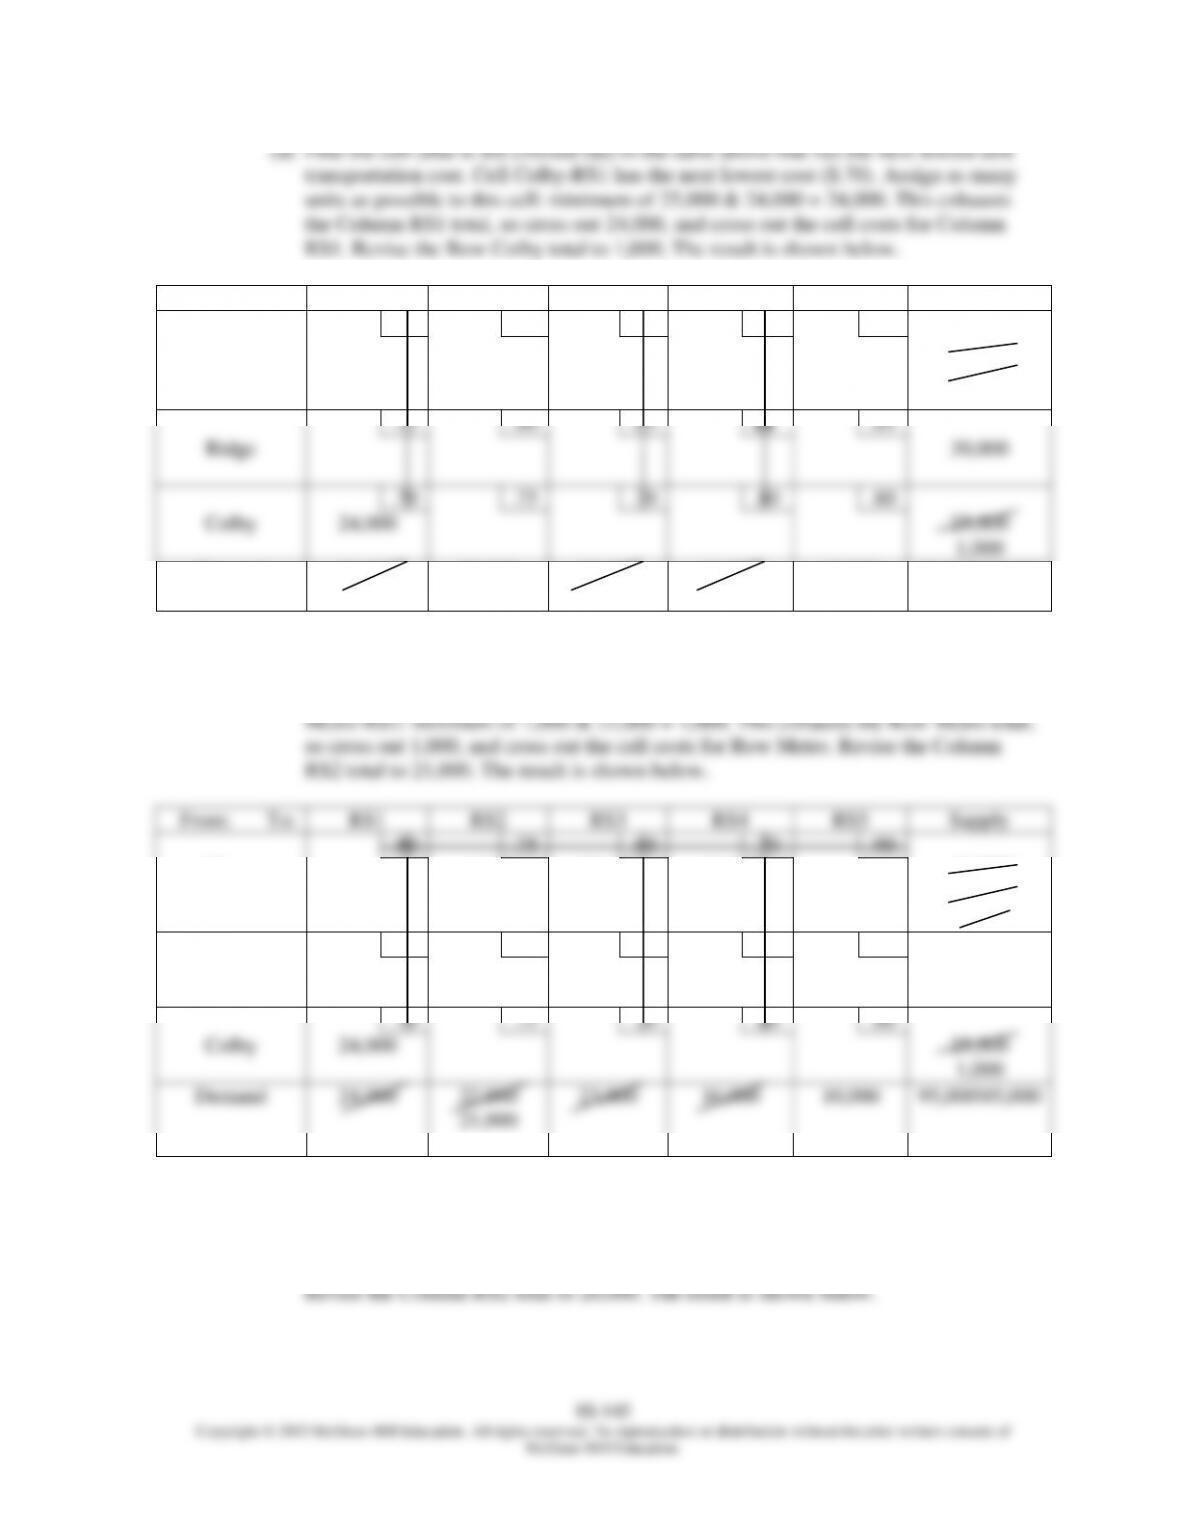
(b) Find the cell in the table above that has the lowest unit transportation cost. Cell Metro-
RS3 has the lowest cost ($.60). Assign as many units as possible to this cell: minimum
of 40,000 & 23,000 = 23,000. This exhausts the Column RS3 total, so cross out
23,000, and cross out the cell costs for Column RS3. Revise the Row Metro total to
17,000. The result is shown below.
From:
To:
RS1
RS2
RS3
RS4
RS5
Supply
.80
.75
.60
.70
.90
Metro
23,000
40,000
17,000
.75
.80
.85
10
.85
Ridge
30,000
.70
.75
.70
.80
.80
Colby
25,000
Demand
24,000
22,000
23,000
16,000
10,000
95,000\95,000
(c) Find the cell (that is not crossed out) in the table above that has the next lowest unit
From:
To:
RS1
RS2
RS3
RS4
RS5
Supply
.80
.75
.60
.70
.90
Metro
23,000
16,000
40,000
17,000
1,000
.75
.80
.85
10
.85
Ridge
30,000
.70
.75
.70
.80
.80
Colby
25,000
Demand
24,000
22,000
23,000
16,000
10,000
95,000\95,000
Chapter 08S – The Transportation Model
8S–145
Copyright © 2015 McGraw-Hill Education. All rights reserved. No reproduction or distribution without the prior written consent of
McGraw-Hill Education.
(d) Find the cell (that is not crossed out) in the table above that has the next lowest unit
transportation cost. Cell Colby-RS1 has the next lowest cost ($.70). Assign as many
units as possible to this cell: minimum of 25,000 & 24,000 = 24,000. This exhausts
the Column RS1 total, so cross out 24,000, and cross out the cell costs for Column
RS1. Revise the Row Colby total to 1,000. The result is shown below.
From:
To:
RS1
RS2
RS3
RS4
RS5
Supply
.80
.75
.60
.70
.90
Metro
23,000
16,000
40,000
17,000
1,000
.75
.80
.85
10
.85
Ridge
30,000
.70
.75
.70
.80
.80
Colby
24,000
25,000
1,000
Demand
24,000
22,000
23,000
16,000
10,000
95,000\95,000
(e) Find the cell (that is not crossed out) in the table above that has the next lowest unit
transportation cost. Cell Metro-RS2 and Cell Colby-RS2 are tied for the next lowest
cost ($.75). Break the tie arbitrarily by assigning as many units as possible to Cell
From:
To:
RS1
RS2
RS3
RS4
RS5
Supply
.80
.75
.60
.70
.90
Metro
1,000
23,000
16,000
40,000
17,000
1,000
.75
.80
.85
10
.85
Ridge
30,000
.70
.75
.70
.80
.80
Colby
24,000
25,000
1,000
Demand
24,000
22,000
21,000
23,000
16,000
10,000
95,000\95,000
(f) Find the cell (that is not crossed out) in the table above that has the next lowest unit
transportation cost. Cell Colby-RS2 has the next lowest cost ($.75). Assign as many
units as possible to this cell: minimum of 1,000 & 21,000 = 1,000. This exhausts the
Row Colby total, so cross out 1,000, and cross out the cell costs for Row Colby.
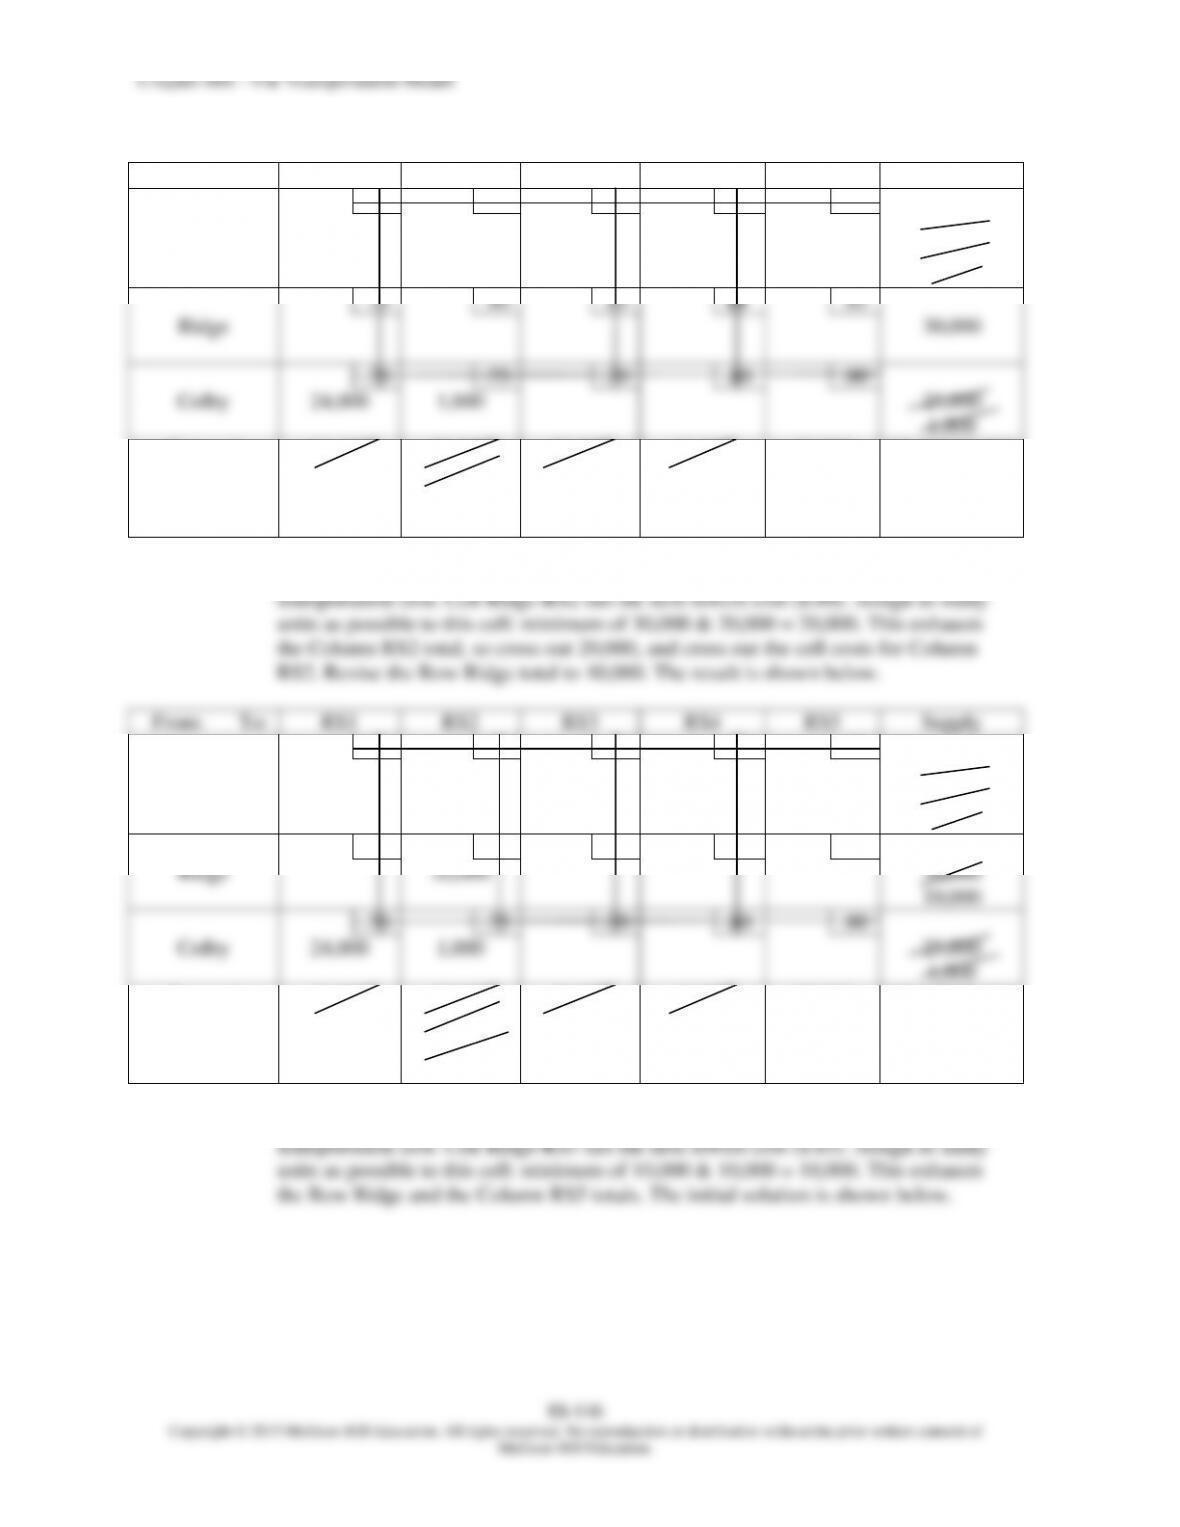
Chapter 08S – The Transportation Model
From:
To:
RS1
RS2
RS3
RS4
RS5
Supply
.80
.75
.60
.70
.90
Metro
1,000
23,000
16,000
40,000
.75
.80
.85
10
.85
Ridge
20,000
10,000
30,000
.70
.75
.70
.80
.80
Colby
24,000
1,000
25,000
Demand
24,000
22,000
23,000
16,000
10,000
95,000\95,000
Step 2: Evaluate empty cells with the MODI method:
(a) Test for degeneracy in the table above.
Index for Row 1 = 0. For other rows and columns, the following holds true:
Row Index + Column Index = Cell Cost
From:
To:
RS1
(Index = .70)
RS2
(Index = .75)
RS3
(Index = .60)
RS4
(Index = .70)
RS5
(Index = .80)
Supply
.80
.75
.60
.70
.90
Metro
(Index = 0)
1,000
23,000
16,000
40,000
.75
.80
.85
10
.85
Ridge
(Index = .05)
20,000
10,000
30,000
.70
.75
.70
.80
.80
Colby
(Index = 0)
24,000
1,000
25,000
Demand
24,000
22,000
23,000
16,000
10,000
95,000\95,000
Chapter 08S – The Transportation Model
8S–148
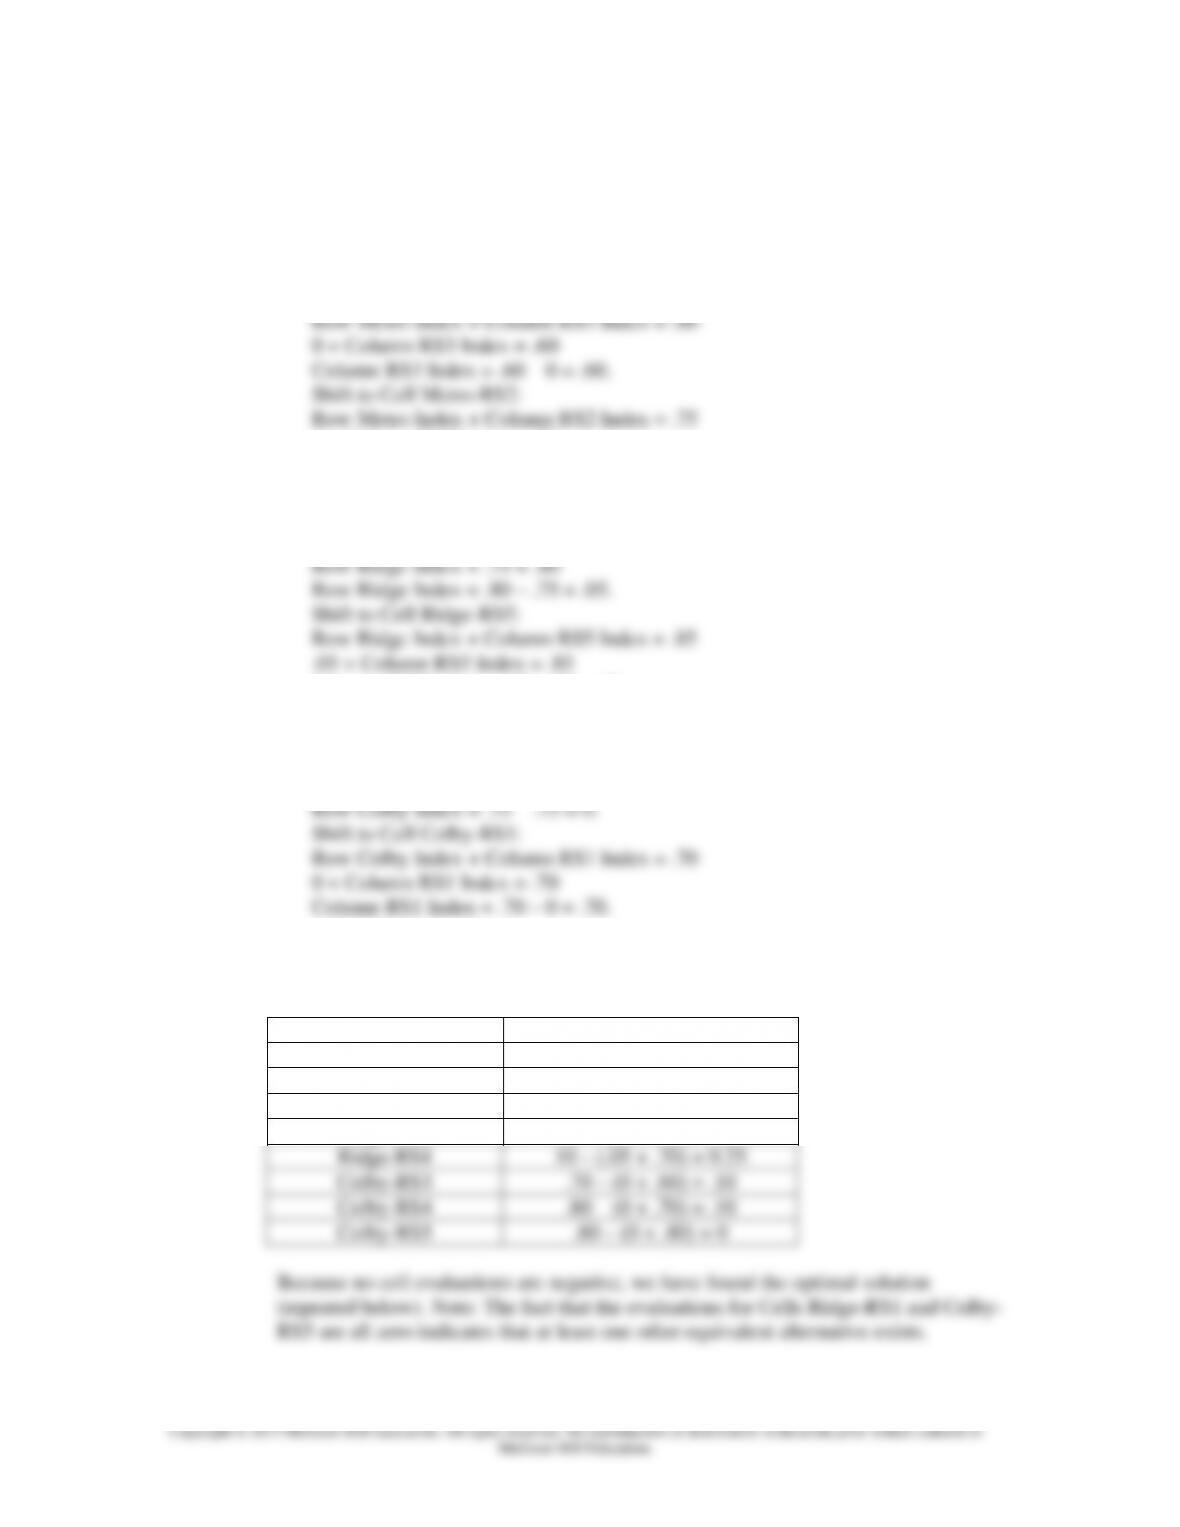
(1) Row 1 (Metro) Index = 0.
(2) Shift to Cell Metro-RS4:
Row Metro Index + Column RS4 Index = .70
0 + Column RS4 Index = .70
Column RS4 Index = .70 – 0 = .70.
Shift to Cell Metro-RS3:
0 + Column RS2 Index = .75
Column RS2 Index = .75 – 0 = .75.
(3) There are no other occupied cells in Row Metro, so shift from Cell Metro-RS2 to
Row Ridge, Cell Ridge-RS2:
Row Ridge Index + Column RS2 Index = .80
Column RS5 Index = .85 – .05 = .80.
(4) There are no other occupied cells in Row Ridge, so shift from Cell Ridge-RS2 to
Row Colby, Cell Colby-RS2:
Row Colby Index + Column RS2 Index = .75
Row Colby Index + .75 = .75
(c) Evaluate the empty cells using the following formula:
Cell Evaluation = Cell Cost – (Row Index + Column Index)
Cell
Evaluation
Metro-RS1
.80 – (0 + .70) = .10
Metro-RS5
.90 – (0 + .80) = .10
Ridge-RS1
.75 – (.05 + .70) = 0
Ridge-RS3
.85 – (.05 + .60) = .20
Ridge-RS4
10 – (.05 + .70) = 9.25
Colby-RS3
.70 – (0 + .60) = .10
Colby-RS4
.80 – (0 + .70) = .10
Colby-RS5
.80 – (0 + .80) = 0
8S–149
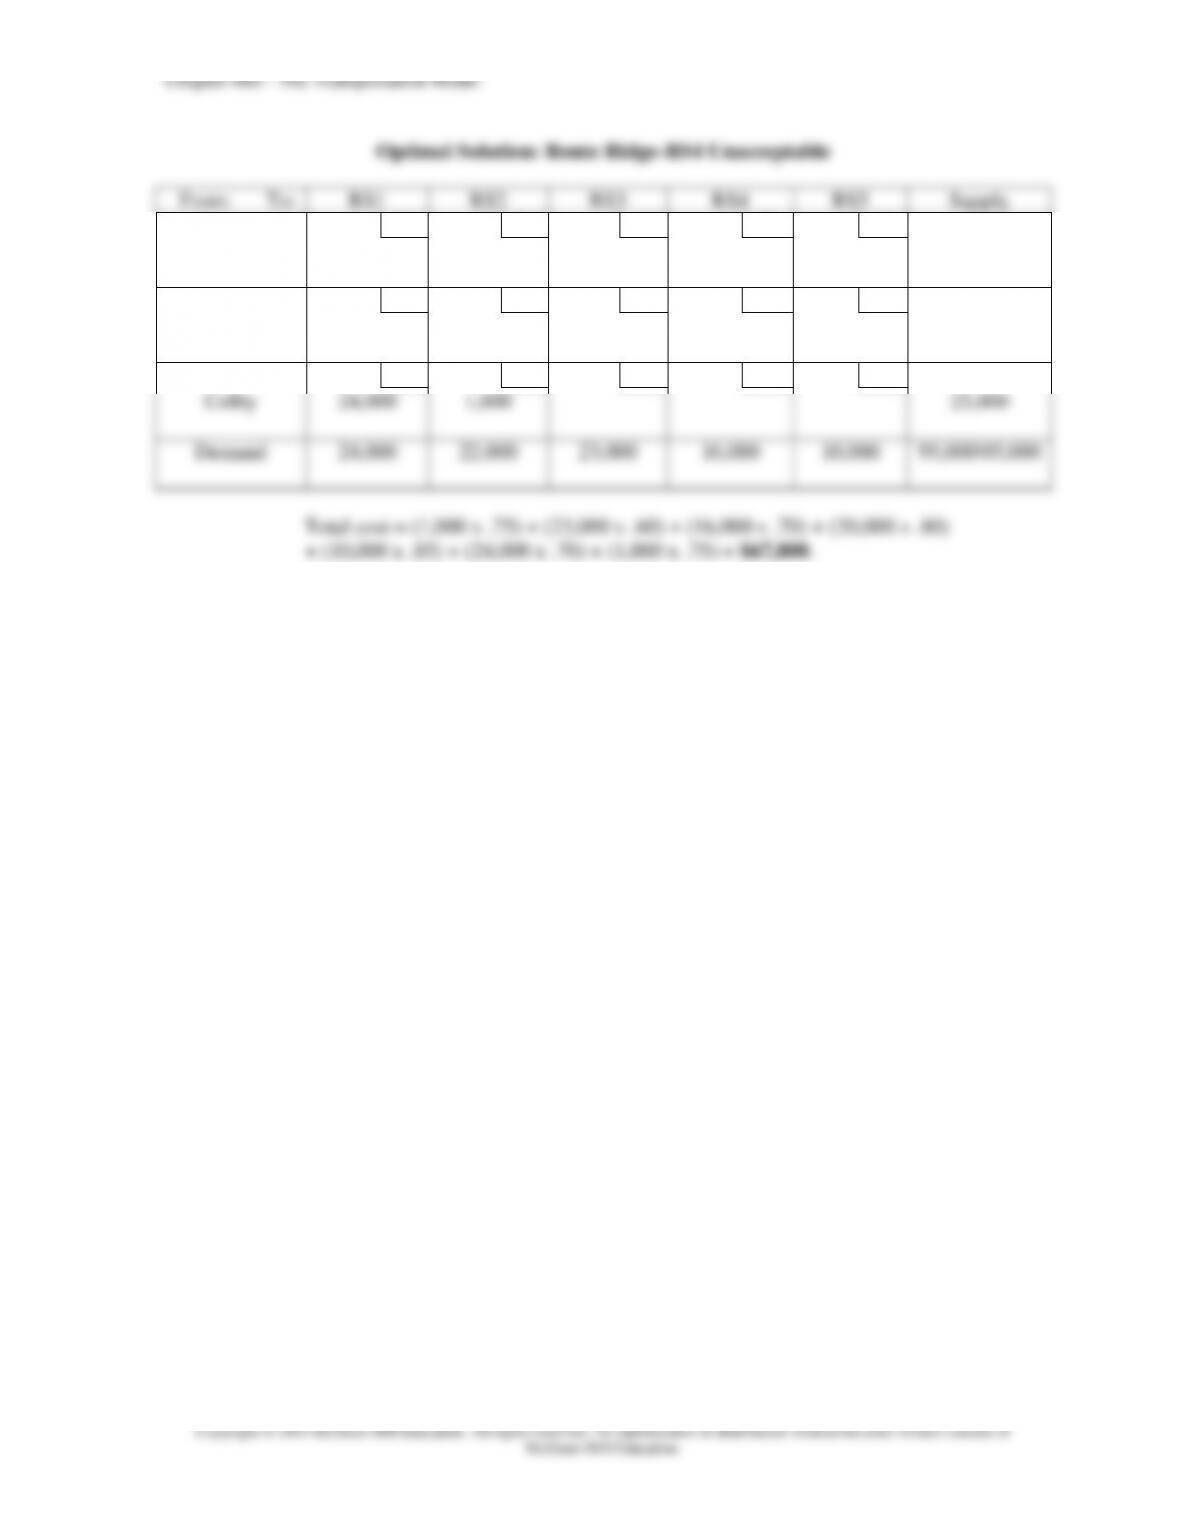
Optimal Solution: Route Ridge-RS4 Unacceptable
From:
To:
RS1
RS2
RS3
RS4
RS5
Supply
.80
.75
.60
.70
.90
Metro
1,000
23,000
16,000
40,000
.75
.80
.85
10
.85
Ridge
20,000
10,000
30,000
.70
.75
.70
.80
.80
Colby
24,000
1,000
25,000
Demand
24,000
22,000
23,000
16,000
10,000
95,000\95,000
Total cost = (1,000 x .75) + (23,000 x .60) + (16,000 x .70) + (20,000 x .80)
+ (10,000 x .85) + (24,000 x .70) + (1,000 x .75) = $67,800.
Chapter 08S – The Transportation Model
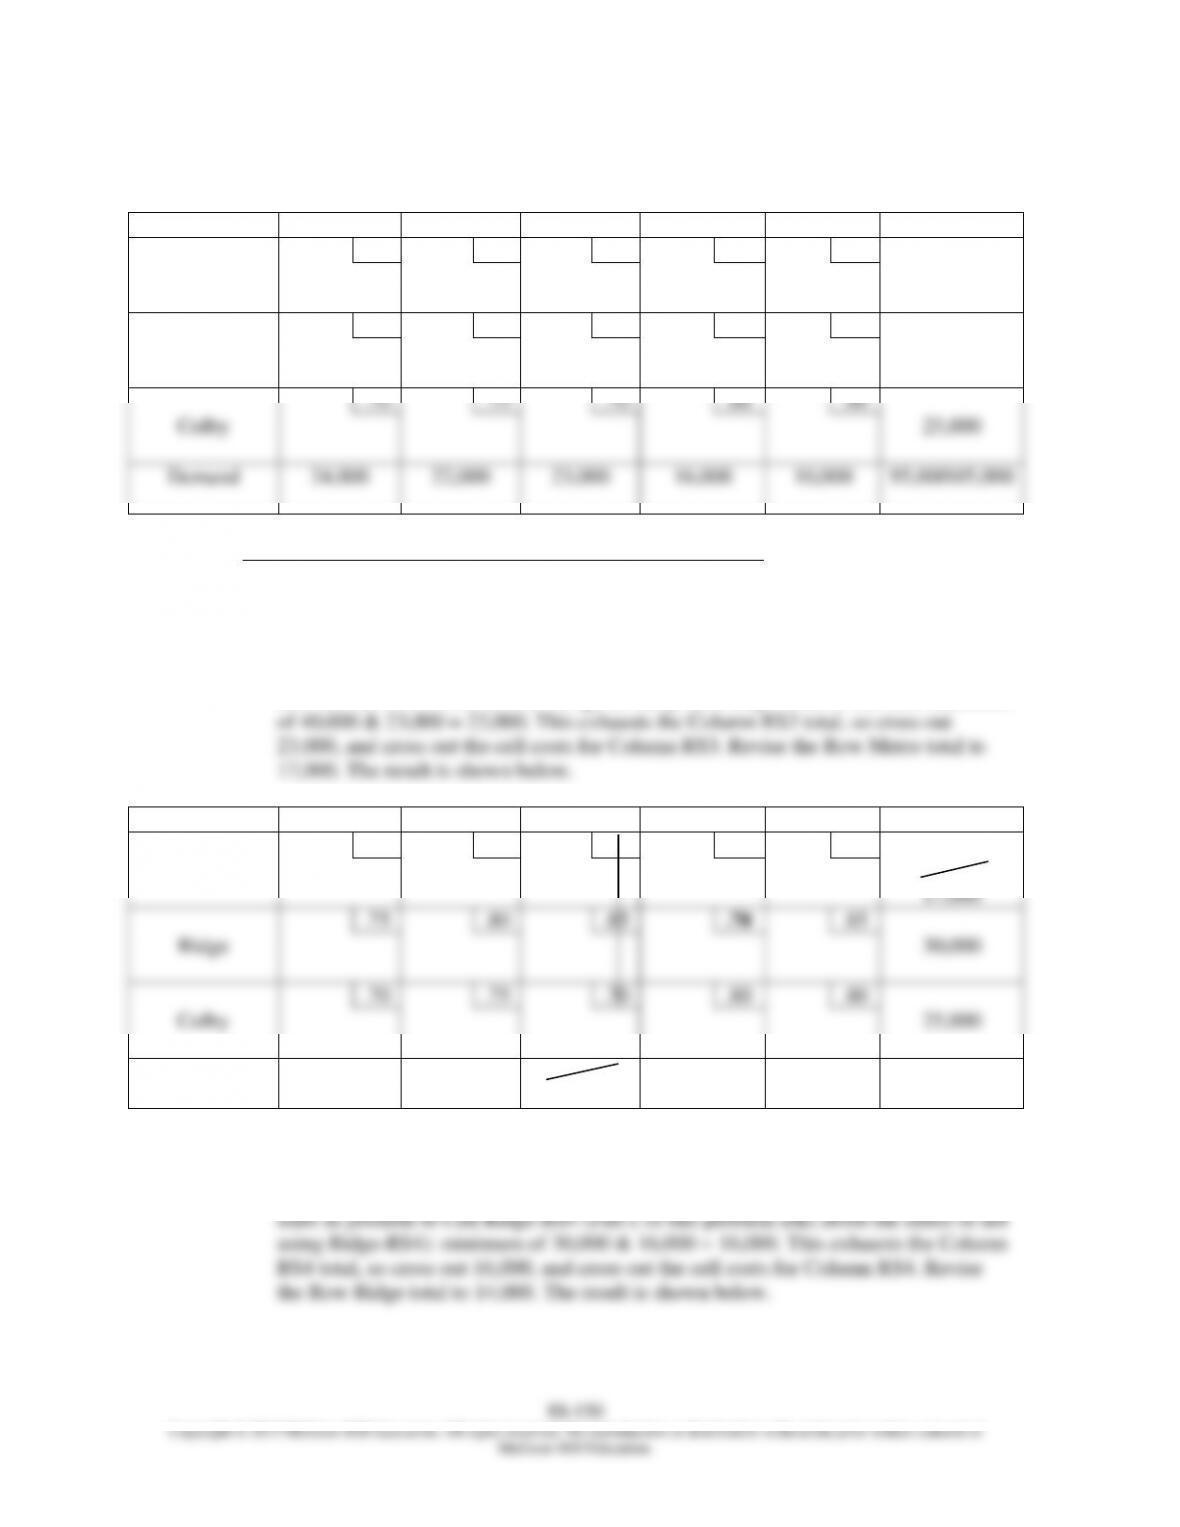
b. All routes are acceptable.
From:
To:
RS1
RS2
RS3
RS4
RS5
Supply
.80
.75
.60
.70
.90
Metro
40,000
.75
.80
.85
.70
.85
Ridge
30,000
.70
.75
.70
.80
.80
Colby
25,000
Demand
24,000
22,000
23,000
16,000
10,000
95,000\95,000
Step 1: Initial Solution with Intuitive Lowest-Cost Approach:
(a) Check to see if supply and demand are equal. They are equal—no dummy is
necessary.
(b) Find the cell in the table above that has the lowest unit transportation cost. Cell Metro-
RS3 has the lowest cost ($.60). Assign as many units as possible to this cell: minimum
From:
To:
RS1
RS2
RS3
RS4
RS5
Supply
.80
.75
.60
.70
.90
Metro
23,000
40,000
17,000
.75
.80
.85
.70
.85
Ridge
30,000
.70
.75
.70
.80
.80
Colby
25,000
Demand
24,000
22,000
23,000
16,000
10,000
95,000\95,000
(c) Find the cell (that is not crossed out) in the table above that has the next lowest unit
transportation cost. Cell Metro-RS4, Cell Ridge-RS4, and Cell Colby-RS1 are tied for
next lowest cost ($.70). Here, we will break the tie deliberately by assigning as many