Chapter 07S – Learning Curves
CHAPTER 07S
LEARNING CURVES
Teaching Notes
When dealing with learning curves, the decision maker is concerned about four distinct areas:
1. Starting point: This involves the initial time estimate of the process.
2. Shape of the curve and the rate of increase: In many cases, the shape of the learning curve will be
consistent with the traditional 70%, 80%, or 90% learning curves. However, in some instances,
the learning curve may be s-shaped and in rare instances, the shape of the learning curve may be a
straight line. It is important to know the shape of the curve before assuming a certain shape and
making predictions using that learning curve. Therefore, during the earlier stages of the process,
the decision maker must carefully study the shape by having different employees produce
different quantities and recording the job completion times. The shape of the curve is a function
of the specific job, rather than the individual worker. In addition, the faster (lower) the learning
rate, the lower the training costs due to employees learning faster.
3. Steady state: At a certain point during the learning process, the employee will reach a steady
state. This indicates the completion of the learning process based on the given technology and the
4. Quality of the product: As learning occurs, workers are working at a faster pace. We must make
sure that the quality of the product is not compromised.
This seems to be a topic that students grasp readily. The one area that some seem to have difficulties with
is finding cumulative times (e.g., length of time for units 6 through 10). I find that reminding them of how
they determine areas under the normal curve helps most overcome this difficulty. If they are currently
taking statistics, or have recently completed their first course in statistics, comparing the process of
finding cumulative learning curve amounts to the process of obtaining cumulative binomial or Poisson
probabilities is another possibility. The advantage of these latter tables over the normal is that they are
discrete instead of continuous, and students tend to equate these discrete probability tables more with the
learning curve tables.
Answers to Discussion and Review Questions
1. As the number of repetitions increases, the requisite “doubling” needed to achieve the rate
2. A rate of 100 percent might be desirable on an assembly line where balancing the workload along
3. A rate of 120 percent would imply that with each doubling of output, the time per unit actually
increased by 20 percent (this would be undesirable).
4. Additional supervision, training, repair technicians, expediters, etc. can contribute to the
improvement realized, which causes a decrease in direct labor cost per unit.
5. In addition to actual learning, there are supervision, methods improvements, preproduction
planning, scheduling, and motivation.
6. Every change makes the job slightly different. The old method must be replaced with a new
method that must be learned. The scallops are actually “mini” learning curves.
7S-2
Education.
7. Learning curves are useful in cost estimation, bidding, contract negotiation, pricing new products,
and monitoring the improvement of trainees.
8. A learning curve might tip up toward the end of a job if certain resources were transferred to new
9. The implication of point #7 is that time per unit will decrease more slowly because the worker is
farther along the curve.
10. If a sales manager intentionally overestimated the amount of learning for a new job to win a
Solutions
Notes for Problems:
Note: P = Learning curve %
Table Factors (t.f.)
T3 = time for third unit
Unit factors are < 1.000
T1–3 = time for first three units
Cumulative factors are > 1.000
1. Given: An aircraft company has an order to refurbish 18 aircraft. Learning curve percentage =
80%. IE estimates that the first plane will take 300 hours.
T1 = 300 hr. P = 80%.
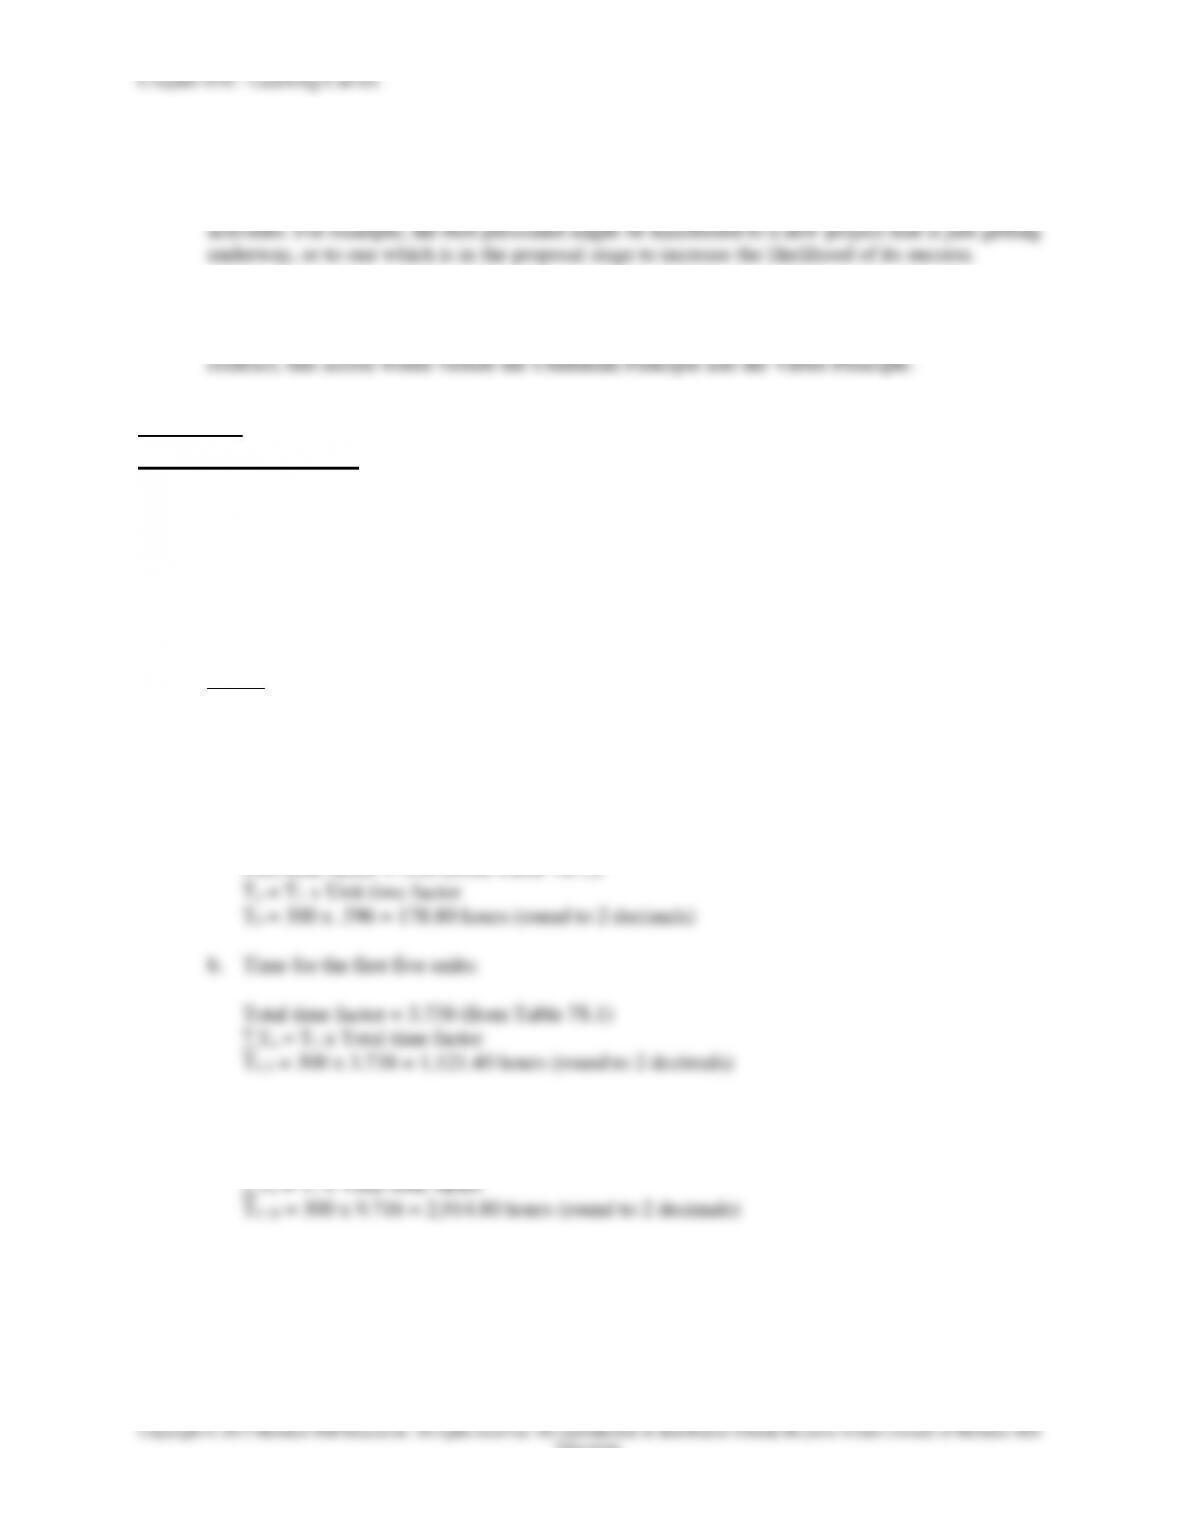
a. Time for the fifth unit:
Unit time factor = .596 (from Table 7S.1))
c. Time for all 18 units:
Total time factor = 9.716 (from Table 7S.1)
7S-3
Education.
2. Given: Initial unit of a 12-unit job required 80 hours. Calculate the time to complete the 4th unit
under the different learning curve percentages below.
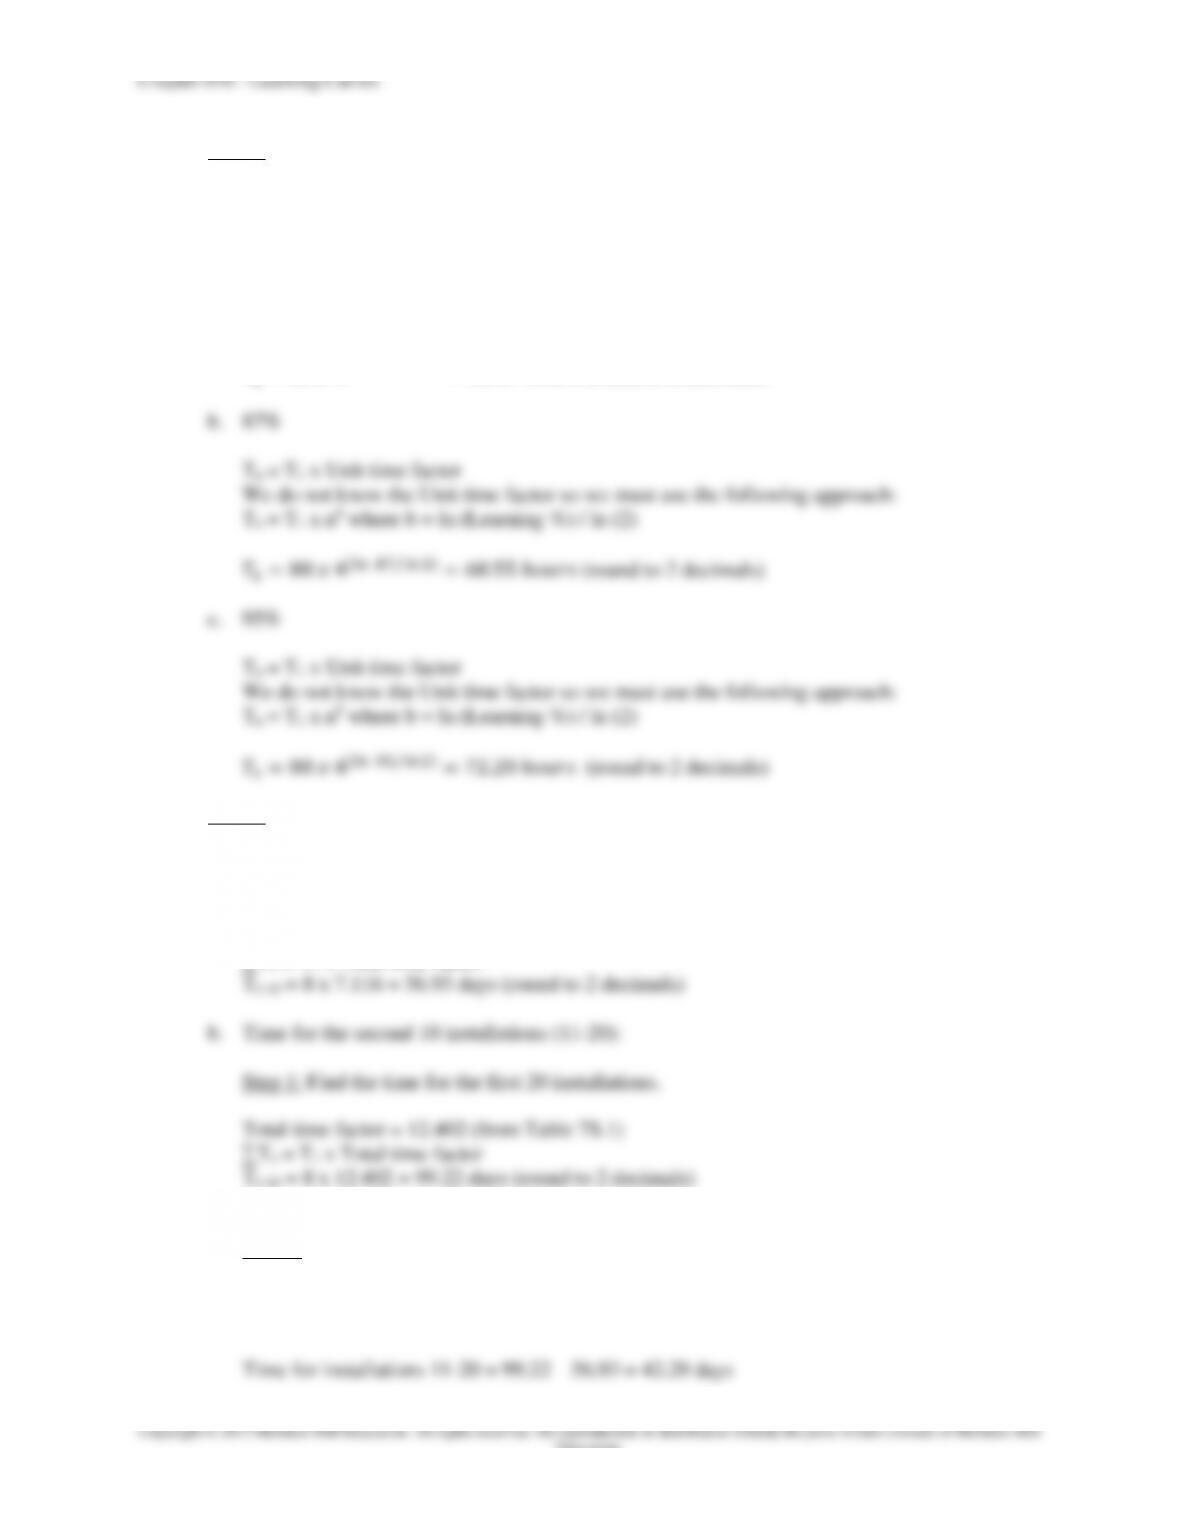
a. 72%
Tn = T1 x Unit time factor
We do not know the Unit time factor so we must use the following approach:
Tn = T1 x nb where b = ln (Learning %) / ln (2)
(round to 2 decimals)
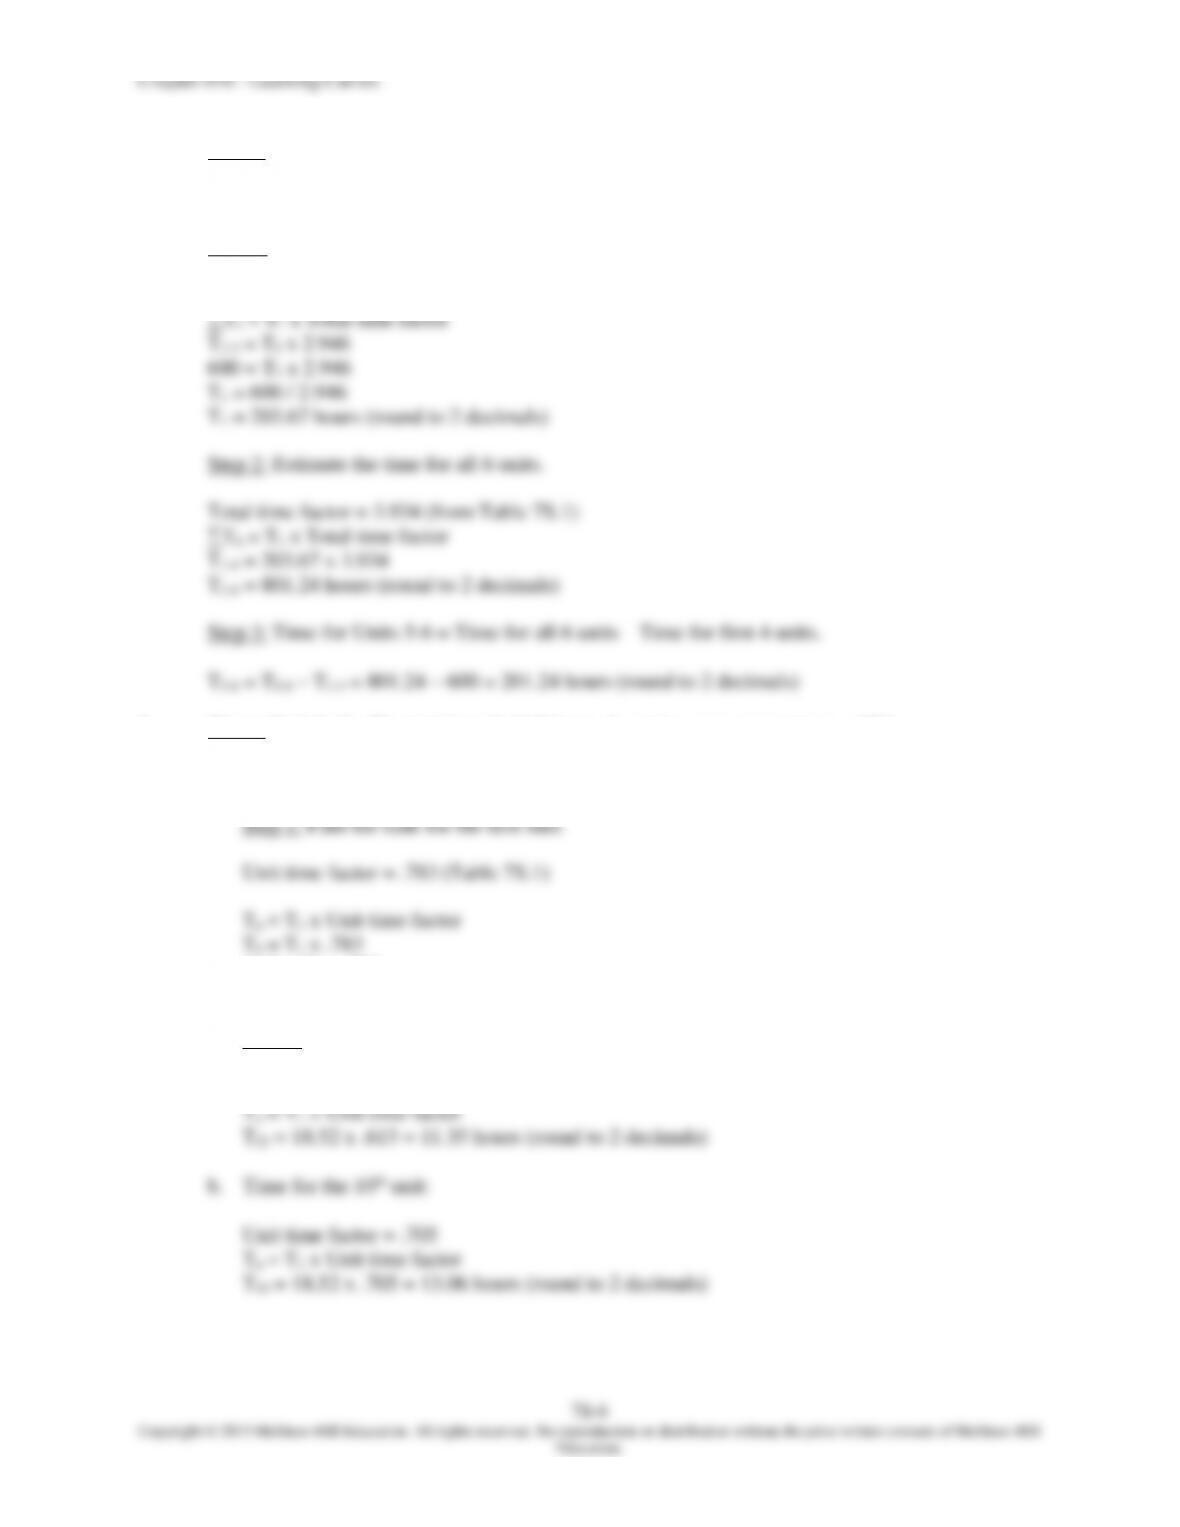
3. Given: Job calls for installing 30 security systems. Learning curve percentage = 85%. Estimate
for first job = 8 days.
a. Time for first 10 installations:
Total time factor = 7.116 (from Table 7S.1)
∑Tn = T1 x Total time factor
Step 2: Determine the time for installations 11-20.
Time for installations 11-20 = Time for the first 20 installations – Time for the first 10
installations.
Chapter 07S – Learning Curves
7S-4
Education.
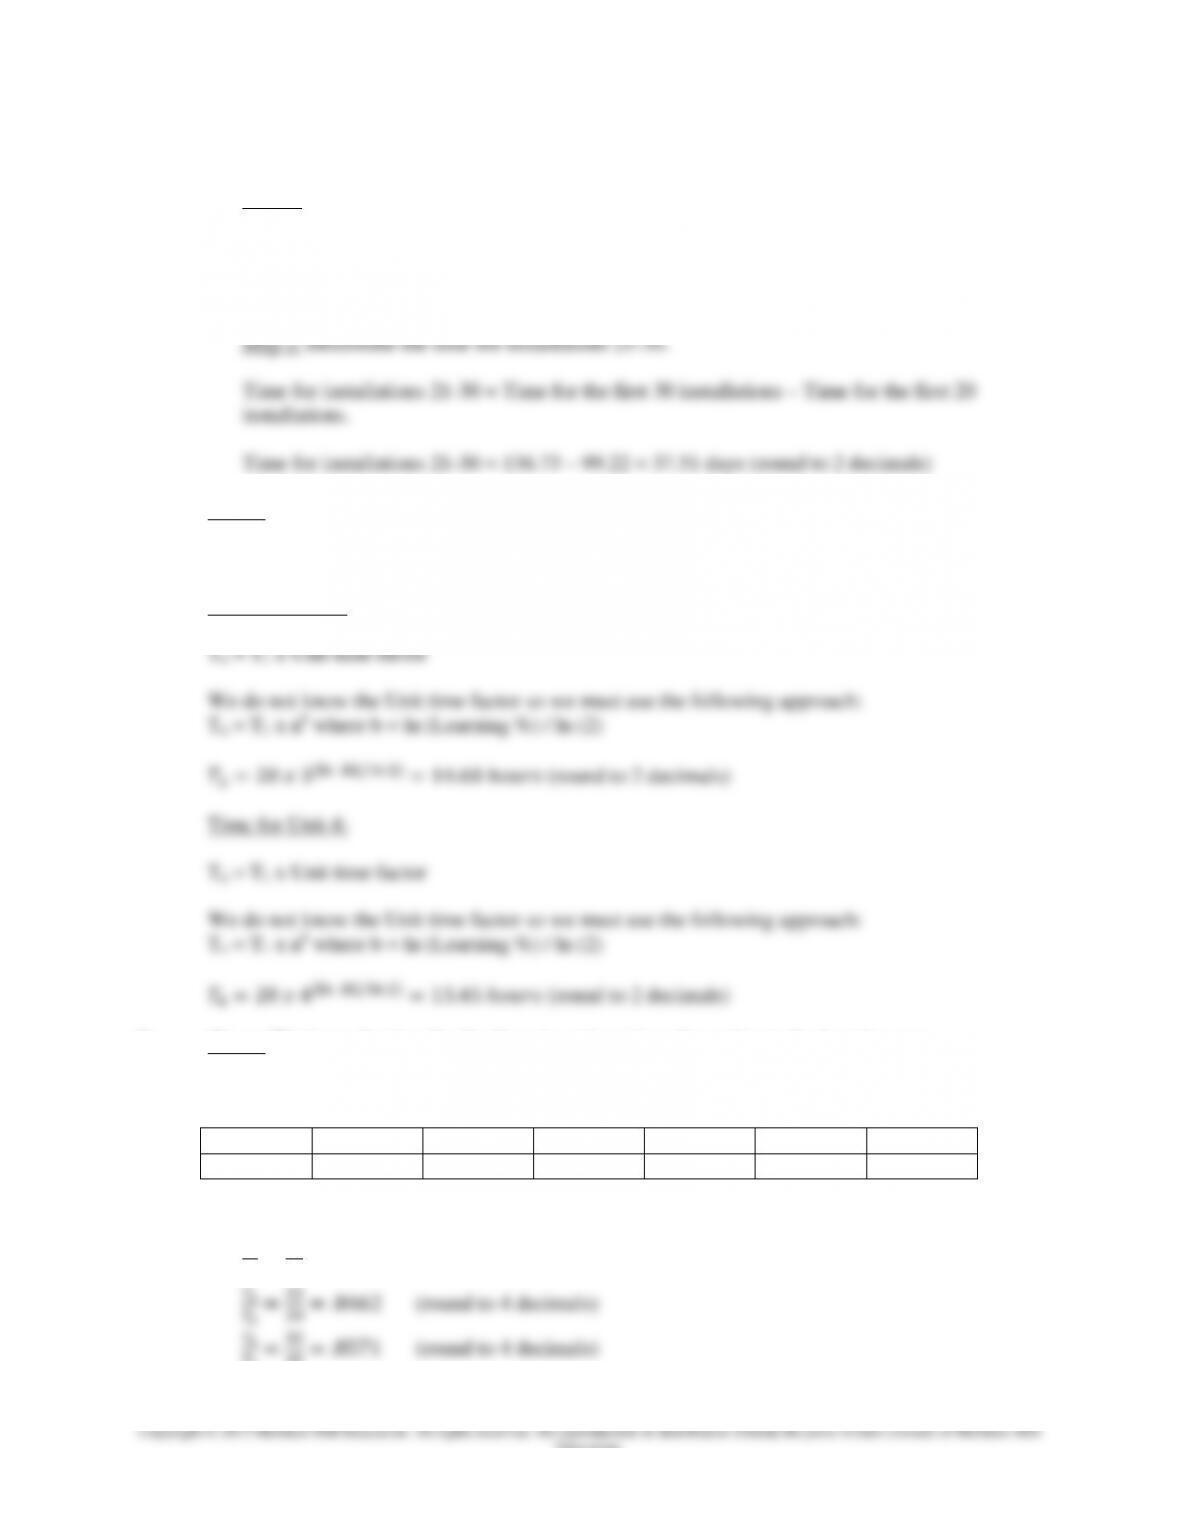
c. Time for the final 10 installations (21-30):
Step 1: Find the time for the first 30 installations.
Total time factor = 17.091 (from Table 7S.1)
∑Tn = T1 x Total time factor
T1-30 = 8 x 17.091 = 136.73 days (round to 2 decimals)
4. Given: A job has a learning curve percentage = 82%. Time for first unit = 20 hours.
T1 = 20 hr. P = 82%.
Time for Unit 3:
5. Given: We know the time for the first six units and need to estimate the learning curve
percentage.
Unit
1
2
3
4
5
6
Time
46
39
35
33
32
30
a. Estimate P based on the doubling concept.
(round to 4 decimals)
1 (round to 4 decimals)
7S-5
Copyright © 2015 McGraw-Hill Education. All rights reserved. No reproduction or distribution without the prior written consent of McGraw-Hill
Education.
Total time factor = 17.091 (from Table 7S.1)
∑Tn = T1 x Total time factor
T1-30 = 46 x 17.091 = 786.19 days (round to 2 decimals)
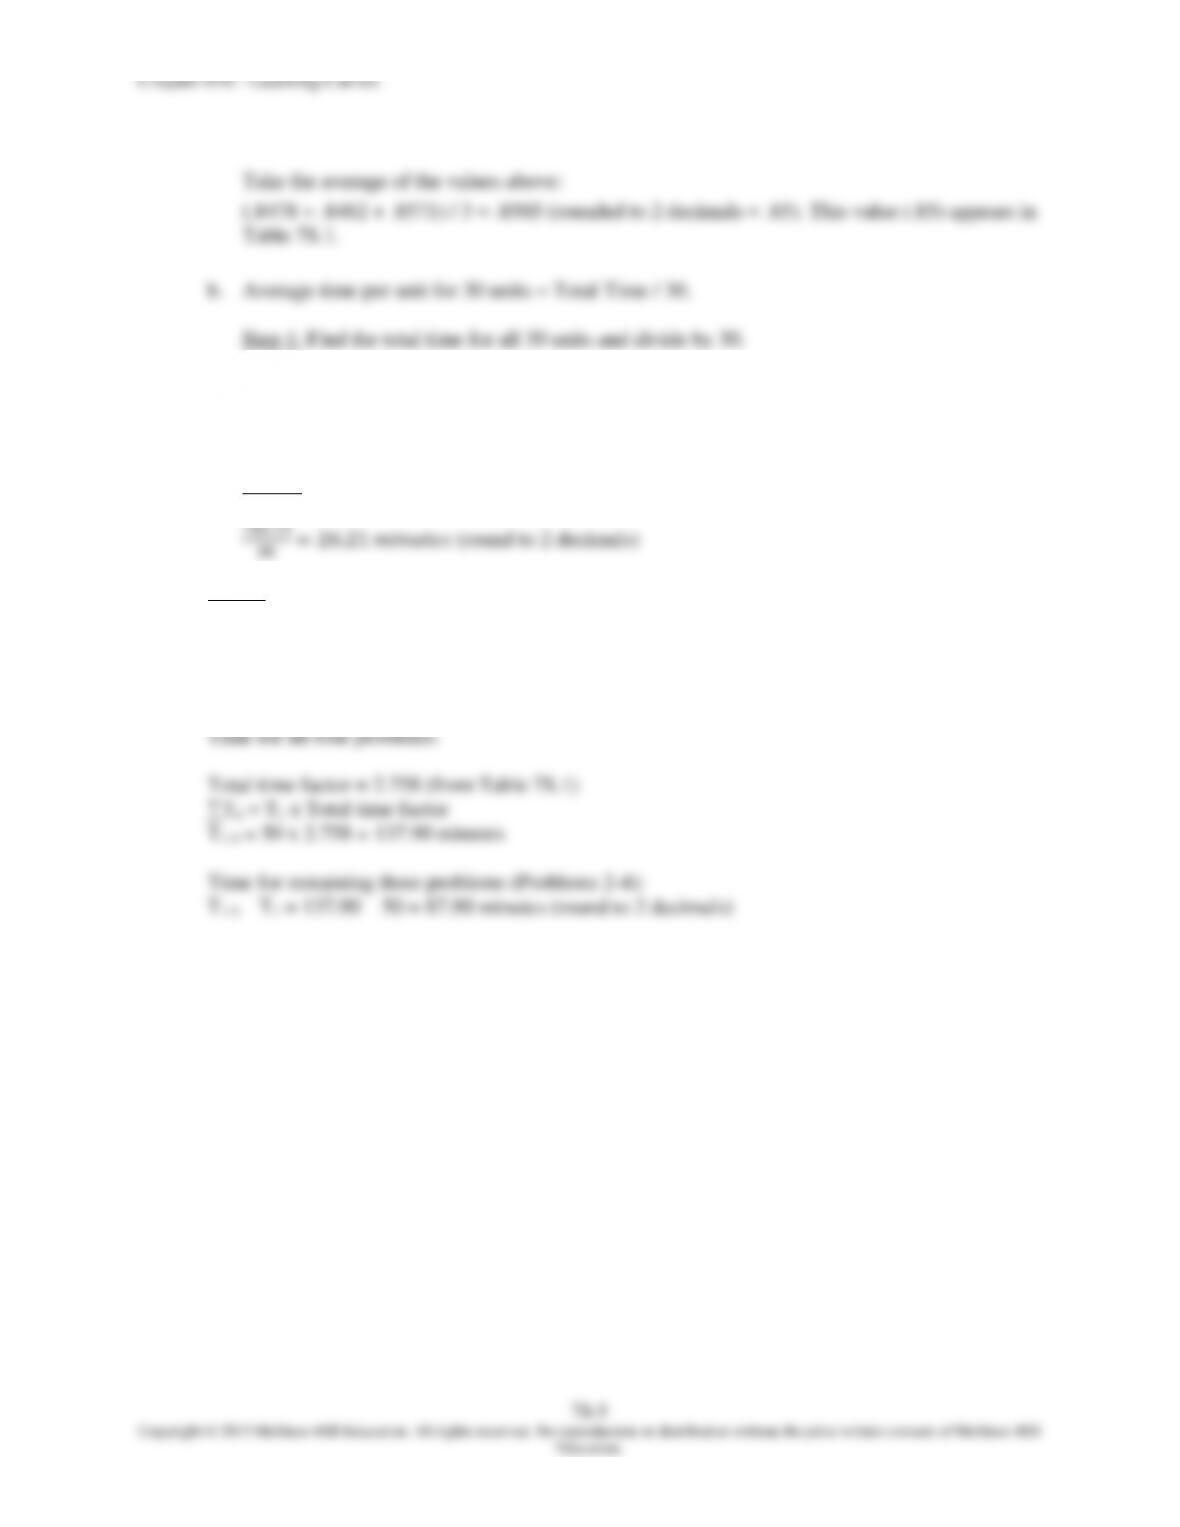
Step 2: Divide the total time by 30.
6. Given: The first problem took 50 minutes. The student must work out three more problems that
are similar. Learning curve percentage = 70%.
Time for remaining three problems (Problems 2-4) = Time for all four problems – Time for first
problem.
7S-7
Copyright © 2015 McGraw-Hill Education. All rights reserved. No reproduction or distribution without the prior written consent of McGraw-Hill
Education.
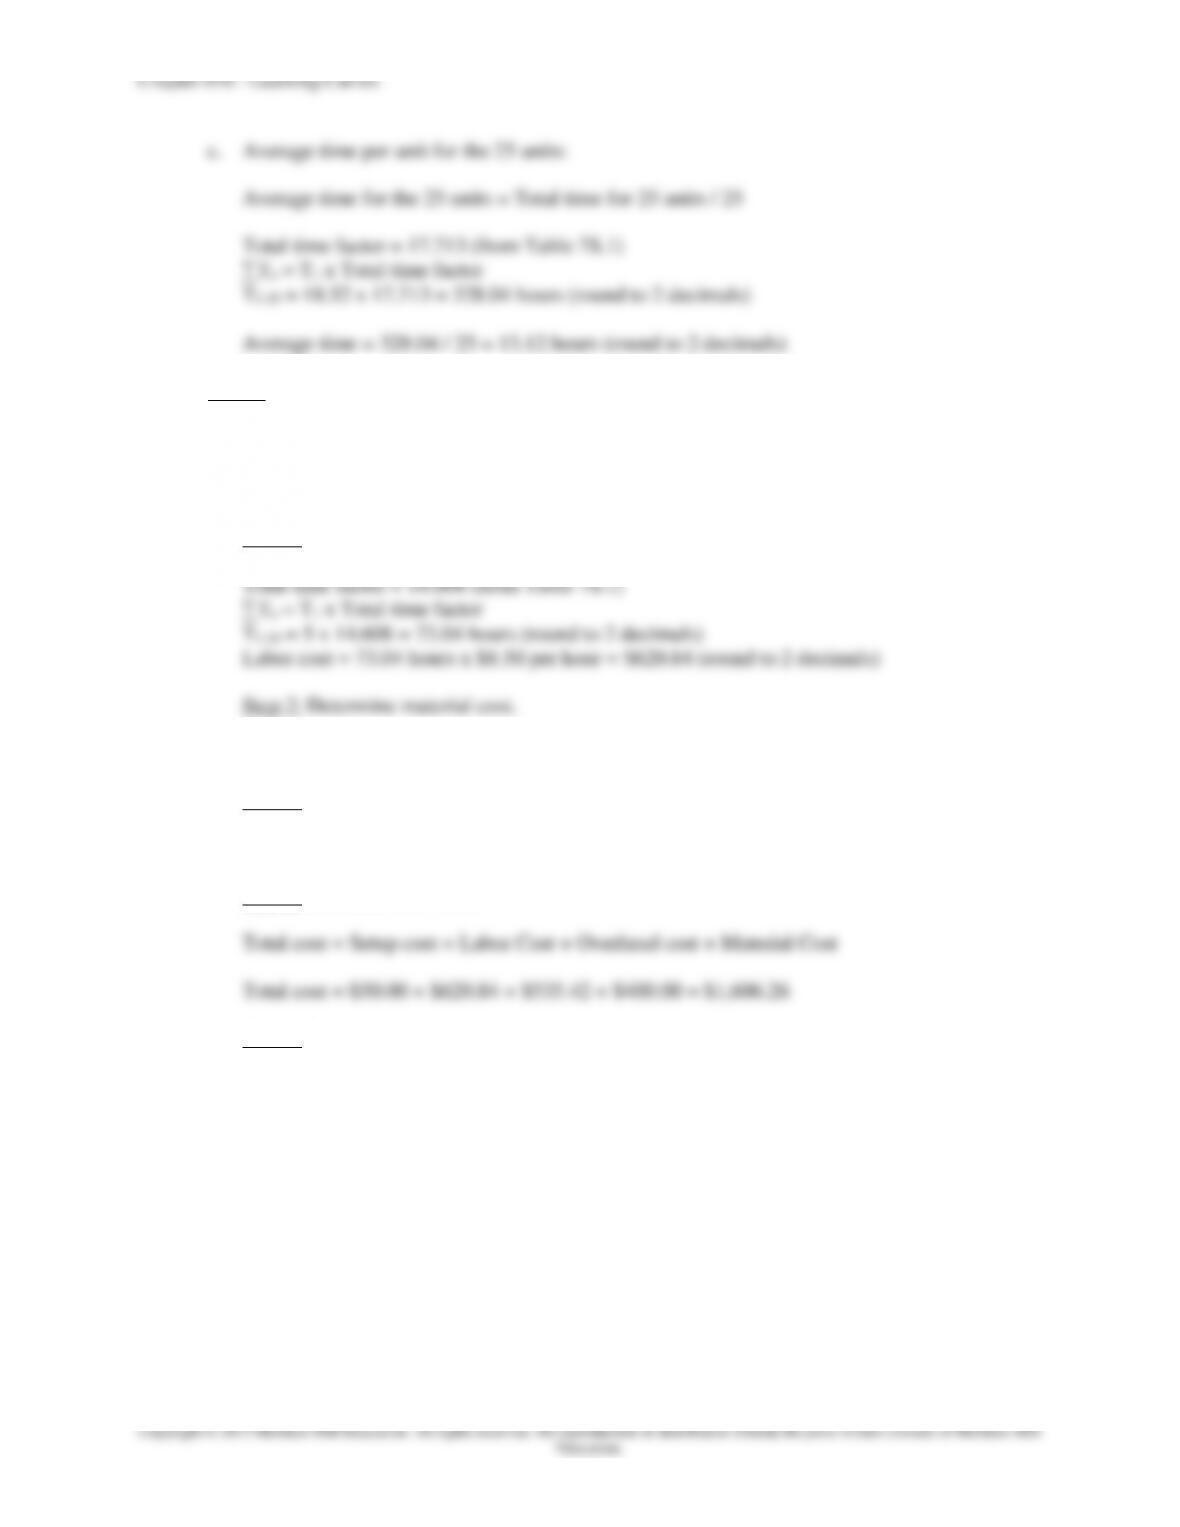
c. Average time per unit for the 25 units:
Average time for the 25 units = Total time for 25 units / 25
Total time factor = 17.713 (from Table 7S.1)
∑Tn = T1 x Total time factor
T1-25 = 18.52 x 17.713 = 328.04 hours (round to 2 decimals)
Average time = 328.04 / 25 = 13.12 hours (round to 2 decimals)
9. Given: Labor cost to produce an item = $8.50 per hour. Setup cost = $50.00. Material cost =
$20.00 per unit. Learning curve percentage = 90%. Overhead is charged at 50% of labor,
materials, and setup costs. Time for first unit = 5 hours. Possible purchase cost per unit = $88.50.
a. Unit cost for 20 units:
Step 1: Determine labor time and costs.
Material cost = 20 units x $20 per unit = $400.00
Step 3: Determine overhead cost.
Overhead cost = 0.50 x ($620.84 + $400.00 + $50.00) = $535.42 (round to 2 decimals)
Step 4: Determine total cost.
Step 5: Determine average cost.
Average cost per unit = $1,606.26 / 20 units = $80.31
b. Minimum production quantity necessary to make product cost < purchase cost ($88.50/unit)
We have two unknowns—the number of units and the Total time factor. We must use trial
and error to find the quantity (Q) at which Unit cost = $20.00.
We know that the production cost per unit = $80.31 per unit for 20 units, which is less than
the possible purchase cost of $88.50 per unit. Therefore, we will have to experiment with
values < 20 and observe as the production cost per unit increases.
Chapter 07S – Learning Curves
7S-8
After experimenting, we find that Q = 10 units comes closest as shown below:
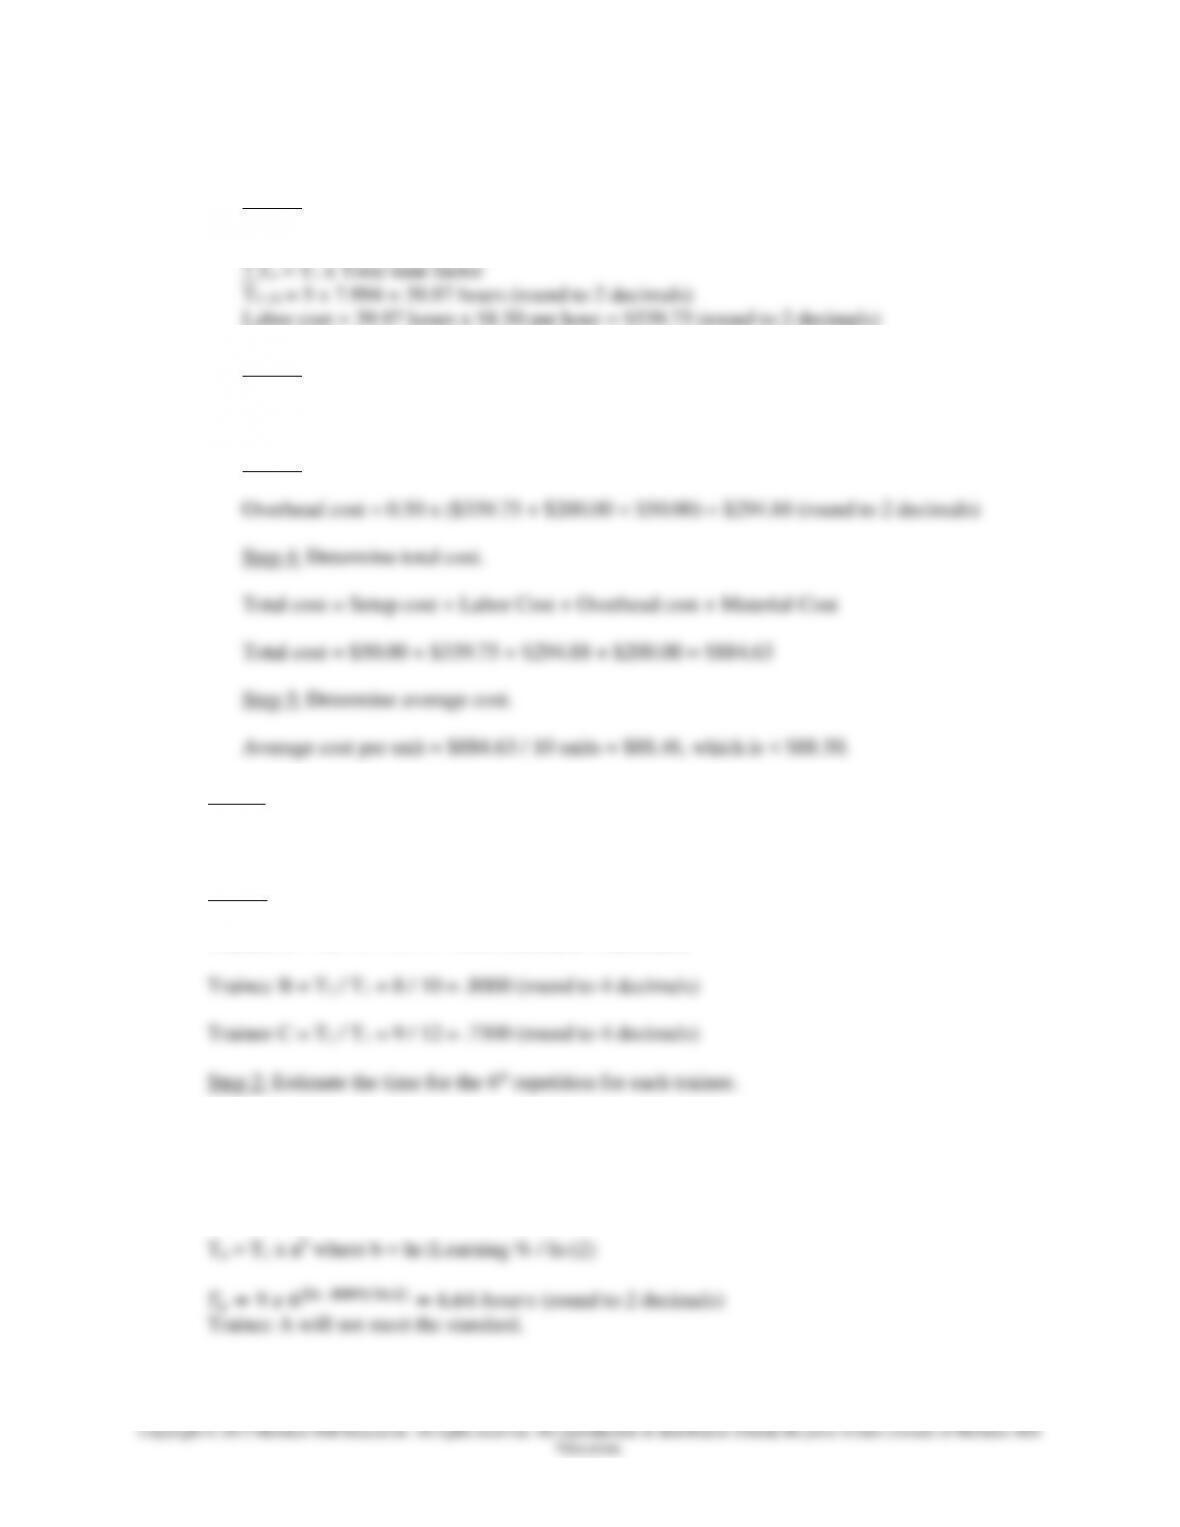
Step 1: Determine labor time and costs.
Total time factor = 7.994 (from Table 7S.1)
Labor cost = 39.97 hours x $8.50 per hour = $339.75 (round to 2 decimals)
Step 2: Determine material cost.
Material cost = 10 units x $20 per unit = $200.00
Step 3: Determine overhead cost.
10. Given: Standard for a trainee to be able to complete the 6th repetition of an operation ≤ 6 hours.
Three trainees have completed two repetitions each. Trainee A’s times were 9 hours & 8 hours.
Trainee B’s times were 10 hours & 8 hours. Trainee C’s times were 12 hours & 9 hours.
Step 1: Estimate the learning curve percentage for each trainee.
Trainee A = T2 / T1 = 8 / 9 = .8889 (round to 4 decimals)
Trainee A: Trainee A’s learning curve percentage does not appear in Table 7S.1. Therefore, we
use the formula.
T1 = 9 hours. P = .8889.
Chapter 07S – Learning Curves
Trainee B:
T1 = 10 hours. P = .80.
Unit time factor = .561 (Table 7S.1)
Tn = T1 x Unit time factor
T6 = 10 x .561
T6 = 5.61 hours (rounded to 2 decimals)
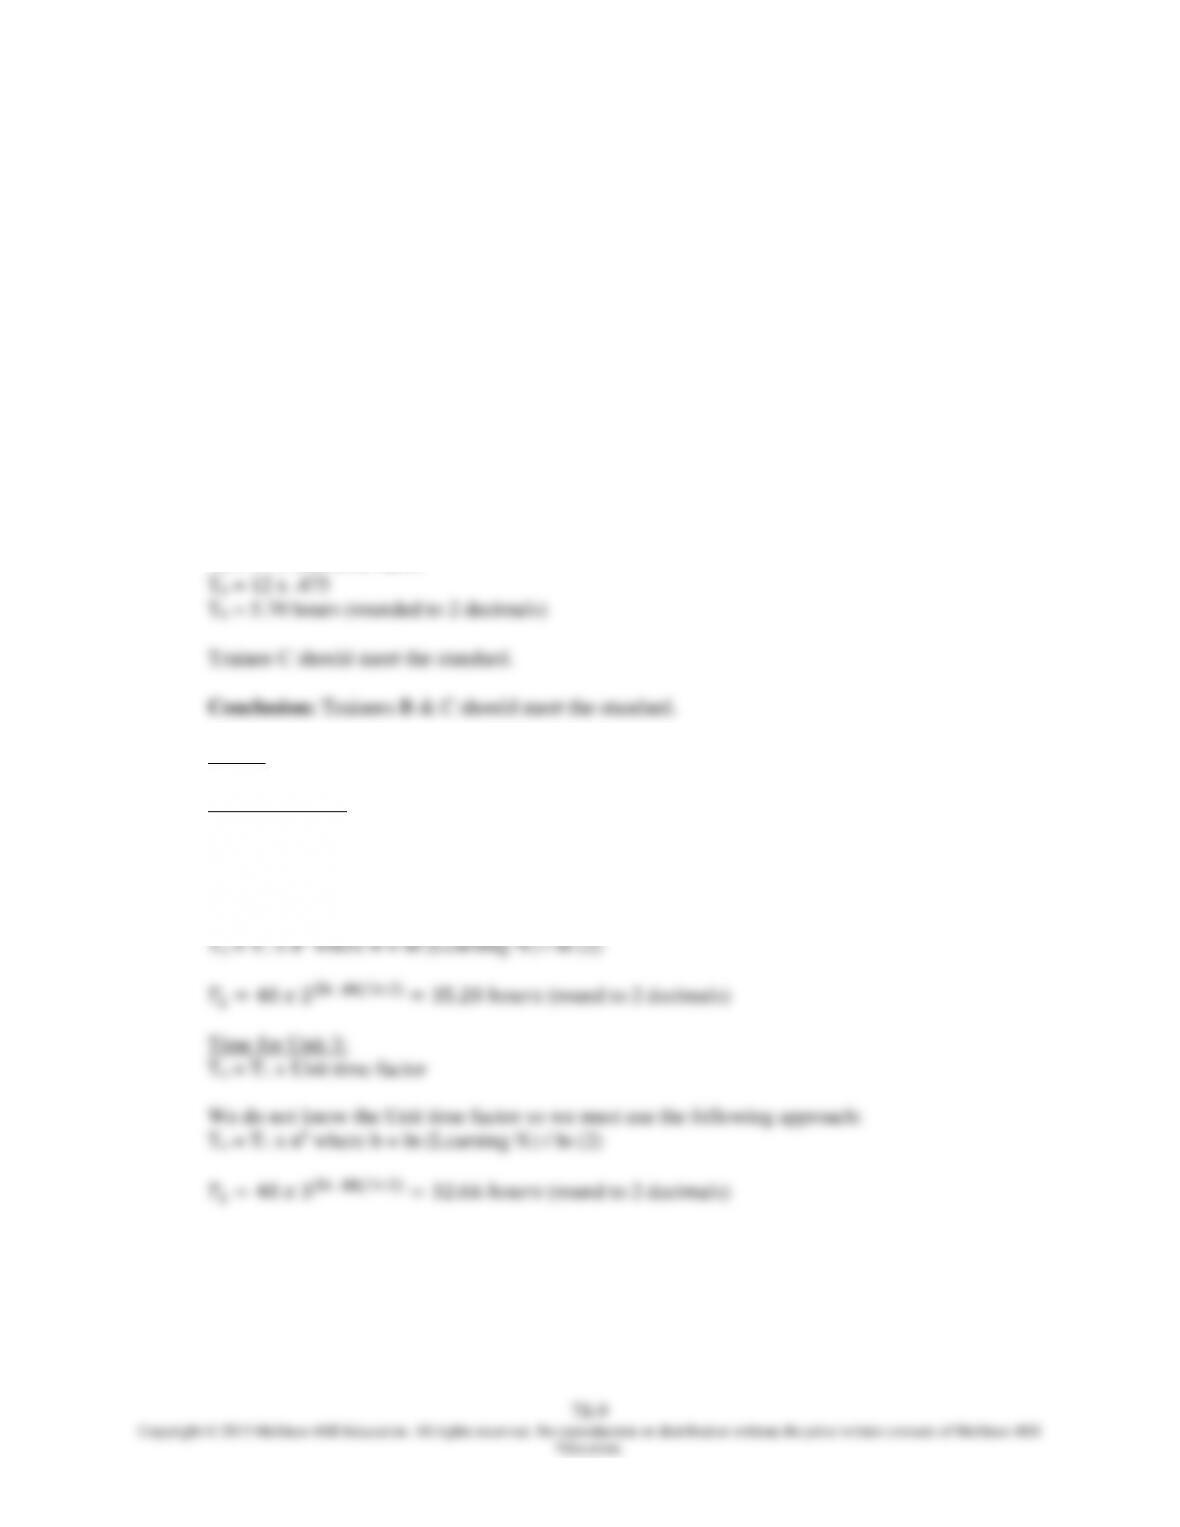
Trainee B should meet the standard.
Trainee C:
T1 = 12 hours. P = .75.
Unit time factor = .475 (Table 7S.1)
Tn = T1 x Unit time factor
11. Given: Unit 1 time = 40 hours. Learning curve percentage = 88%.
Time for Unit 2:
Tn = T1 x Unit time factor
We do not know the Unit time factor so we must use the following approach:
Chapter 07S – Learning Curves
7S–10
Education.
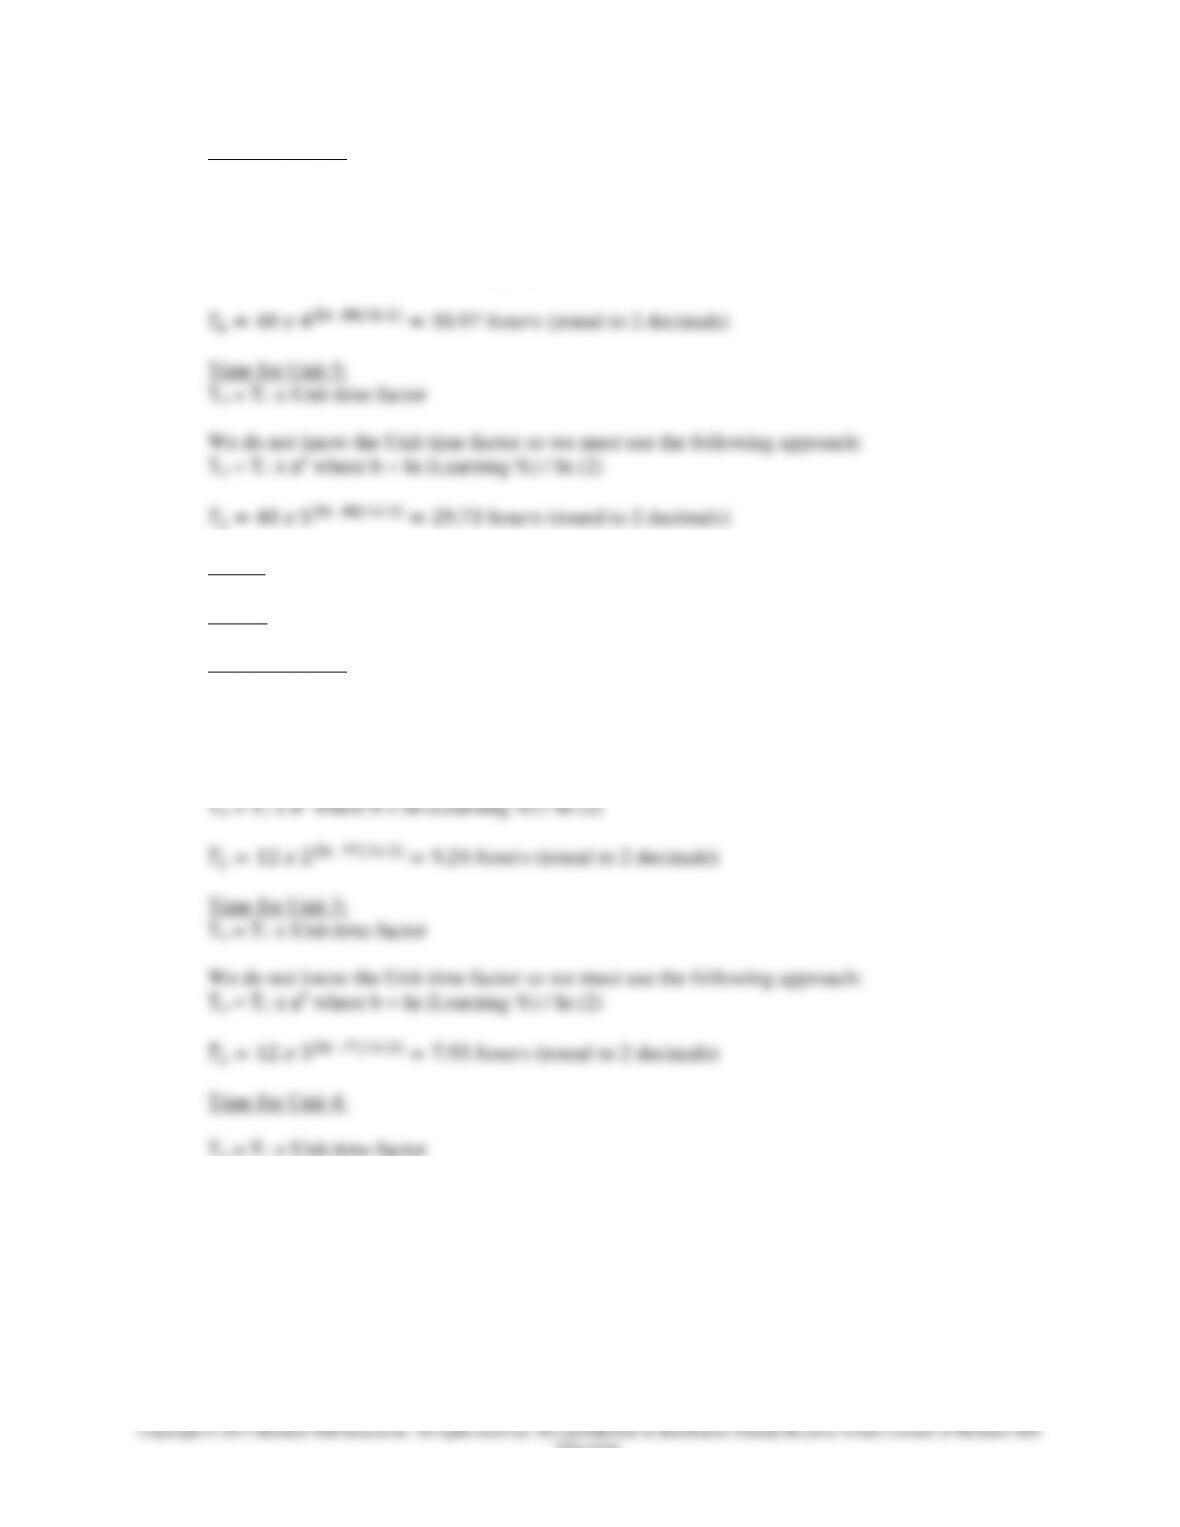
Time for Unit 4:
Tn = T1 x Unit time factor
We do not know the Unit time factor so we must use the following approach:
Tn = T1 x nb where b = ln (Learning %) / ln (2)
12. Given: Initial unit of a 5-unit job took 12 hours. Learning curve percentage = 77%.
Step 1: Estimate the times for Units 2, 3, 4, & 5.
Time for Unit 2:
Tn = T1 x Unit time factor
We do not know the Unit time factor so we must use the following approach:
We do not know the Unit time factor so we must use the following approach:
Tn = T1 x nb where b = ln (Learning %) / ln (2)
(round to 2 decimals)