Chapter 09 – Management of Quality
9-11
Solutions
1.
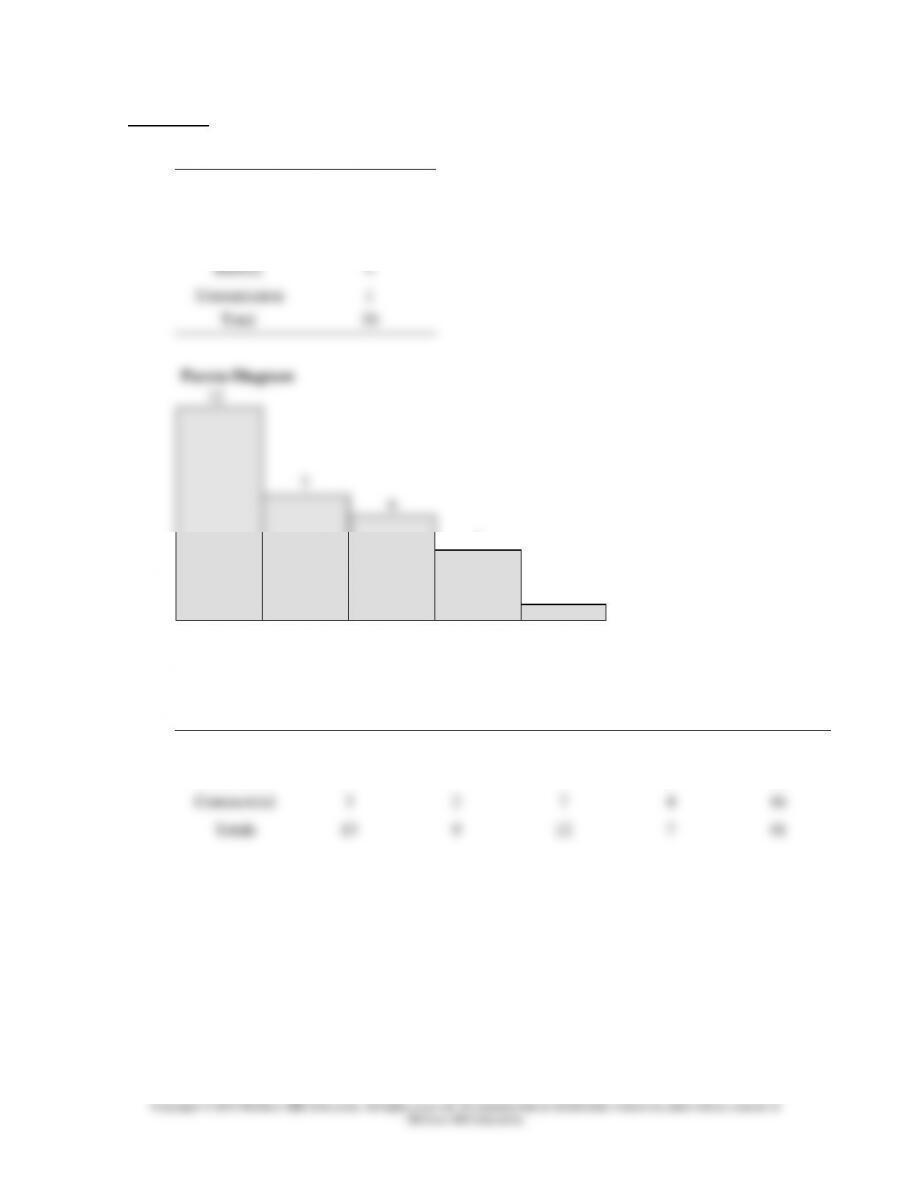
Check Sheet
Work Type
Frequency
Lube and Oil
12
Brakes
7
Tires
6
Battery
4
Transmission
1
Total
30
Pareto Diagram
2.
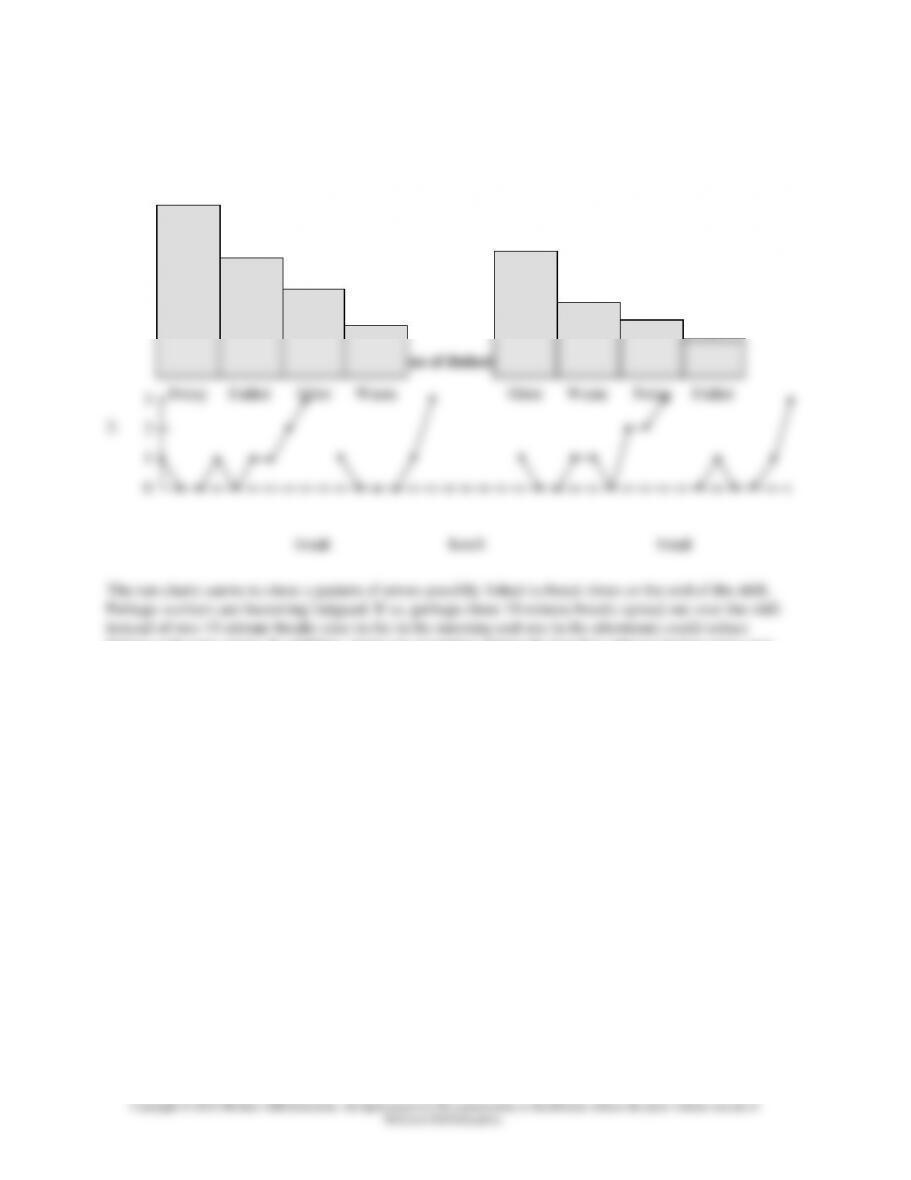
Check Sheet
Problem Check Sheet
Customer Type
Noisy
Failed
Odor
Warm
Totals
Residential
10
7
5
3
25
Commercial
3
2
7
4
16
Totals
13
9
12
7
41
12
7
6
4
1
Lube & Oil
Brakes
Tires
Battery
Trans.
Chapter 09 – Management of Quality
9-12
Pareto Diagrams
Residential customers Commercial customers
fatigue and some errors. In addition, errors are occurring during the last few minutes before noon and
at the end of the shift, and those periods should be given management’s attention.
10
7
5
3
7
4
3
2
Chapter 09 – Management of Quality
9-13
4.
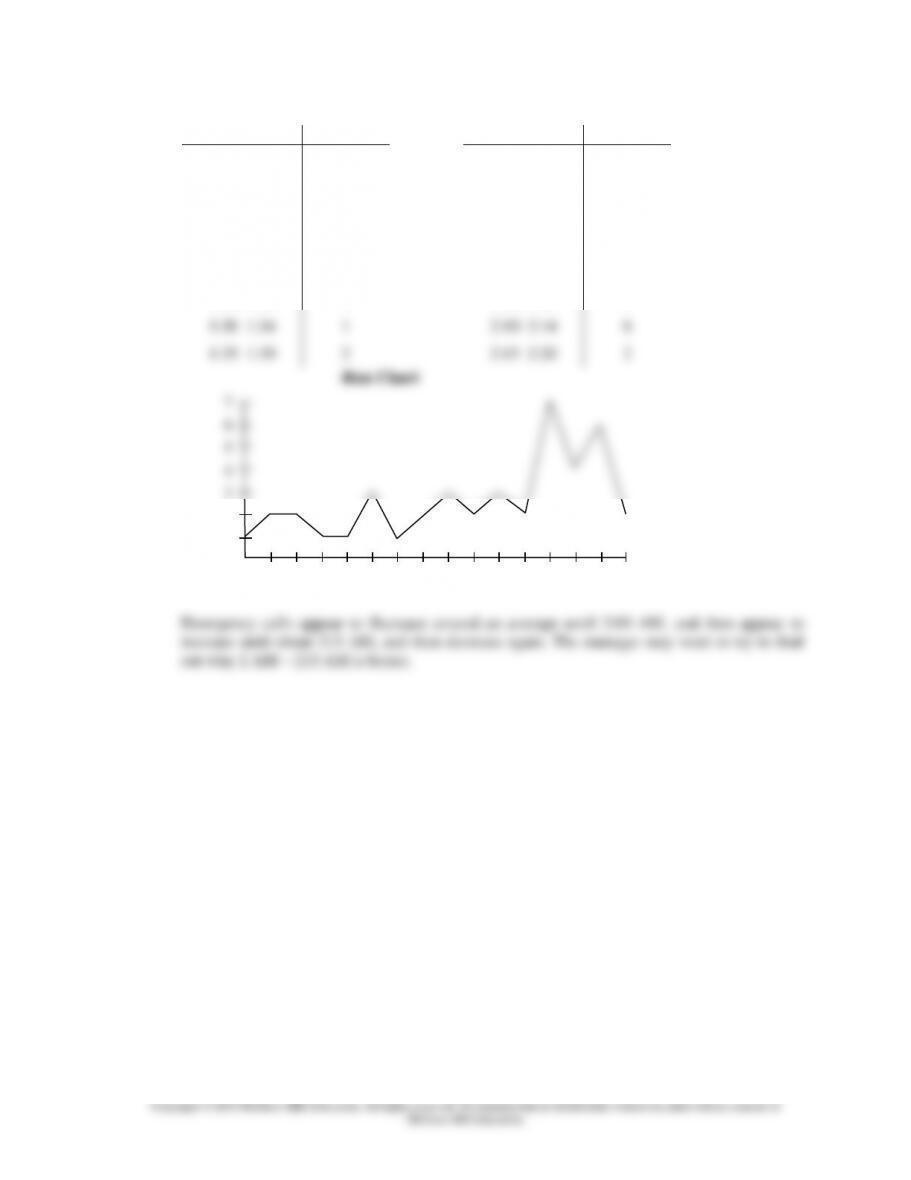
Time
Count
Time
Count
1:00–1:04
1
1:40–1:44
3
1:05–1:09
2
1:45–1:49
2
1:10–1:14
2
1:50–1:54
3
1:15–1:19
1
1:55–1:59
2
1:20–1:24
1
2:00–2:04
7
1:25–1:29
3
2:05–2:09
4
1:30–1:34
1
2:10–2:14
6
1:35–1:39
2
2:15–2:20
2
Run Chart
Emergency calls appear to fluctuate around an average until 2:00 AM, and then appear to
increase until about 215 AM, and then decrease again. The manager may want to try to find
out why 2 AM – 215 AM is busier.
7
6
5
4
3
2
1
0
Time
Chapter 09 – Management of Quality
9-14
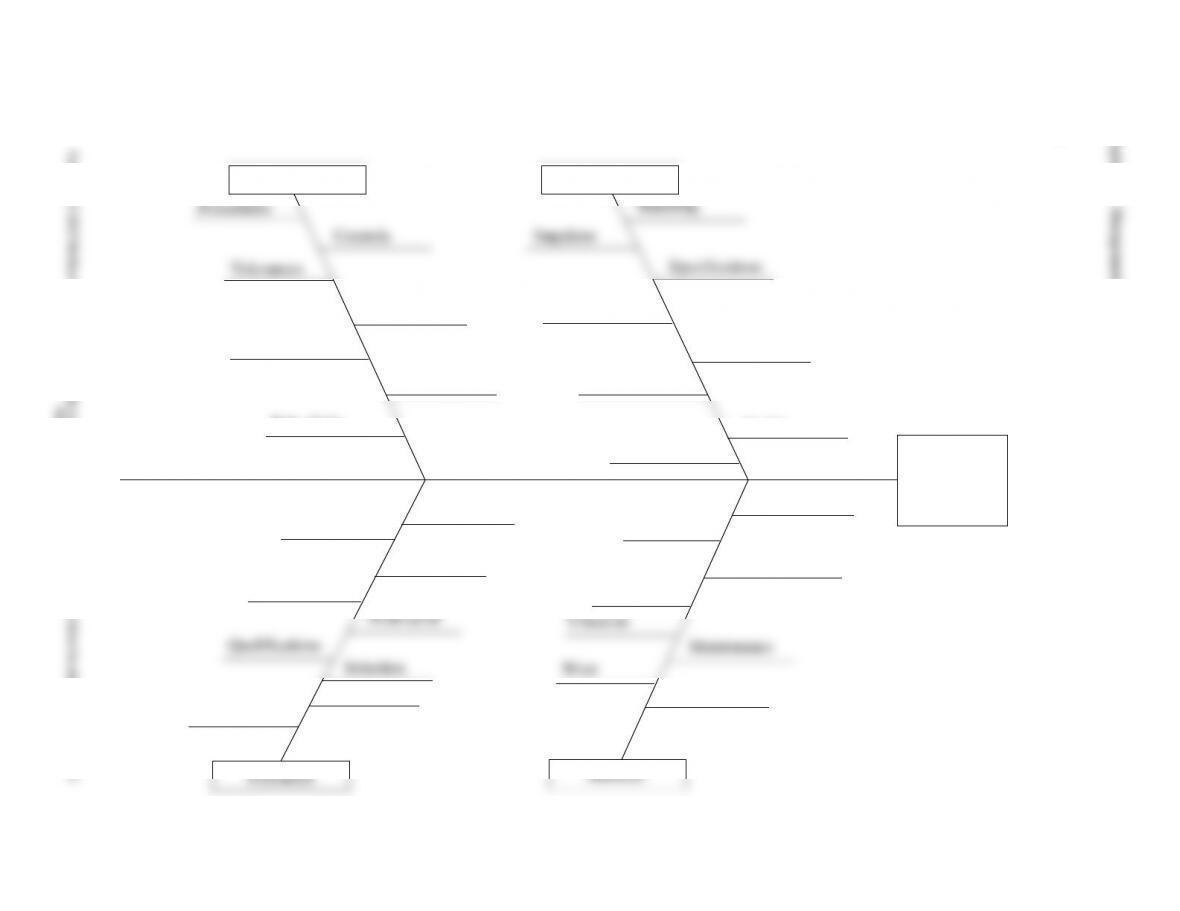
5.
6.
Supplier
Weather
Breakdown
Capacity
Orders
Traffic
Scheduling
Wrong
information
Late to
supplier
Missing
information
Inadequate
recordkeeping
Insufficient
capacity
Poor
scheduling
Delivery
system
Late
deliveries
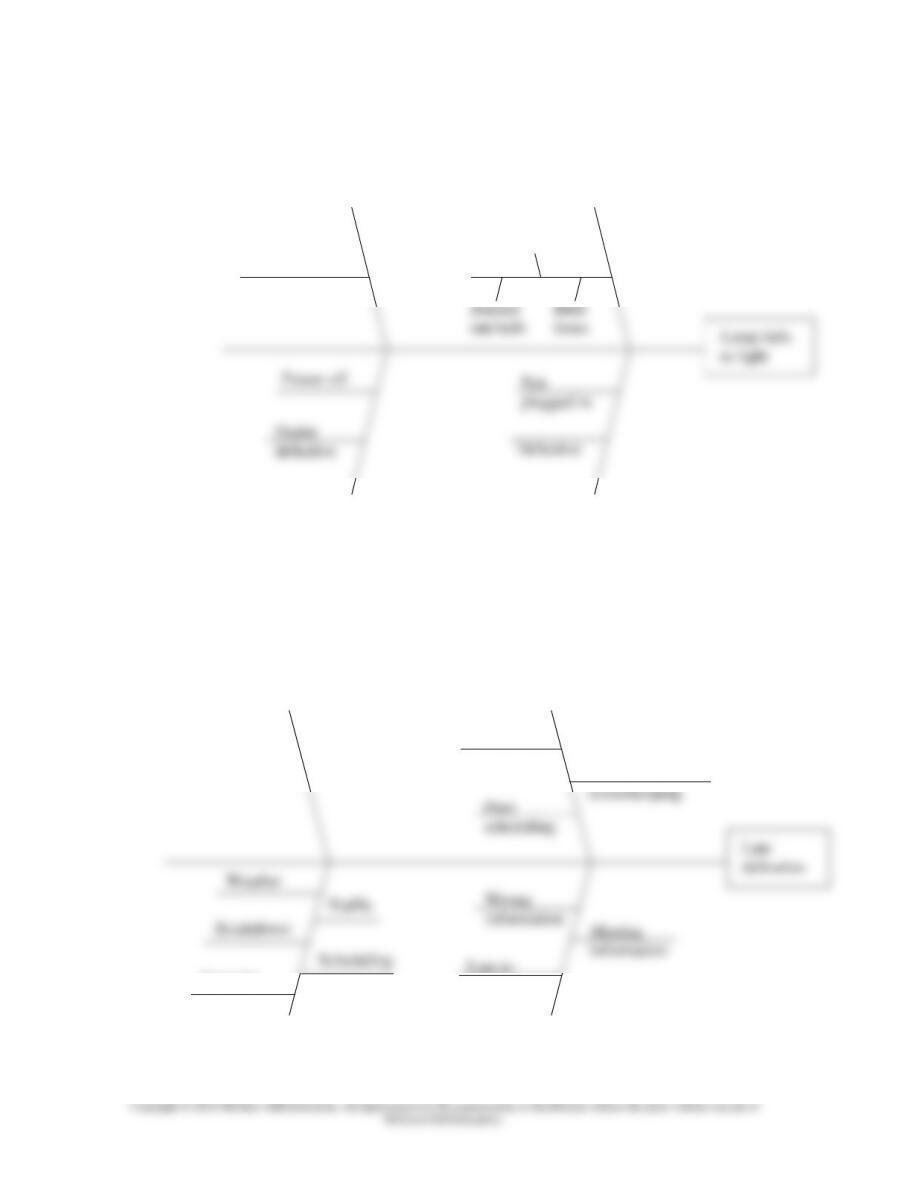
Power off
Person
Lamp
Bulb
missing
Did not turn
completely on
Not
plugged in
Outlet
defective
Defective
Burned
out bulb
Bulb
loose
Lamp fails
to light
Other
Cord
Chapter 09 – Management of Quality
9-15
7.
Poka-Yoke
Quality at
the Source
Organization
Culture
Working
Conditions
Qualifications
Morale
Expertise
Motivation
Selection
Training
Personnel
Defective
Machine
Parts
Consistency
Quality
Operation
Controls
Vibration
Wear
Set-up
Maintenance
Specifications
Adjustment
Machine
Tolerances
Timing
Sequences
Consistency
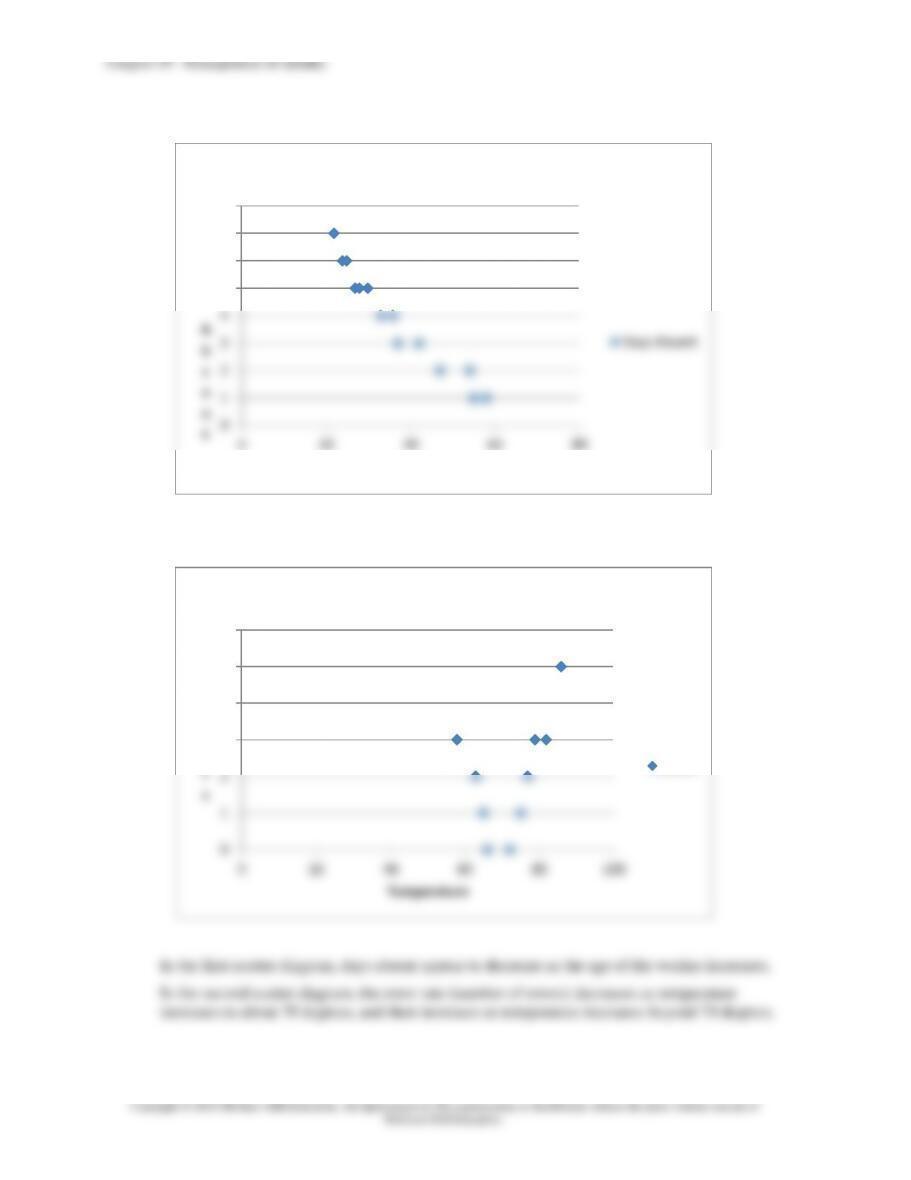
8. a.
b.
0
1
2
3
4
5
6
7
8
020 40 60 80
D
a
y
s
A
b
s
e
n
t
Age
Scatter Diagram
Days Absent
0
1
2
3
4
5
6
020 40 60 80 100
E
r
r
o
r
s
Temperature
Scatter Diagram
Errors
Chapter 09 – Management of Quality
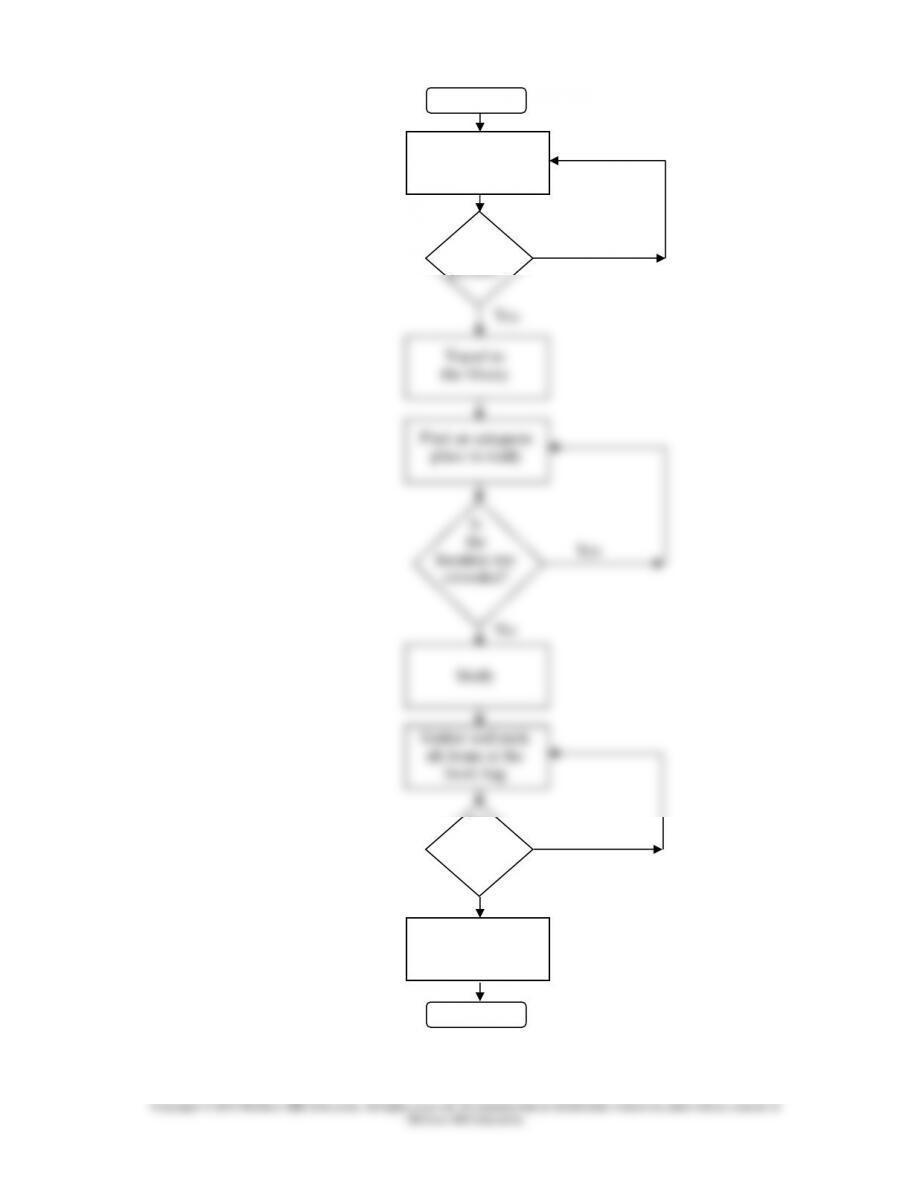
9.
Start
Is
the
location too
crowded?
Study
Gather and pack
all items in the
book bag
Are
all items
packed?
Leave the library
and travel home
Stop
Find an adequate
place to study
Travel to
the library
Are
all items
packed?
Gather and pack
the materials in
the book bag
No
Yes
No
Yes
No
Yes
Chapter 09 – Management of Quality
9-18
Copyright © 2015 McGraw-Hill Education. All rights reserved. No reproduction or distribution without the prior written consent of
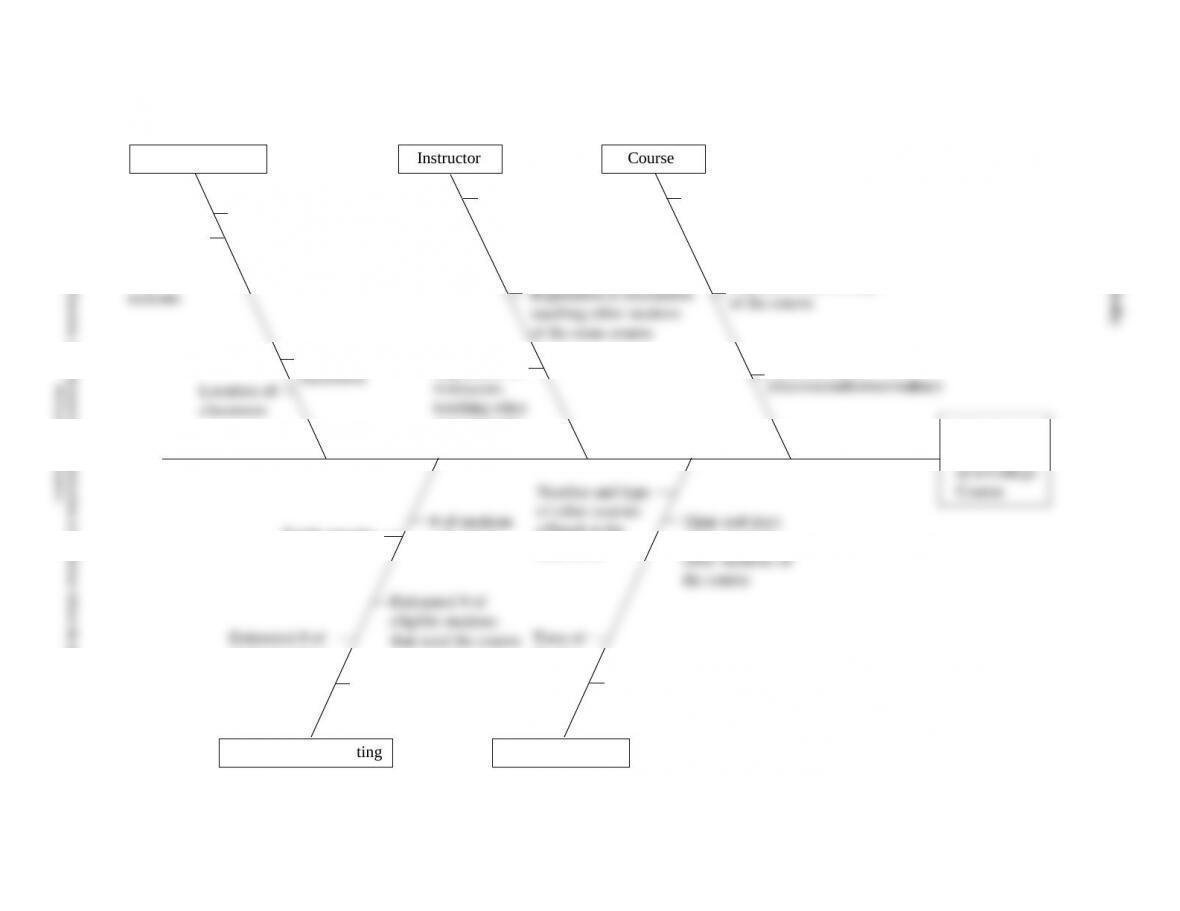
10.
Classroom
Number of
seats available
in other
Number of seats
available in the
closed section
Closed
Section
Course
Subject matter
Reputation (difficulty)
Instructor
Reputation of
the instructor
of other courses
offered at the
same time
Time of
the day
Days of the week
Time and days
of the week for
other sections of
the course
Time of Offering
courses at the
same time
Total capacity
Estimated # of
students taking
it as an elective
Estimated # of
eligible students
that need the course
as a requirement
# of sections
scheduled
Enrollment Forecasting
Estimated # of
students taking it as
a required course
Cause-and-Effect Diagram
Chapter 09 – Management of Quality
Copyright © 2015 McGraw-Hill Education. All rights reserved. No reproduction or distribution without the prior written consent of
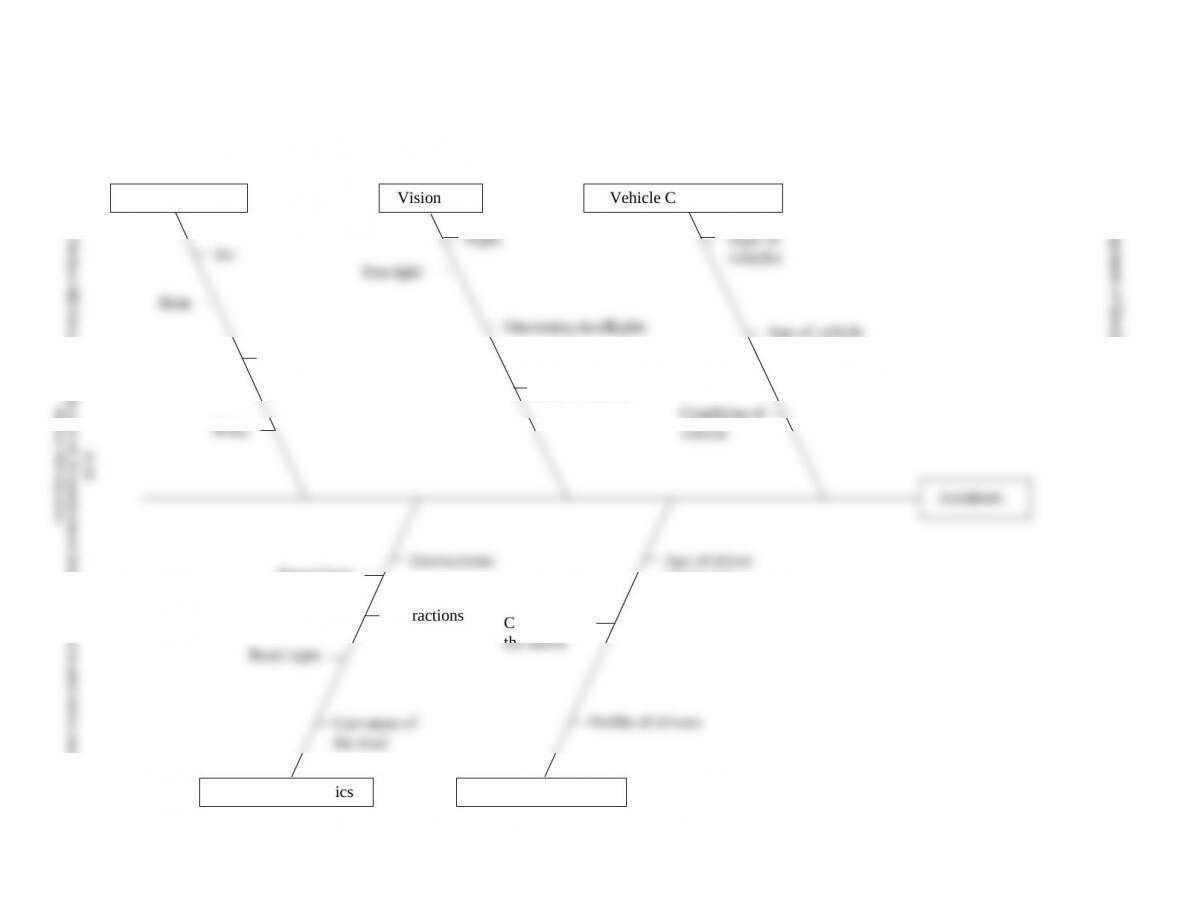
11.
Vehicle Characteristics
Type of
vehicles
Age of vehicle
Condition of
Weather
Rain
Ice
Slippery roads
Accidents
Vision
Night
Hills or curves
Condition of
Age of driver
involved in
accidents
Sun light
Speed limit
Distractions
Intersections
Cause-and-Effect Diagram
Oncoming headlights