Chapter 08 – Location Planning and Analysis
FACILITY LOCATION EXAMPLE
Due to a significant sustained increase in demand, the ITM fastener manufacturing company has
decided to build a new plant. After an initial study, it has narrowed its choices to four locations:
1. Albany, New York
2. Indianapolis, Indiana
3. Akron, Ohio
4. Mason, Georgia
ITM also identified the following as being important factors in terms of the facility location
decision:
1. Transportation costs
5. Production costs
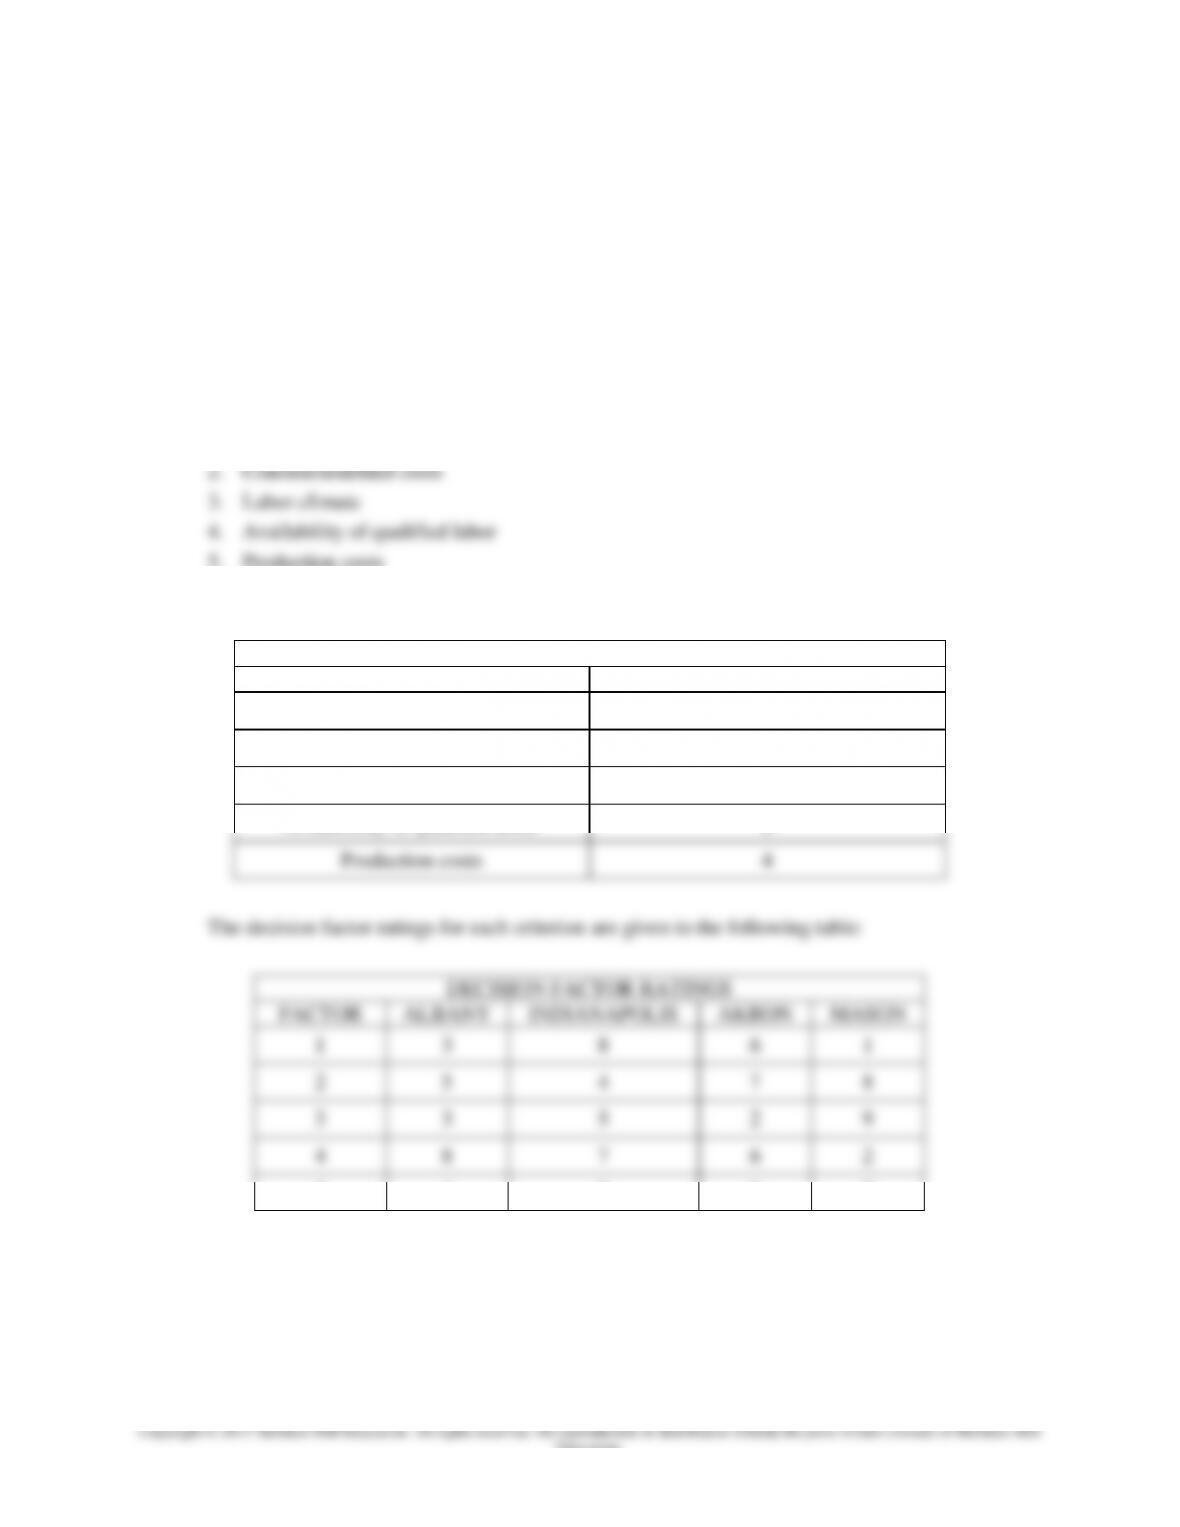
On a five-point scale, the company has determined the following weights for these factors:
FACTOR WEIGHTS
FACTOR
WEIGHTS
Transportation costs
5
Construction/land costs
3
Labor climate
1
Availability of qualified labor
2
Production costs
4
6
1

Chapter 08 – Location Planning and Analysis
8-32
Education.
JOB SELECTION EXAMPLE
1. Pharmaceutical Sales—Chicago
2. Marketing Research—St. Louis
3. Advertising/Promotions—San Diego
The salaries of the jobs are as follows:
1. Chicago: $37,000
2. St. Louis: $30,000
3. San Diego: $40,000
The following table provides additional information about each job and company:
COMPANY/JOB CHARACTERISTICS
CHARACTERISTIC
CHICAGO
ST. LOUIS
SAN DIEGO
Culture
Formal
Mix
Informal
Job Security
High
Medium
Low
Future Earnings &
Advancement Potential
Limited
Medium
High
Job Expectations
Reasonable
Medium
Very High
a. Determine the weights for all the listed factors (5 being very important and 1 being very
unimportant) and rate the importance of the factors from one to five.
FACTOR #
FACTORS
WEIGHT
1
Type of Job
2
Salary
3
Culture
4
Job Security
5
Future Earnings & Advancement Potential
6
Job Expectations
7
Location Proximity to Family & Friends

Chapter 08 – Location Planning and Analysis
8-33
Education.
b. Complete the following table indicating your decision factor ratings for each criteria.
FACTOR #
CHICAGO
ST. LOUIS
SAN DIEGO
1
2
3
4
5
6
7
c. Determine the factor score for each location.
d. Based on your answer to part c, indicate the best choice and the second best choice.
Solutions to Example Problems
SOLUTION TO PRODUCT SELECTION PROBLEM
Smicro = 4(4) + 5(8) + 3(6) + 5(3) + 2(9) + 1(1)
Smicro = 16 + 40 + 18 + 15 + 18 + 1 = 108
SOLUTION TO FACILITY LOCATION PROBLEM
SAlbany = 5(3) + 3(5) + 1(3) + 2(8) + 4(4) = 65
D. Emergency Facility Location
The factors considered in deciding where to locate a facility differ drastically among different
types of facilities depending on the type of facility considered and the location of the existing
facilities. For example, in deciding where to locate a distribution warehouse, a firm would
consider a number of factors including the location of the existing warehouses, the location of
Chapter 08 – Location Planning and Analysis
8-34
Education.
the manufacturing facilities that would supply the warehouse, and the location of existing stores
that the warehouse would supply. On the other hand, if we were deciding the location of a new
emergency response time. The response time is defined as the amount of time between receiving
the emergency call and an emergency vehicle arriving at the site of emergency.
The emergency facility objectives (methods) can be categorized as follows:
1. Minimization of maximum response time
2. Minimization of average response time
3. Minimization of weighted average response time
In minimizing the maximum response time, we are concerned about the worst-case scenario
response. In minimizing the average response time, the chosen location will be the site with the
lowest average response time, even though the worst-case response may not be desirable. These
first two objectives may be acceptable if the need or the demand for emergency vehicles do not
network with nodes and arcs where each node represents a community or location while each arc
represents the estimated response time between two locations.
A two-stage procedure is used in determining the location of an emergency facility using any of
the three methods introduced above. The first stage is the same for all three methods and consists
of determining the shortest route (response time) between each of the nodes in the emergency
network. There are formal algorithms for determining the shortest route, however we will assume
that the networks are simple enough to obtain all of the shortest routes using simple intuition. The
second stage of the procedure depends on which method is utilized. The following section
summarizes the second stage for each method.
Minimization of maximum response time:

Chapter 08 – Location Planning and Analysis
8-35
Education.
Minimization of weighted average response time:
First, we determine the weighted-average response time using the following formula:
1,2,...l i all for WAT
locations proposed of numberl
servedlocations of numberk
i location from time response average weightedWAT
j location to i location from time response shortestt
j) location to trips of (#j location of weightw
i
i
ij
j
k
1j j
k
1j ijj
w
tw
:Let
The best way to develop a further intuitive understanding for emergency vehicle location is
through solving problems. Therefore, in the next section we provide three simple example
problems.
Problem 1
The local hospital in northeast Ohio has just received approval from its executive board to build a
new emergency facility. The facility will serve six communities in northeast Ohio. The response
times in minutes are given in the network figure below.
Network Diagram 1
a. Based on the emergency response network given above, determine the location of the
emergency facility that minimizes the maximum response time.
b. Based on the emergency response network given above, determine the location of the
emergency facility that minimizes the average response time.
2
4
6
3
1
5
8
7
11
3
6
10
9
7
4
5

Chapter 08 – Location Planning and Analysis
8-36
Education.
c. Assume that community 4 is a retirement community and community 6 is a high crime area.
Therefore, these communities experience higher demand for emergency vehicles than the
other communities do. Based on historical data from last year, the average number of weekly
emergency trips to the six communities is given in the following table.
Average Number of Weekly Emergency Trips
Community 1
Community 2
Community 3
Community 4
Community 5
Community 6
8 trips
5 trips
10 trips
20 trips
12 trips
24 trips
Use the weighted average response time criteria and the # of trips as the respective weights
and determine the best location for the emergency center.
Problem 2
The city of Hampton is in the process of making a decision on where to locate a fire department
that will serve the entire city. The city is divided into seven communities. The network of cities
with fire truck response times is given in the following figure.
Network Diagram 2
a. Determine the best location for the fire station based on the objective of minimizing the
maximum response time.
b. Determine the best location for the fire station based on the objective of minimizing the
average response time.
6
6
2
5
4
10
7
6
7
5
3
9
3
8
7
1
4
2
Chapter 08 – Location Planning and Analysis
8-37
Education.
Problem 3
The mayor of a small town is planning to select one of three sites as the location for its
ambulance facility. The town consultant has determined the following response times from each
of the proposed locations to the four main areas of the town that must be served (North, South,
East, and West).
Area Served
Proposed Site
North
South
East
West
A
4
8
10
6
B
9
5
7
3
C
11
6
2
7
a. If the mayor selects the site for the ambulance facility based on minimizing the maximum
response time, which site should be selected?
b. If the mayor selects the site for the ambulance facility based on minimizing the average
response time, which site should be selected?
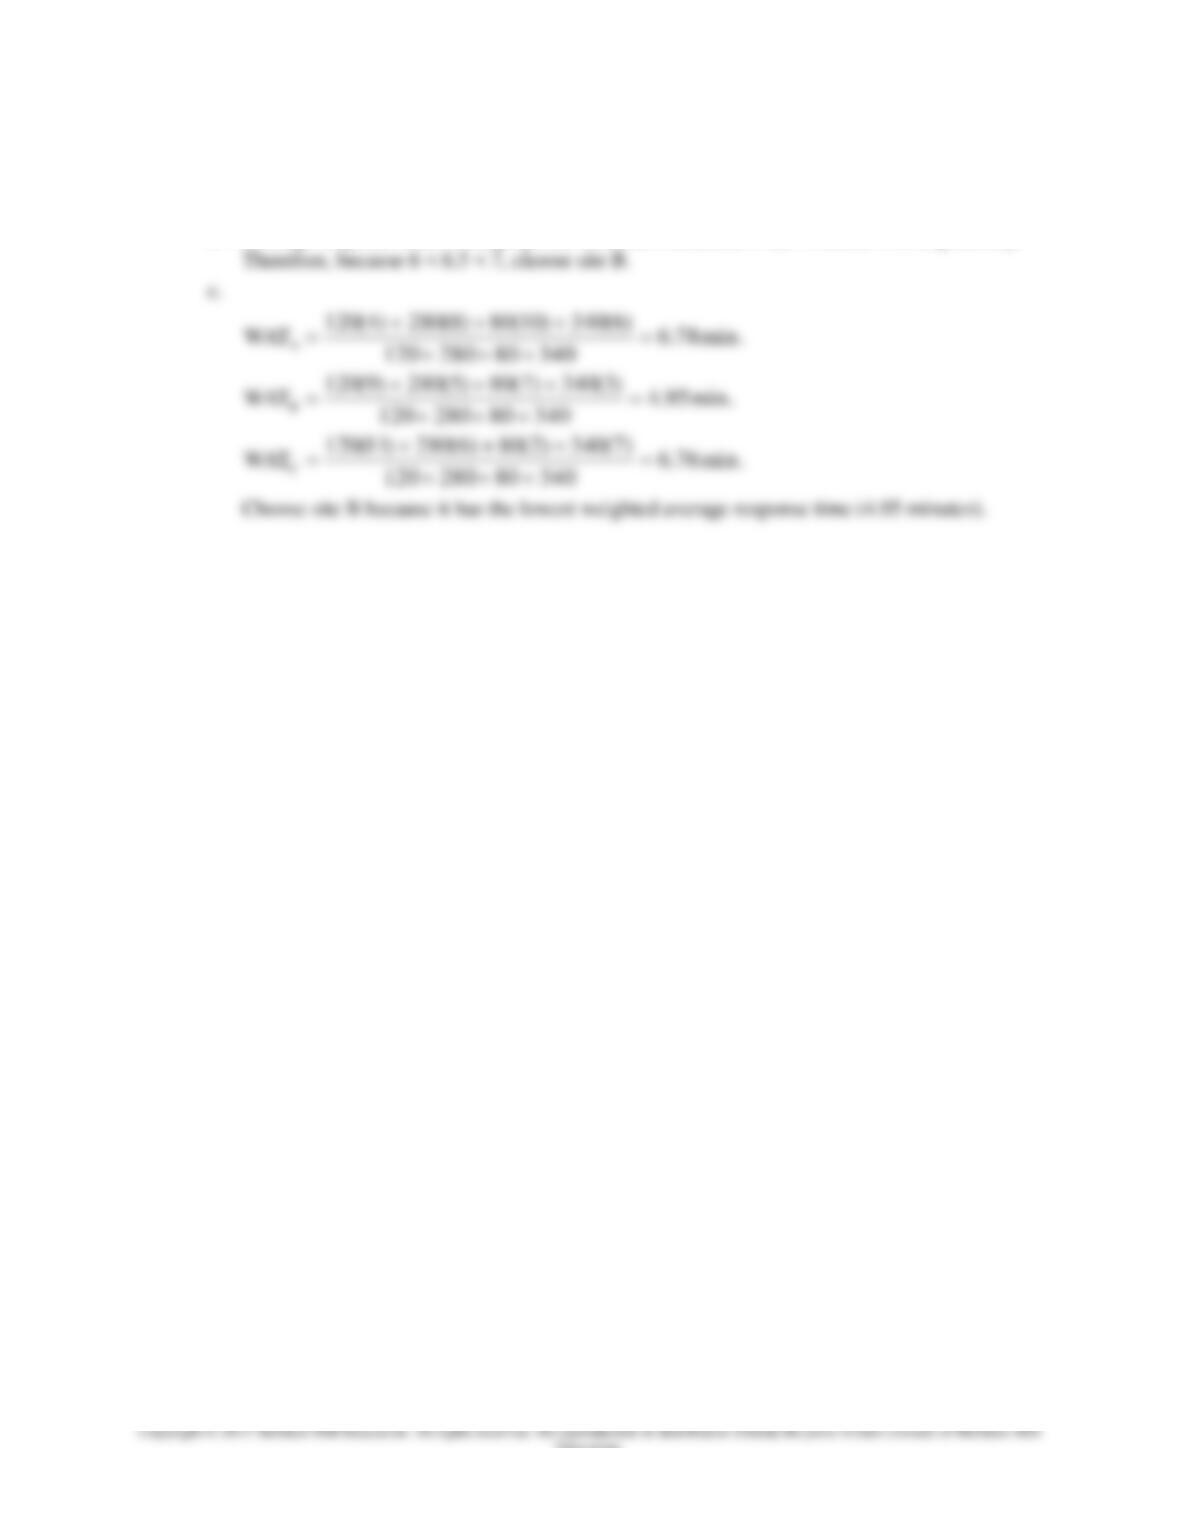
c. The number of ambulance trips to each of the four areas in the past year has been: North =
120; South = 280; East = 80; and West = 340. Use the weighted average response time and
determine the best site location for the mayor.
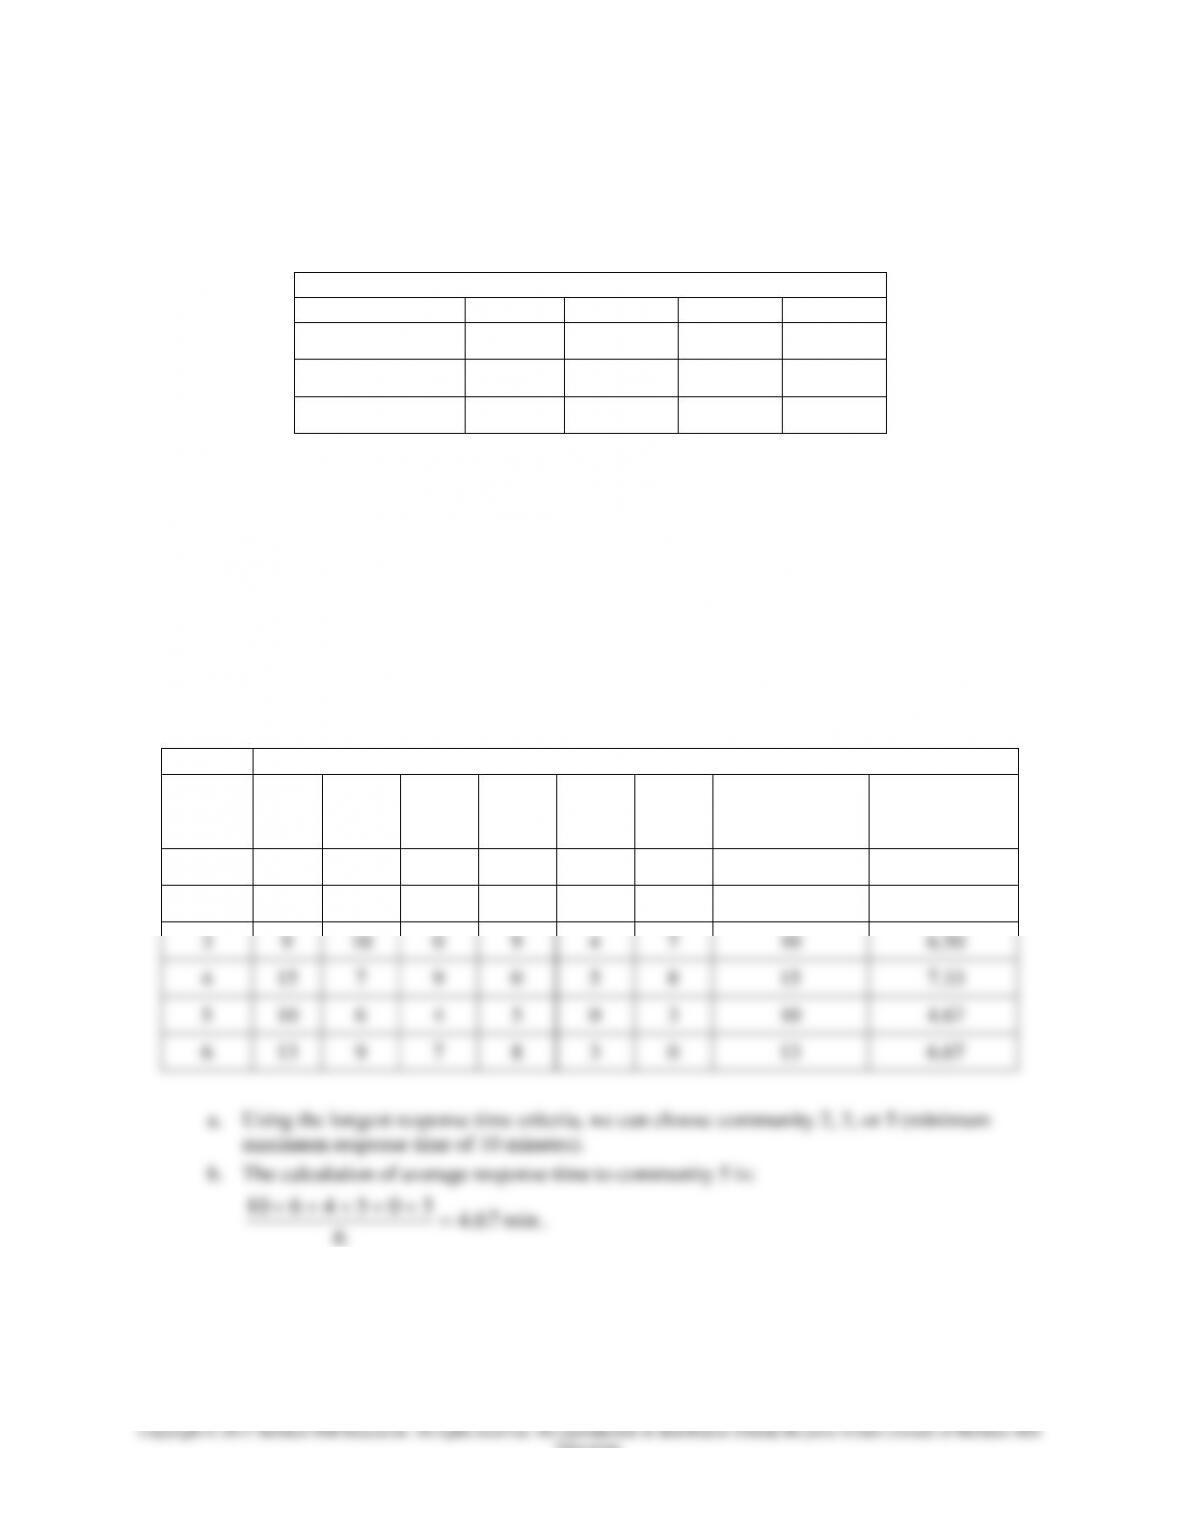
Solution to Problem 1
Shortest Response Time Matrix
To
From
1
2
3
4
5
6
Longest
Response Time
Average
Response
Time
1
0
8
9
15
10
13
15
9.17
2
8
0
10
7
6
9
10
6.67
3
9
10
0
9
4
7
10
6.50
4
15
7
9
0
5
8
15
7.33
5
10
6
4
5
0
3
10
4.67
6
13
9
7
8
3
0
13
6.67
6
Using the average response time method, we select location 5 (4.67 minutes is the smallest
average response time).
Chapter 08 – Location Planning and Analysis
8-38
Education.
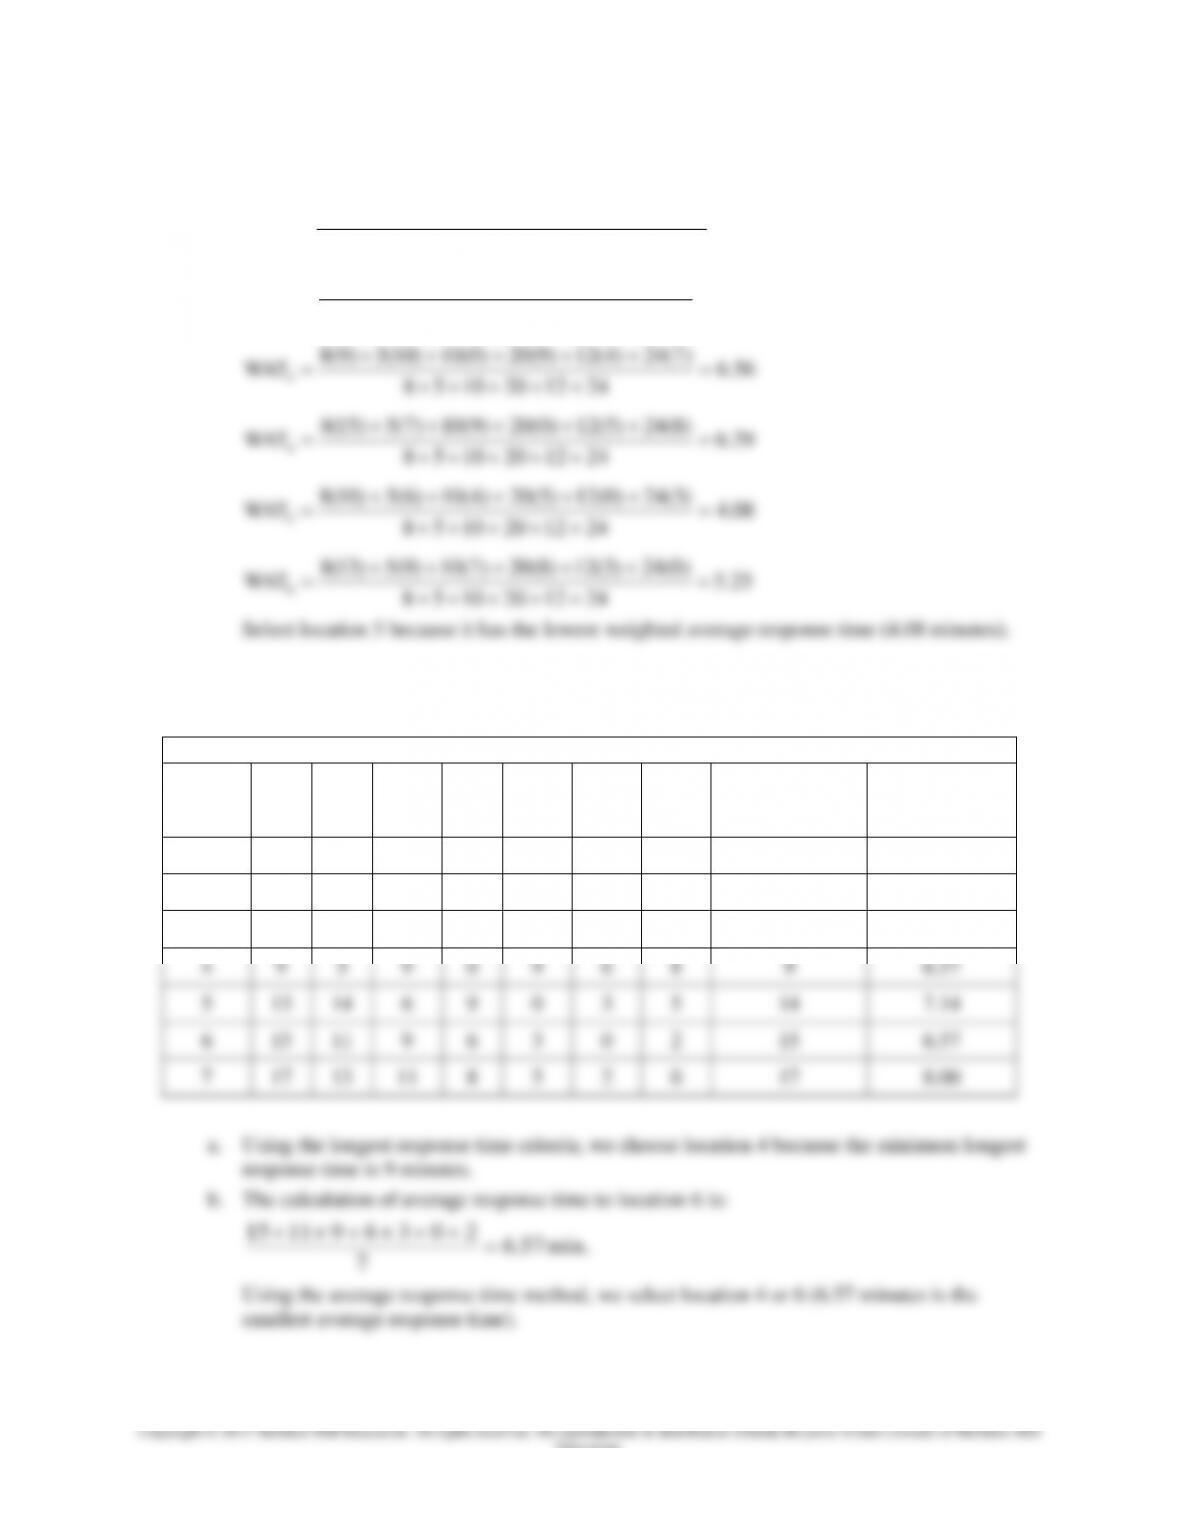
c.
56.6
2412201058
)7(24)4(12)9(20)0(10)10(5)9(8
49.7
2412201058
)9(24)6(12)7(20)10(10)0(5)8(8
91.10
2412201058
)13(24)10(12)15(20)9(10)8(5)0(8
3
2
1
WAT
WAT
WAT
Chapter 08 – Location Planning and Analysis
8-39
Education.
Solution to Problem 3
a. Maximum response times from proposed locations A, B, and C are 10, 9, and 11,
respectively. Choose site B because it has the lowest maximum response time.
b. Average response times from proposed locations A, B, and C are 7, 6, and 6.5, respectively.