Unlock document.
This document is partially blurred.
Unlock all pages and 1 million more documents.
Get Access
Chapter 06 - Process Selection and Facility Layout
6-31
Education.
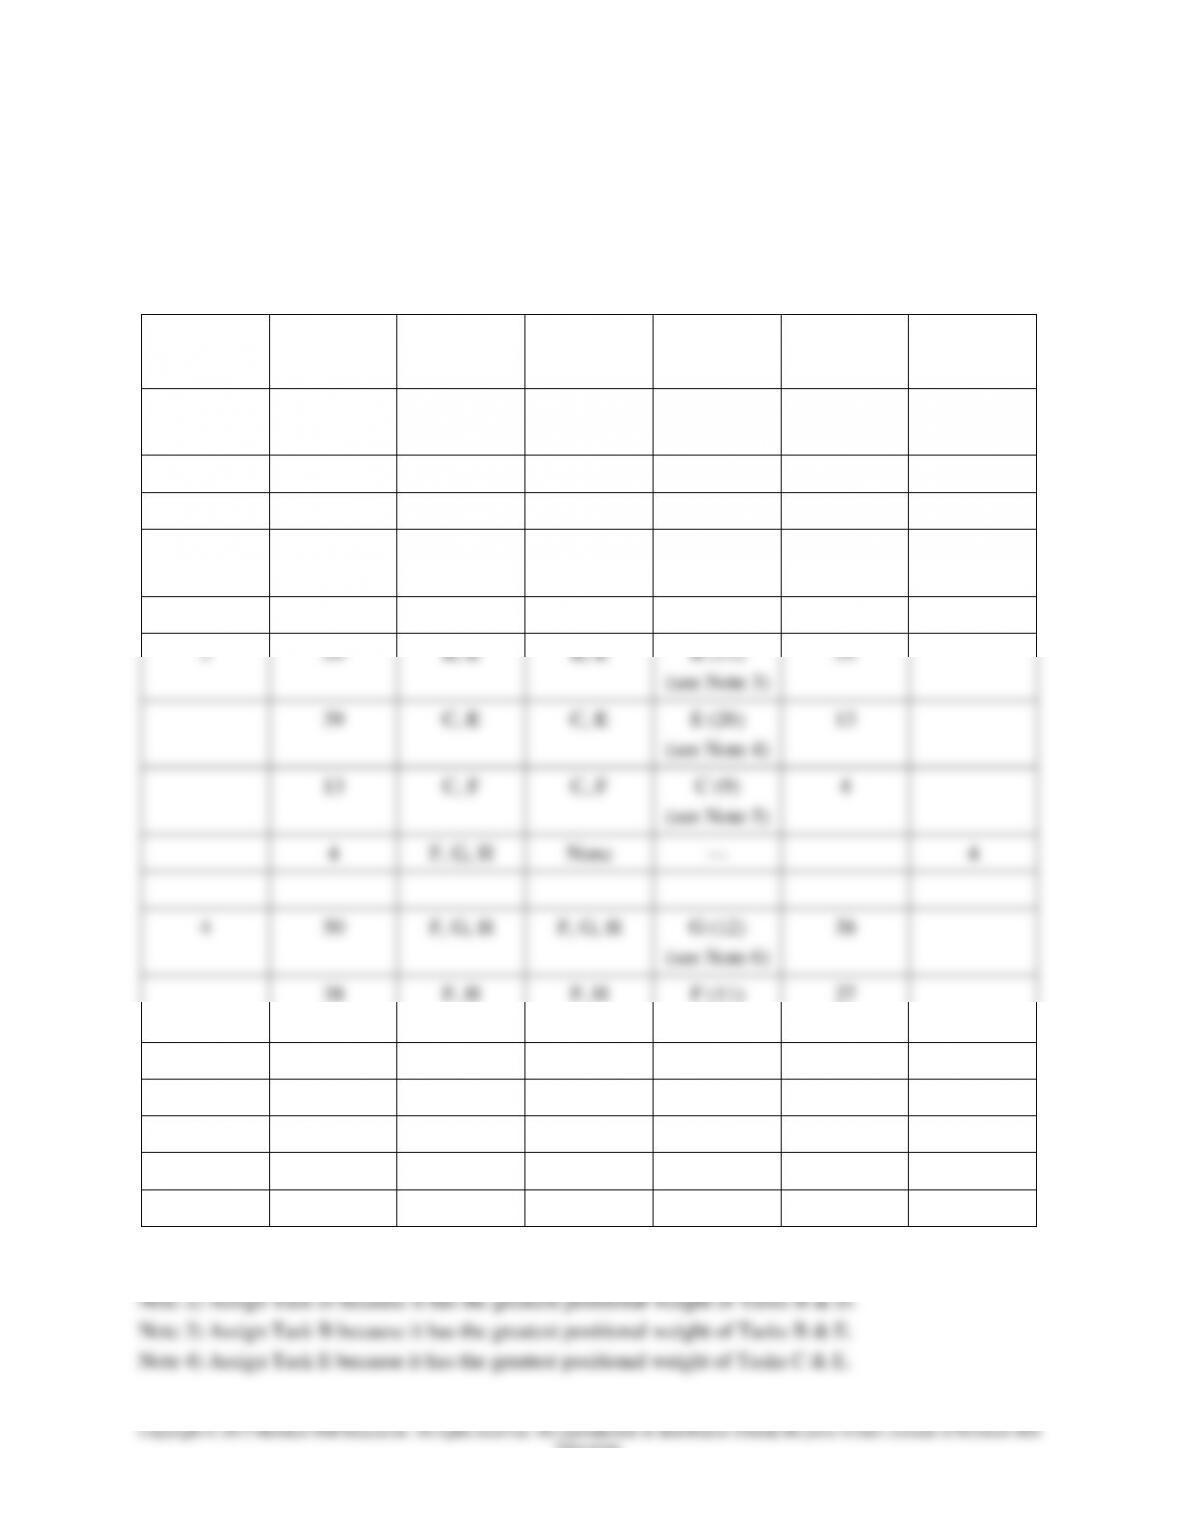
d. Assign tasks in order of greatest positional weight. Break ties based on most following tasks.
Cycle time = 50 seconds per unit.
Greatest Positional Weight Solution (Cycle time = 50 seconds per unit)
Station
Time
Remaining
Eligible
Will Fit
Assign
(task time)
Revised
Time
Remaining
Idle
1
50
A, D
A, D
A (45)
(see Note 1)
5
5
B, D
None
---
5
2
50
B, D
B, D
D (50)
(see Note 2)
0
0
3
50
B, E
B, E
B (11)
(see Note 3)
39
39
C, E
C, E
E (26)
(see Note 4)
13
13
C, F
C, F
C (9)
(see Note 5)
4
4
F, G, H
None
---
4
4
50
F, G, H
F, G, H
G (12)
(see Note 6)
38
38
F, H
F, H
F (11)
(see Note 7)
27
27
H
H
H (10)
17
17
I
I
I (9)
8
8
J
None
---
8
5
50
J
J
J (10)
40
40
Note 1) Task A & Task D are tied—they both have identical positional weights. Break the tie by
assigning Task A because it has more following tasks than Task D does.
6-32
Education.
Note 5) Assign Task C because it has the greatest positional weight of Tasks C & F.
Note 6) Assign Task G because it has the greatest positional weight of Tasks F, G, & H.
Note 7) Assign Task F because it has the greatest positional weight of Tasks F & H.
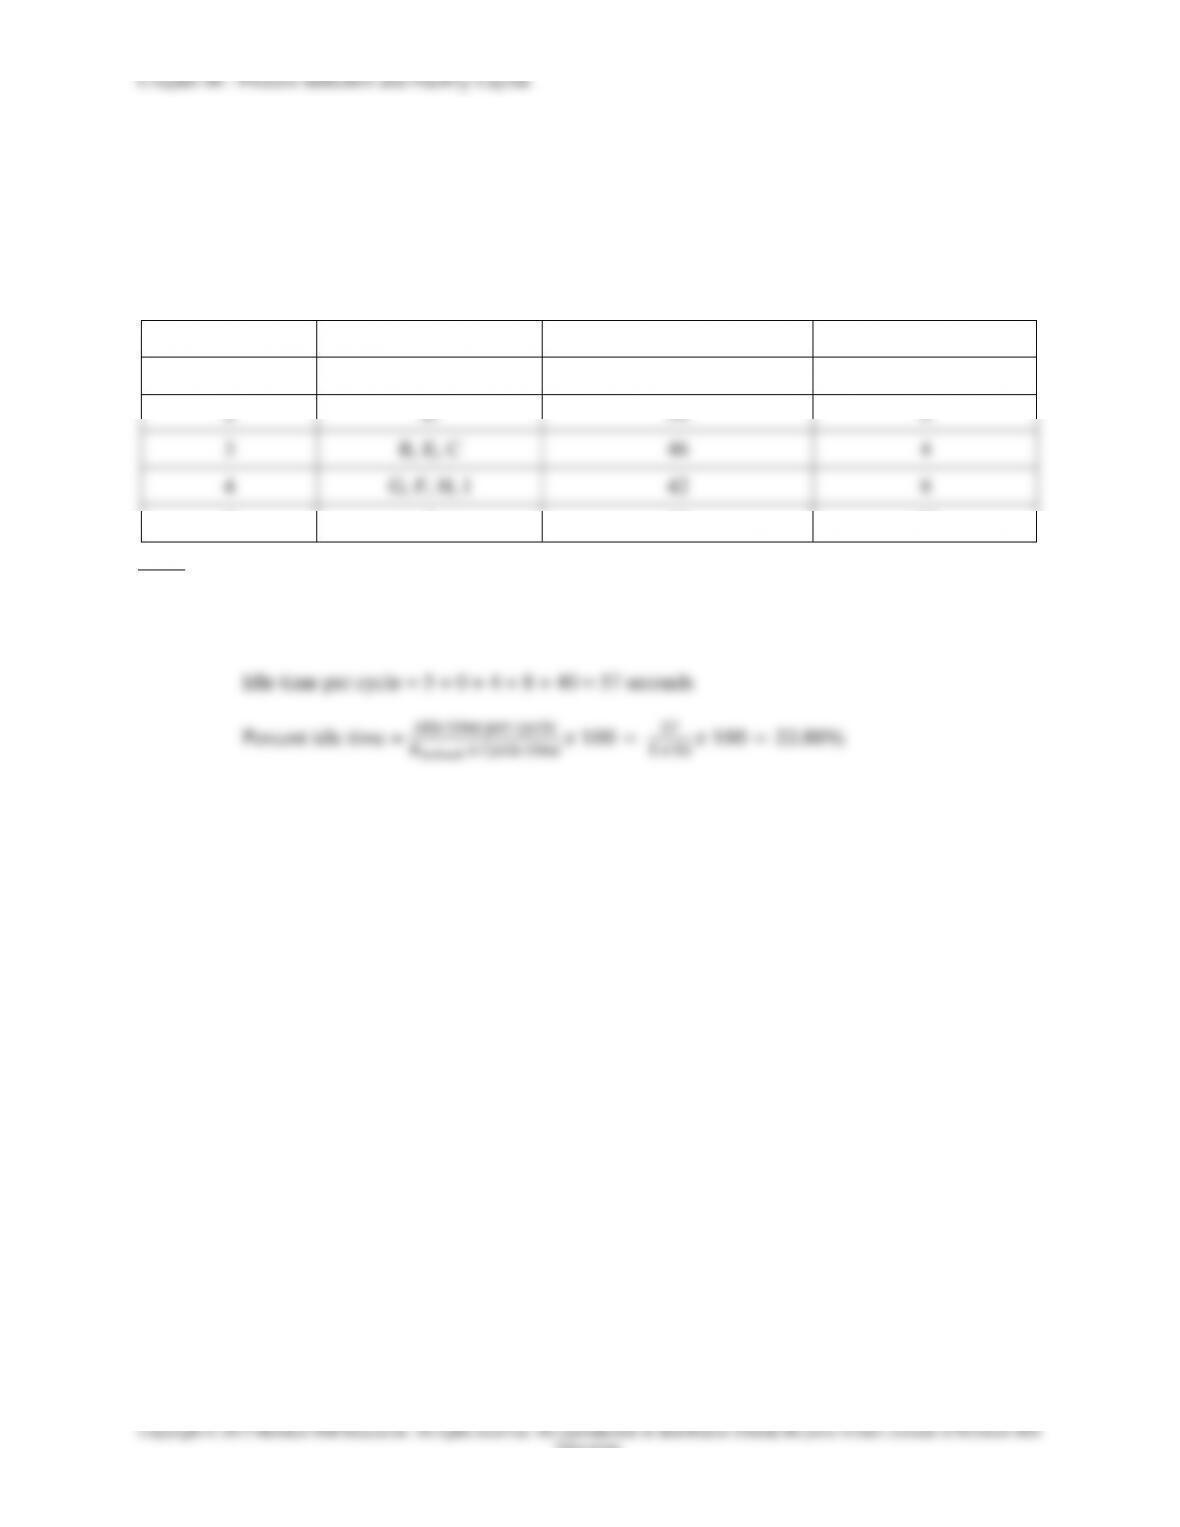
Overview of Workstations: Greatest Positional Weight Solution
Station
Tasks Assigned
Total Time Used at Station
Idle Time at Station
1
A
45
5
2
D
50
0
3
B, E, C
46
4
4
G, F, H, I
42
8
5
J
10
40
Note: Calculated cycle time equals the actual bottleneck station time used. As shown above, Station 2 is
the bottleneck and uses all 50 seconds.
e. Percent Idle Time:
Chapter 06 - Process Selection and Facility Layout
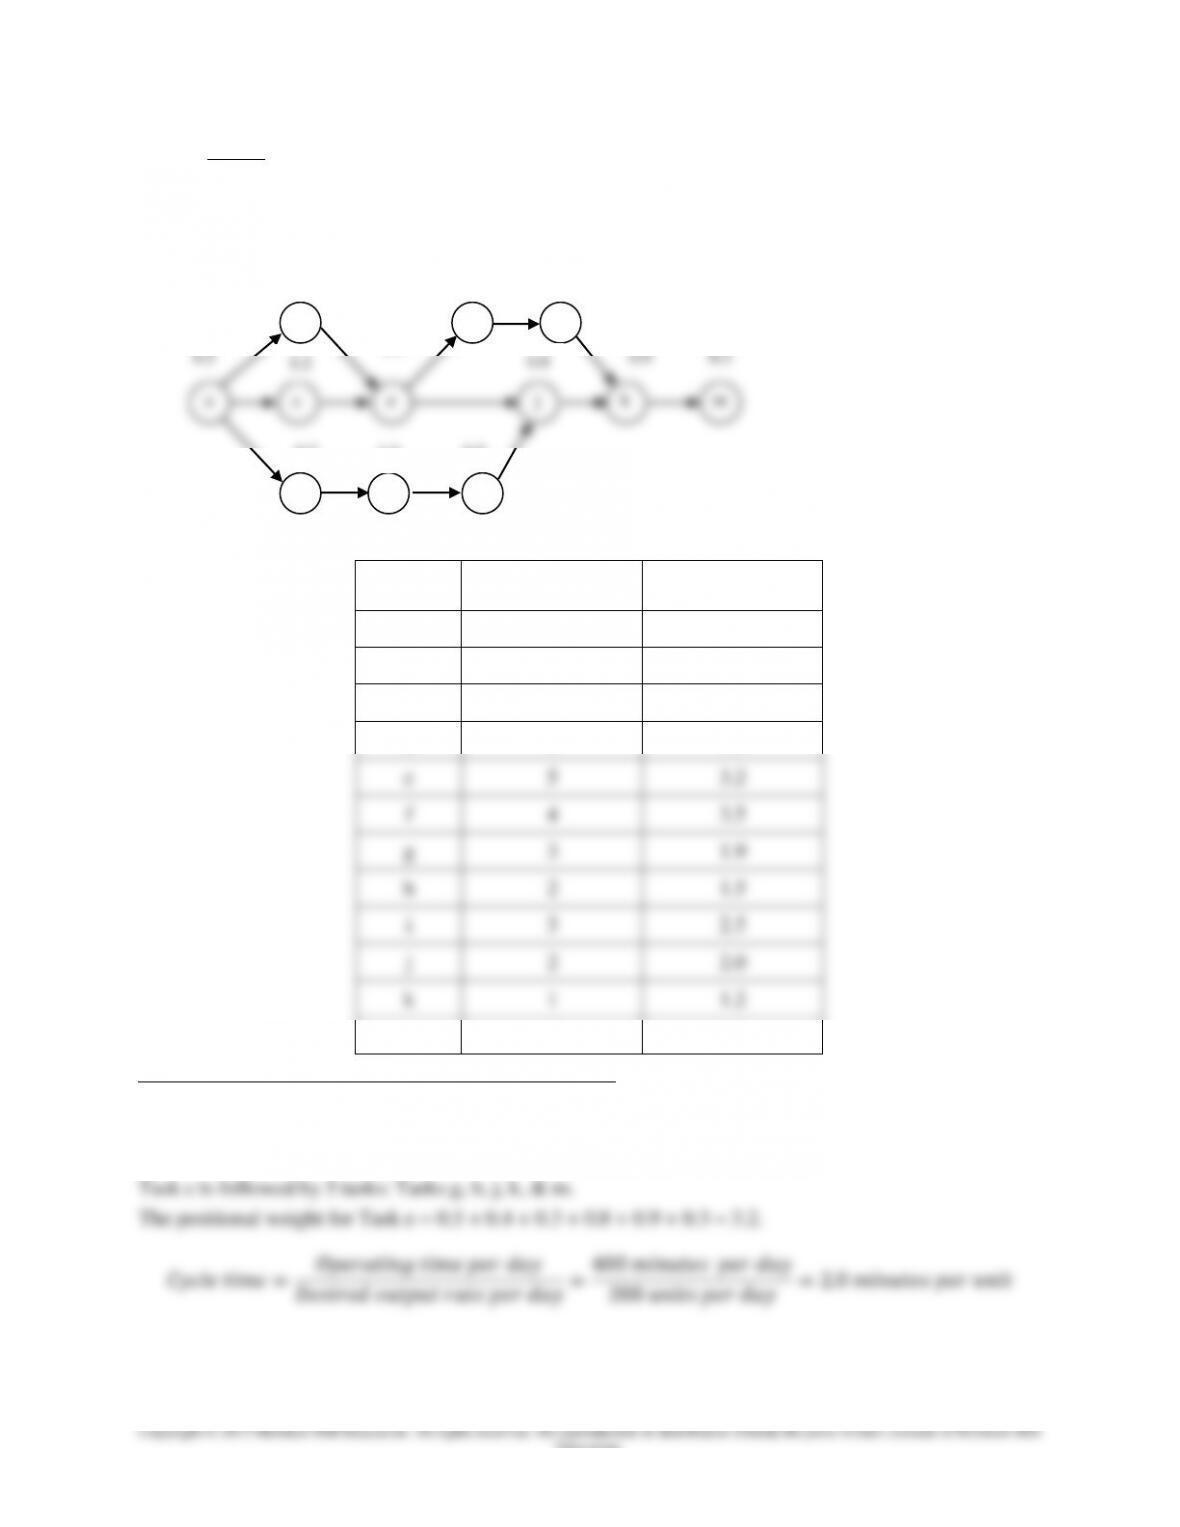
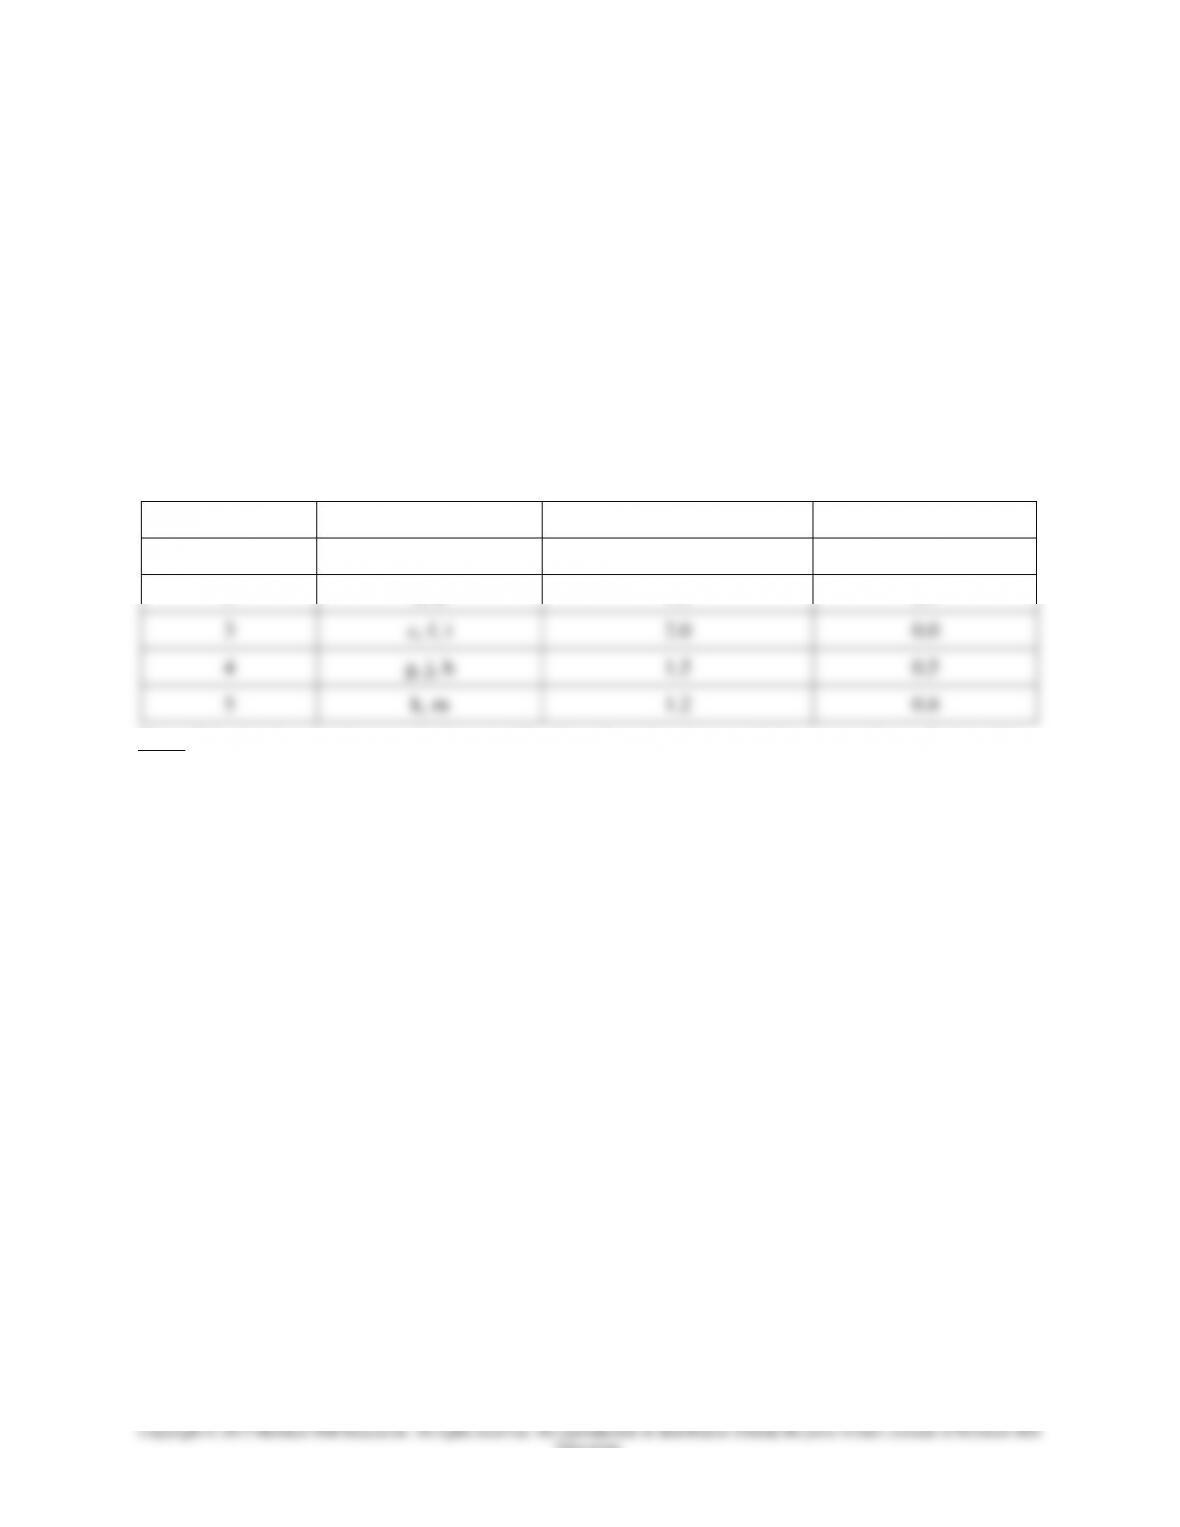
8. Given: Operating time = 400 minutes per day. Desired output rate = 200 units per day.
a. Draw the precedence diagram.
Task
Number of
Following Tasks
Positional Weight
a
11
8.5
b
6
4.6
c
6
4.4
d
5
4.2
e
5
3.2
f
4
3.5
g
3
1.9
h
2
1.5
i
3
2.5
j
2
2.0
k
1
1.2
m
0
0.3
Example calculations for determining positional weight:
Task a is followed by 11 tasks: Tasks b, c, d, e, f, g, h, i, j, k, & m.
The positional weight for Task a = 0.5 + 1.4 + 1.2 + 0.7 + 0.5 + 1.0 + 0.4 + 0.3 + 0.5 + 0.8 + 0.9 + 0.3 =
8.5.
g
h
d
f
i
b
0.5
1.4
0.7
0.5
1.0
0.4
0.5
0.3
0.9
0.3
Chapter 06 - Process Selection and Facility Layout
6-34
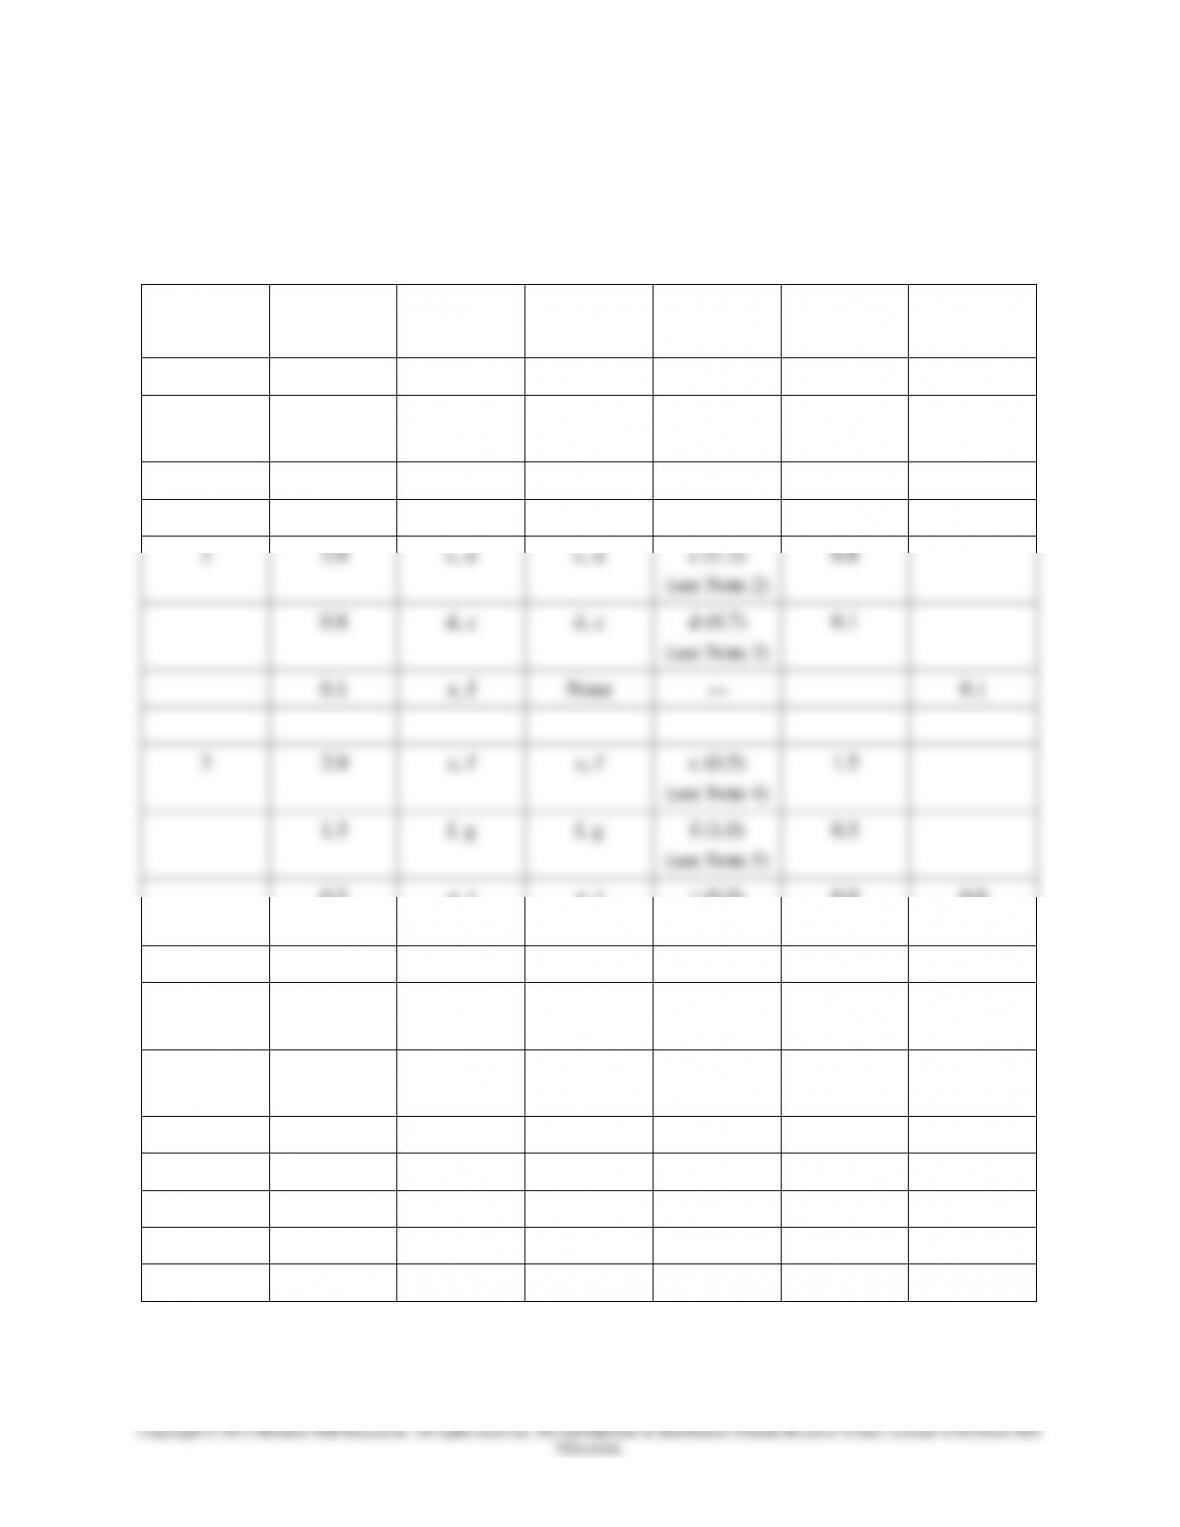
b. Assign tasks according to the most following tasks rule. Break ties with the greatest
positional weight rule. Cycle time = 2.0 minutes per unit.
Most Following Tasks Solution (Cycle time = 2.0 minutes per unit)
Station
Time
Remaining
Eligible
Will Fit
Assign
(task time)
Revised
Time
Remaining
Idle
1
2.0
a
a
a (0.5)
1.5
1.5
b, c, d
b, c, d
b (1.4)
(see Note 1)
0.1
0.1
c, d
None
---
0.1
2
2.0
c, d
c, d
c (1.2)
(see Note 2)
0.8
0.8
d, e
d, e
d (0.7)
(see Note 3)
0.1
0.1
e, f
None
---
0.1
3
2.0
e, f
e, f
e (0.5)
(see Note 4)
1.5
1.5
f, g
f, g
f (1.0)
(see Note 5)
0.5
0.5
g, i
g, i
i (0.5)
(see Note 6)
0.0
0.0
4
2.0
g, j
g, j
g (0.4)
(see Note 7)
1.6
1.6
h, j
h, j
j (0.8)
(see Note 8)
0.8
0.8
h
h
h (0.3)
0.5
0.5
k
None
---
0.5
5
2.0
k
k
k (0.9)
1.1
1.1
m
m
m (0.3)
0.8
0.8
Note 1) Tasks b & c are tied with 6 following tasks each (Task d has only 5 following tasks). Break the tie
by assigning Task b because it has the greatest positional weight of Tasks b & c.
Note 2) Assign Task c because it has more following tasks than Task d does.
Chapter 06 - Process Selection and Facility Layout
6-35
Education.
Note 3) Tasks d & e are tied with 5 following tasks each. Break the tie by assigning Task d because it has
the greatest positional weight of Tasks d & e.
Note 4) Assign Task e because it has more following tasks than Task f does.
Note 5) Assign Task f because it has more following tasks than Task g does.
Note 6) Tasks g & i are tied with 3 following tasks each. Break the tie by assigning Task i because it has
the greatest positional weight of Tasks g & i.
Note 7) Assign Task g because it has more following tasks than Task j does.
Note 8) Tasks h & j are tied with 2 following tasks each. Break the tie by assigning Task j because it has
the greatest positional weight of Tasks h & j.
Overview of Workstations: Most Following Tasks Solution
Station
Tasks Assigned
Total Time Used at Station
Idle Time at Station
1
a, b
1.9
0.1
2
c, d
1.9
0.1
3
e, f, i
2.0
0.0
4
g, j, h
1.5
0.5
5
k, m
1.2
0.8
Note: Calculated cycle time equals the actual bottleneck station time used. As shown above, Station 3 is
the bottleneck and uses all 2.0 minutes.
6-36
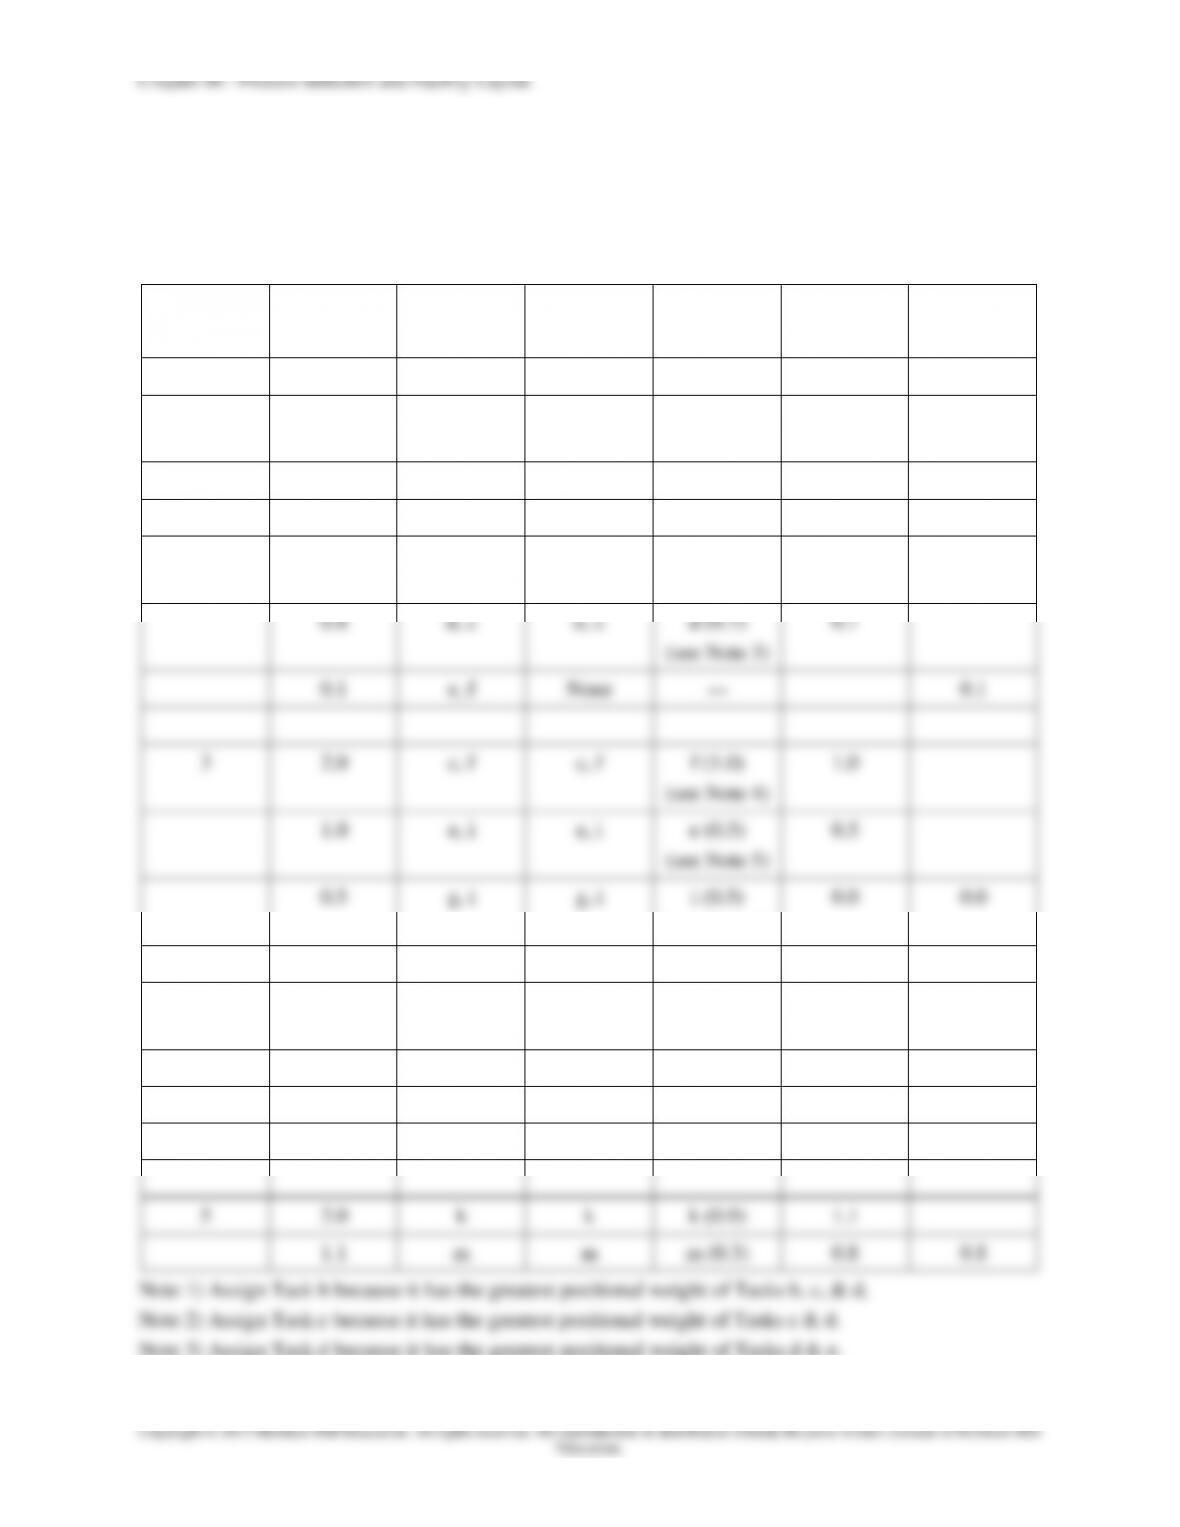
c. Assign tasks according to the greatest positional weight rule. Break ties with the most
following tasks rule. Cycle time = 2.0 minutes per unit.
Greatest Positional Weight Solution (Cycle time = 2.0 minutes per unit)
Station
Time
Remaining
Eligible
Will Fit
Assign
(task time)
Revised
Time
Remaining
Idle
1
2.0
a
a
a (0.5)
1.5
1.5
b, c, d
b, c, d
b (1.4)
(see Note 1)
0.1
0.1
c, d
None
---
0.1
2
2.0
c, d
c, d
c (1.2)
(see Note 2)
0.8
0.8
d, e
d, e
d (0.7)
(see Note 3)
0.1
0.1
e, f
None
---
0.1
3
2.0
e, f
e, f
f (1.0)
(see Note 4)
1.0
1.0
e, i
e, i
e (0.5)
(see Note 5)
0.5
0.5
g, i
g, i
i (0.5)
(see Note 6)
0.0
0.0
4
2.0
g, j
g, j
j (0.8)
(see Note 7)
1.2
1.2
g
g
g (0.4)
0.8
0.8
h
h
h (0.3)
0.5
0.5
k
None
---
0.5
5
2.0
k
k
k (0.9)
1.1
1.1
m
m
m (0.3)
0.8
0.8
Note 3) Assign Task d because it has the greatest positional weight of Tasks d & e.
Chapter 06 - Process Selection and Facility Layout
6-37
Note 4) Assign Task f because it has the greatest positional weight of Tasks e & f.
Note 5) Assign Task e because it has the greatest positional weight of Tasks e & i.
Note 6) Assign Task i because it has the greatest positional weight of Tasks g & i.
Note 7) Assign Task j because it has the greatest positional weight of Tasks g & j.
Overview of Workstations: Greatest Positional Weight Solution
Station
Tasks Assigned
Total Time Used at Station
Idle Time at Station
1
a, b
1.9
0.1
2
c, d
1.9
0.1
3
f, e, i
2.0
0.0
4
j, g, h
1.5
0.5
5
k, m
1.2
0.8
Note: Calculated cycle time equals the actual bottleneck station time used. As shown above, Station 3 is
the bottleneck and uses all 2.0 minutes.
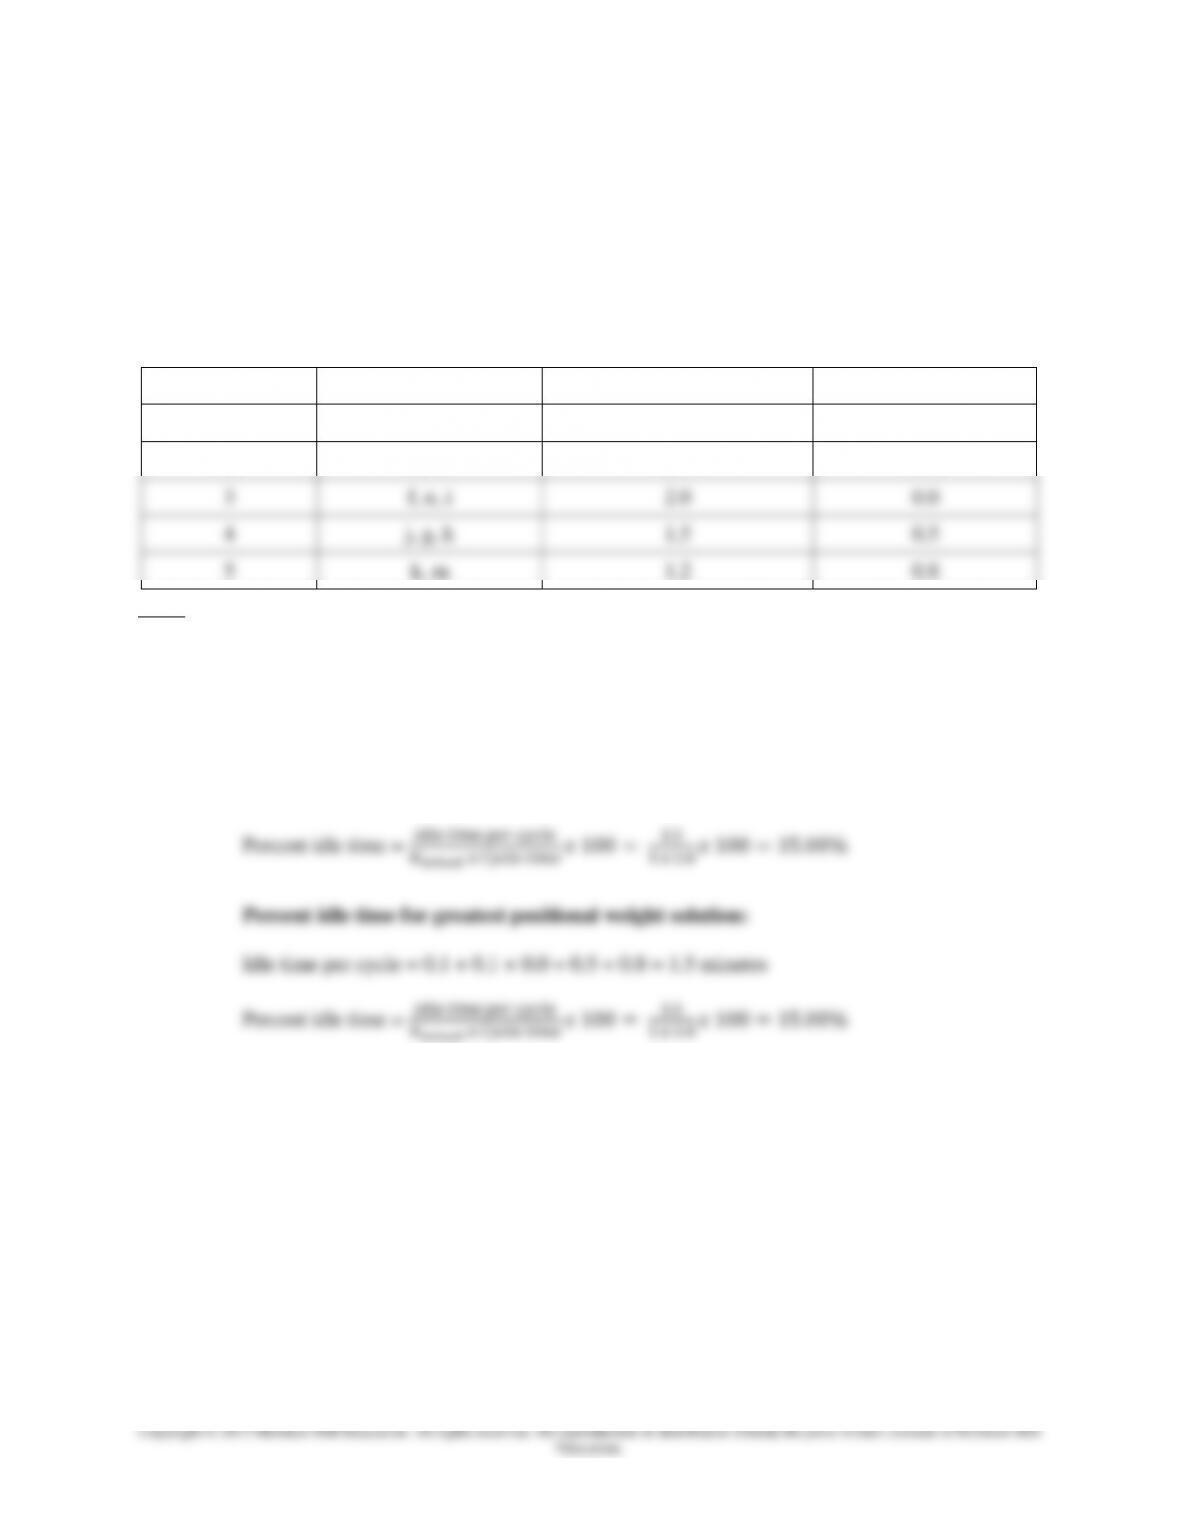
d. Balance Delay (Percent Idle Time):
Percent idle time for most following tasks solution:
Idle time per cycle = 0.1 + 0.1 + 0.0 + 0.5 + 0.8 = 1.5 minutes
Conclusion: Both rules yield identical balance delays. Neither rule yields a better set of
assignments.
Chapter 06 - Process Selection and Facility Layout
6-38
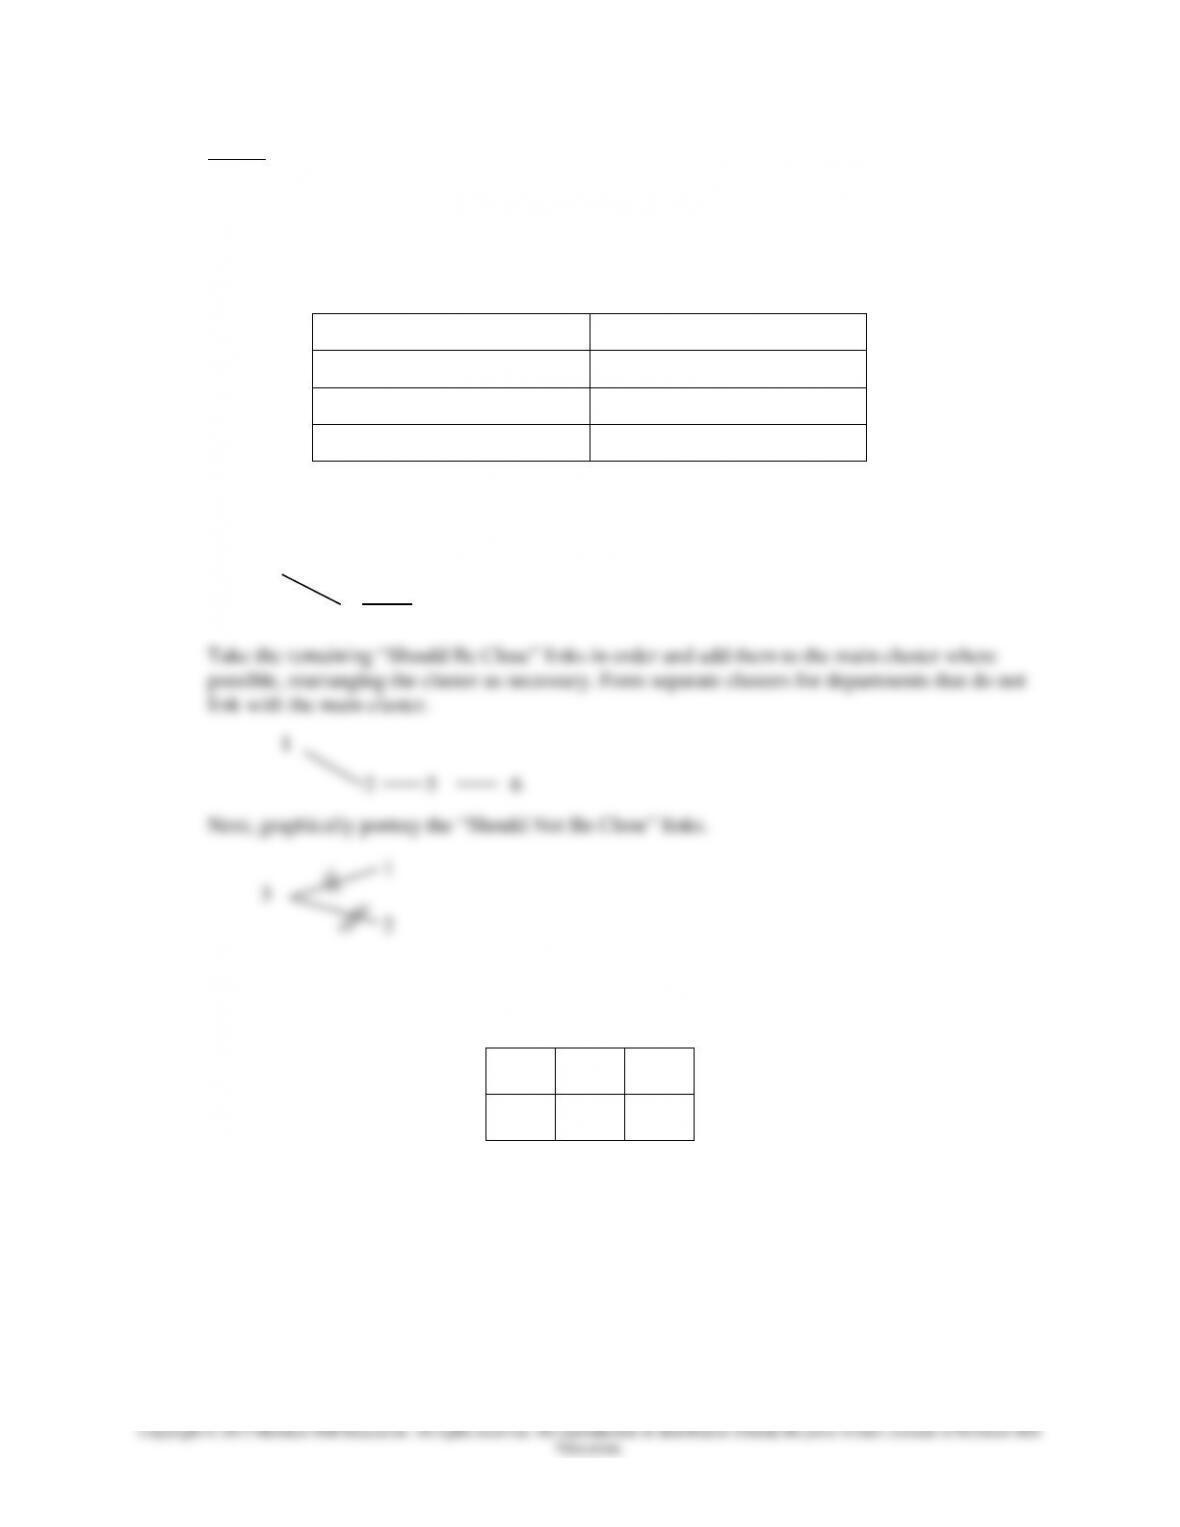
9. Given: We want to arrange 6 departments into a 2 x 3 grid to satisfy the following conditions: 1
close to 2, 5 close to 2 and 6, 2 close to 5, and 3 not close to 1 or 2.
Prepare a list of critical pairs below:
Should Be Close Links
Should Not Be Close Links
1-2
3-1
2-5
3-2
5-6
Next, form a cluster of “Should Be Close” links, beginning with the department that appears most
frequently in the list (in this case, 2):
Then, fit the cluster of “Should Be Close” links into a 2 x 3 arrangement, being careful to satisfy
the “Should Not Be Close” links also.
1
4
3
2
5
6
This solution satisfies the conditions above by arranging departments so that those departments
that should be close are (i.e., they touch side to side or corner to corner) and those that should not
be close are not touching.
2
5
1
2
Chapter 06 - Process Selection and Facility Layout
6-39
Education.
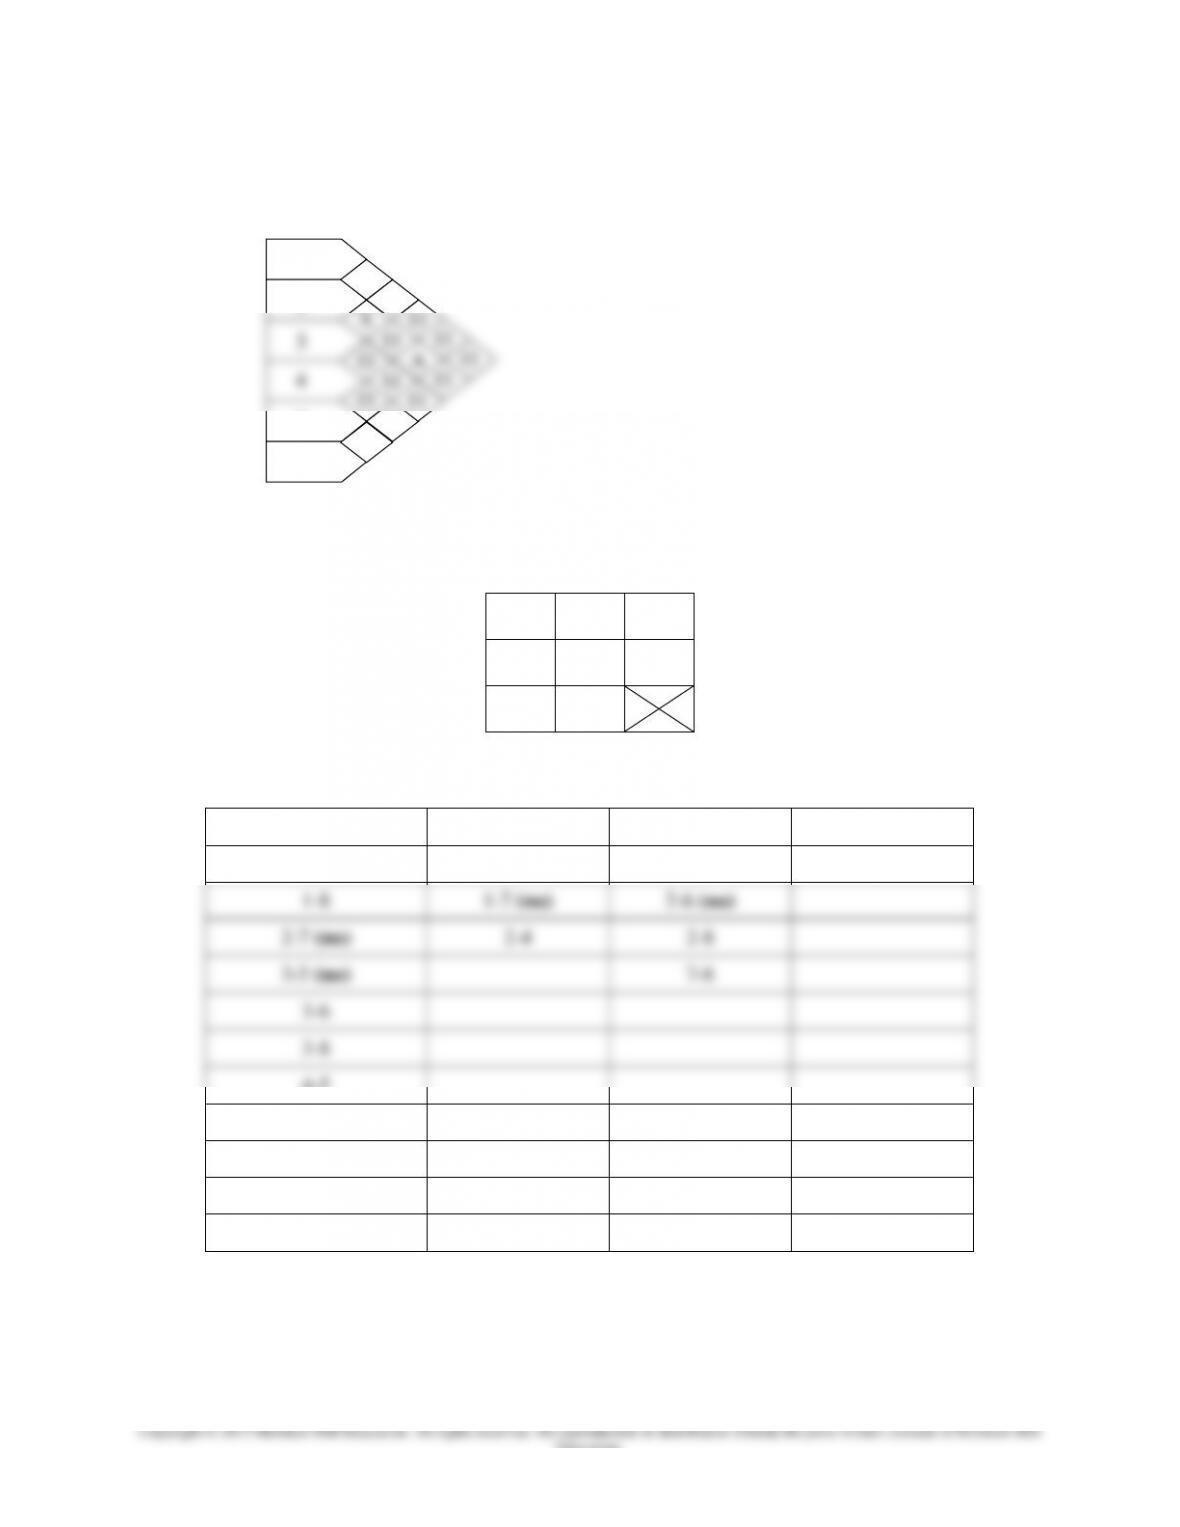
10. Develop the Muther-type grid using the letters A, O, and X for the conditions in Problem 9:
A = Absolutely necessary, O = Ordinary importance, and X = Undesirable.
11. Determine if the department locations shown below are appropriate. If not, modify the
assignments.
Check whether the following conditions have been satisfied:
A Links
X Links
E Links
I Links
1-3
1-2 (no)
1-6 (no)
3-7
1-8
1-7 (no)
2-6 (no)
2-7 (no)
2-4
2-8
3-5 (no)
7-8
3-6
3-8
4-5
4-8
5-7 (no)
5-8
6-8
Next, re-arrange departments to determine if all conditions can be satisfied. We will start with
our table of links shown below.
2
5
4
1
8
6
7
3
1
2
5
6
A
X
O
A
X
O
O
O
Chapter 06 - Process Selection and Facility Layout
6-40
Education.
A Links
X Links
E Links
I Links
1-3
1-2
1-6
3-7
1-8
1-7
2-6
2-7
2-4
2-8
3-5
7-8
3-6
3-8
4-5
4-8
5-7
5-8
6-8
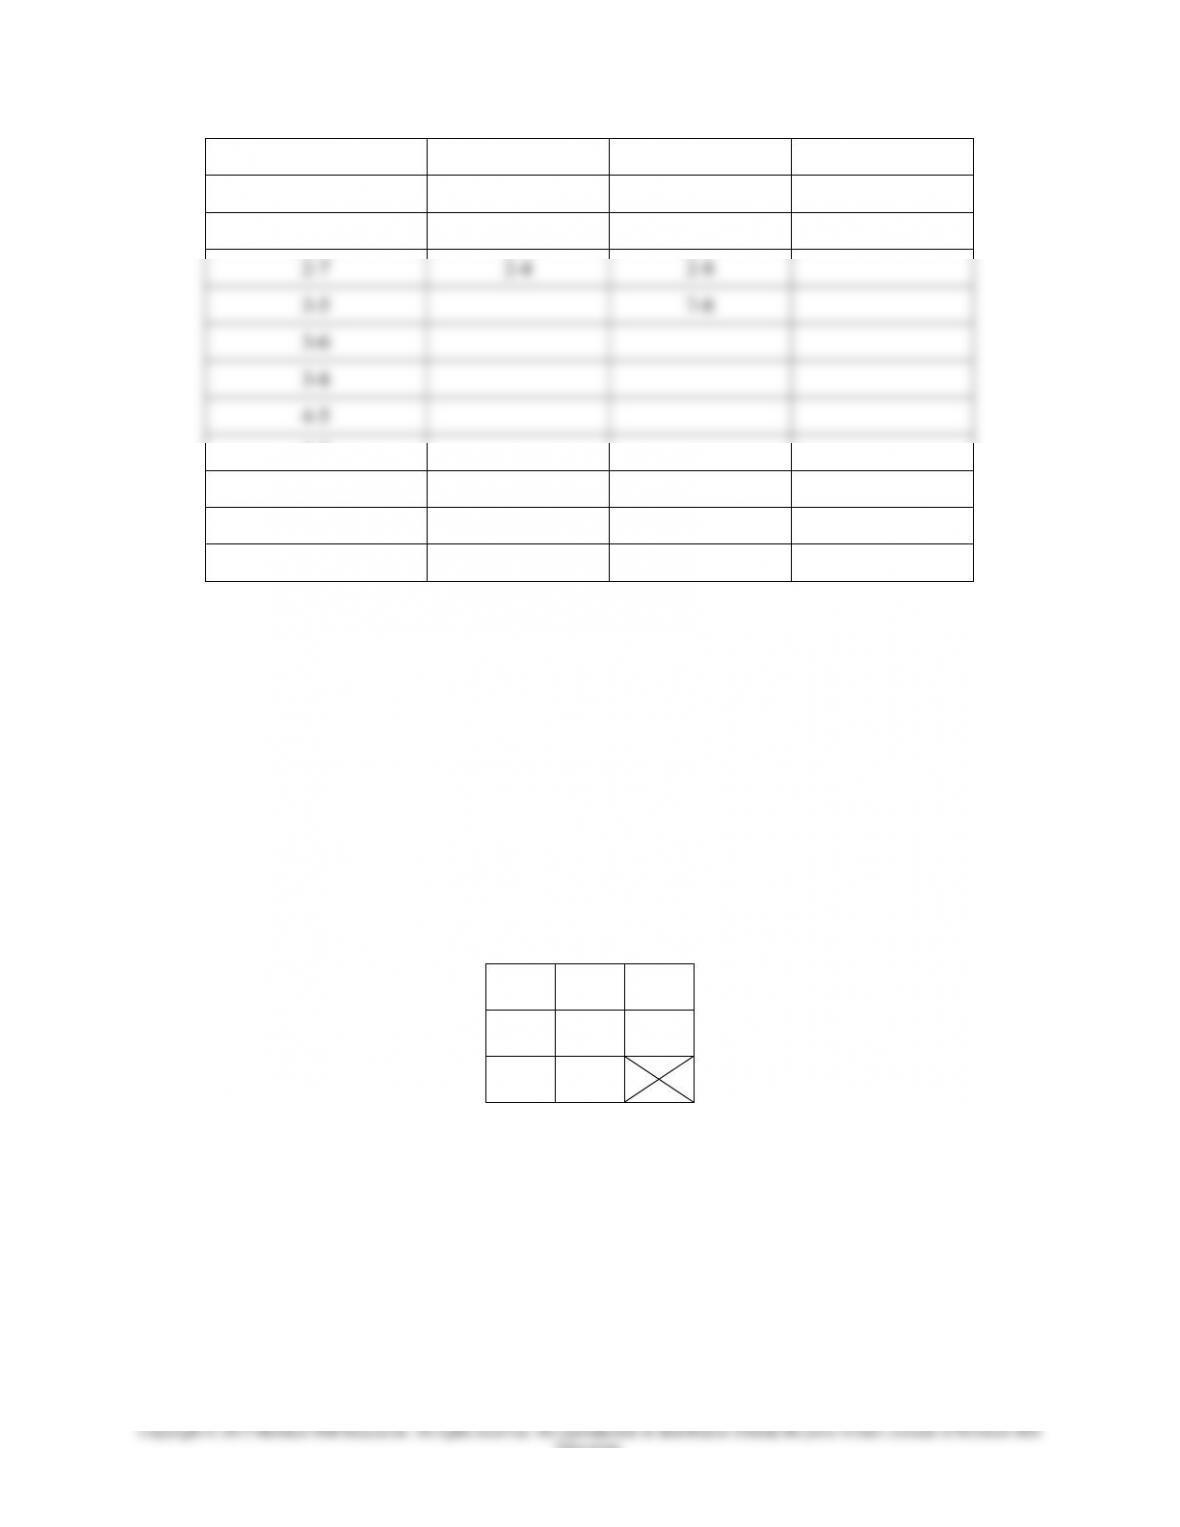
Rather than drawing clusters, we can start with a blank layout and then try to satisfy the A and
the X conditions above. After that, we can shift departments around to satisfy E conditions
followed by I conditions.
Looking at the A links, we can see that Department 8 appears most frequently, followed by
Departments 3 & 5, Departments 1, 4, 6, & 7, and then Department. 2. Department 8 is a good
candidate for a center position. We can try to satisfy those conditions in order in our layout,
shifting departments around to meet all A and X conditions. After that, we can shift departments
more if needed using trial and error to meet E conditions and then I conditions.
The layout below satisfies the A and the X conditions. It does not satisfy one E condition
(1-6) and the single I condition (3-7).
1
5
4
3
8
7
6
2


