Unlock document.
This document is partially blurred.
Unlock all pages and 1 million more documents.
Get Access
Chapter 06 - Process Selection and Facility Layout
6-21
Education.
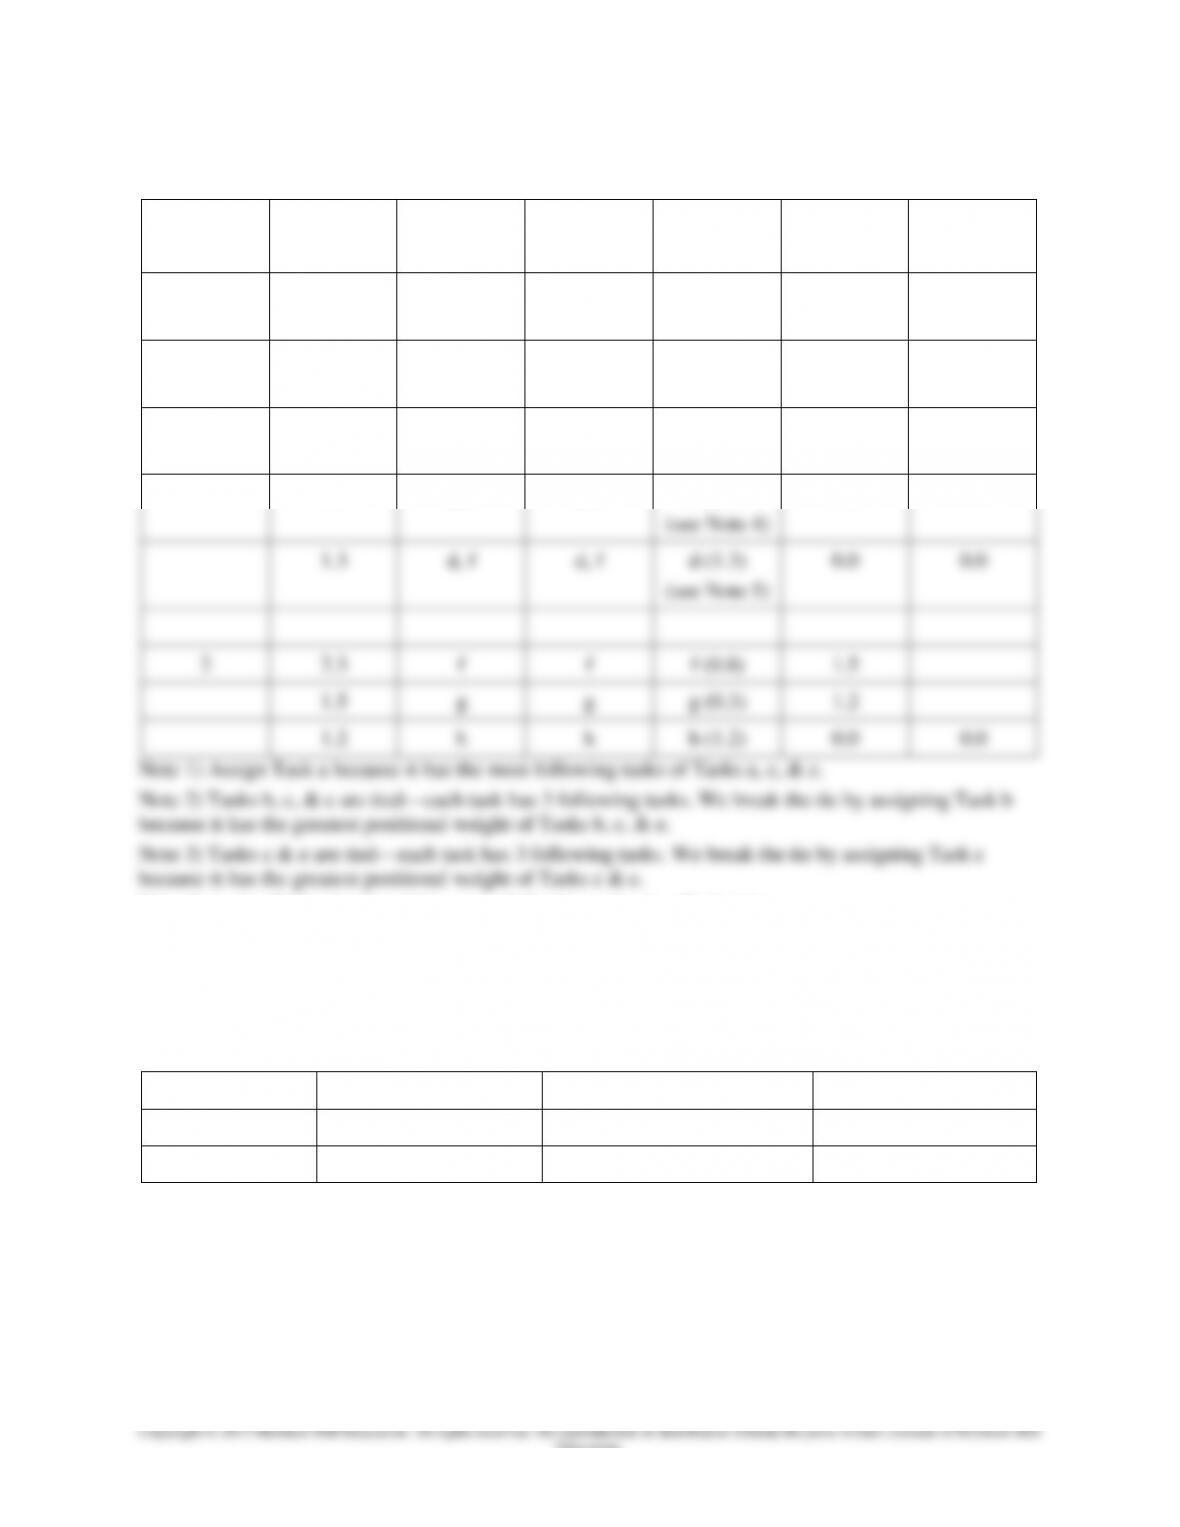
Solution Using 2 Workstations: Most Following Tasks (Cycle time = 2.3 minutes)
Station
Time
Remaining
Eligible
Will Fit
Assign
(task time)
Revised
Time
Remaining
Idle
1
2.3
a, c, e
a, c, e
a (0.2)
(see Note 1)
2.1
2.1
b, c, e
b, c, e
b (0.4)
(see Note 2)
1.7
1.7
c, e
c, e
c (0.3)
(see Note 3)
1.4
1.4
d, e
d, e
e (0.1)
(see Note 4)
1.3
1.3
d, f
d, f
d (1.3)
(see Note 5)
0.0
0.0
2
2.3
f
f
f (0.8)
1.5
1.5
g
g
g (0.3)
1.2
1.2
h
h
h (1.2)
0.0
0.0
Note 1) Assign Task a because it has the most following tasks of Tasks a, c, & e.
Note 2) Tasks b, c, & e are tied—each task has 3 following tasks. We break the tie by assigning Task b
because it has the greatest positional weight of Tasks b, c, & e.
Note 3) Tasks c & e are tied—each task has 3 following tasks. We break the tie by assigning Task c
because it has the greatest positional weight of Tasks c & e.
Note 4) Assign Task e because it has more following tasks than Task d does.
Note 5) Tasks d & f are tied—each task has 2 following tasks. We break the tie by assigning Task d
because it has the greatest positional weight of Tasks d & f.
Overview of Workstations: Most Following Tasks Solution Using 2 Workstations
Station
Tasks Assigned
Total Time Used at Station
Idle Time at Station
1
a, b, c, e, d
2.3
0.0
2
f, g, h
2.3
0.0
The solution shown above uses 2 workstations. If this solution used more than 2 workstations, we would
have to experiment with another heuristic or use trial-and-error to attempt to devise a solution with 2
workstations.
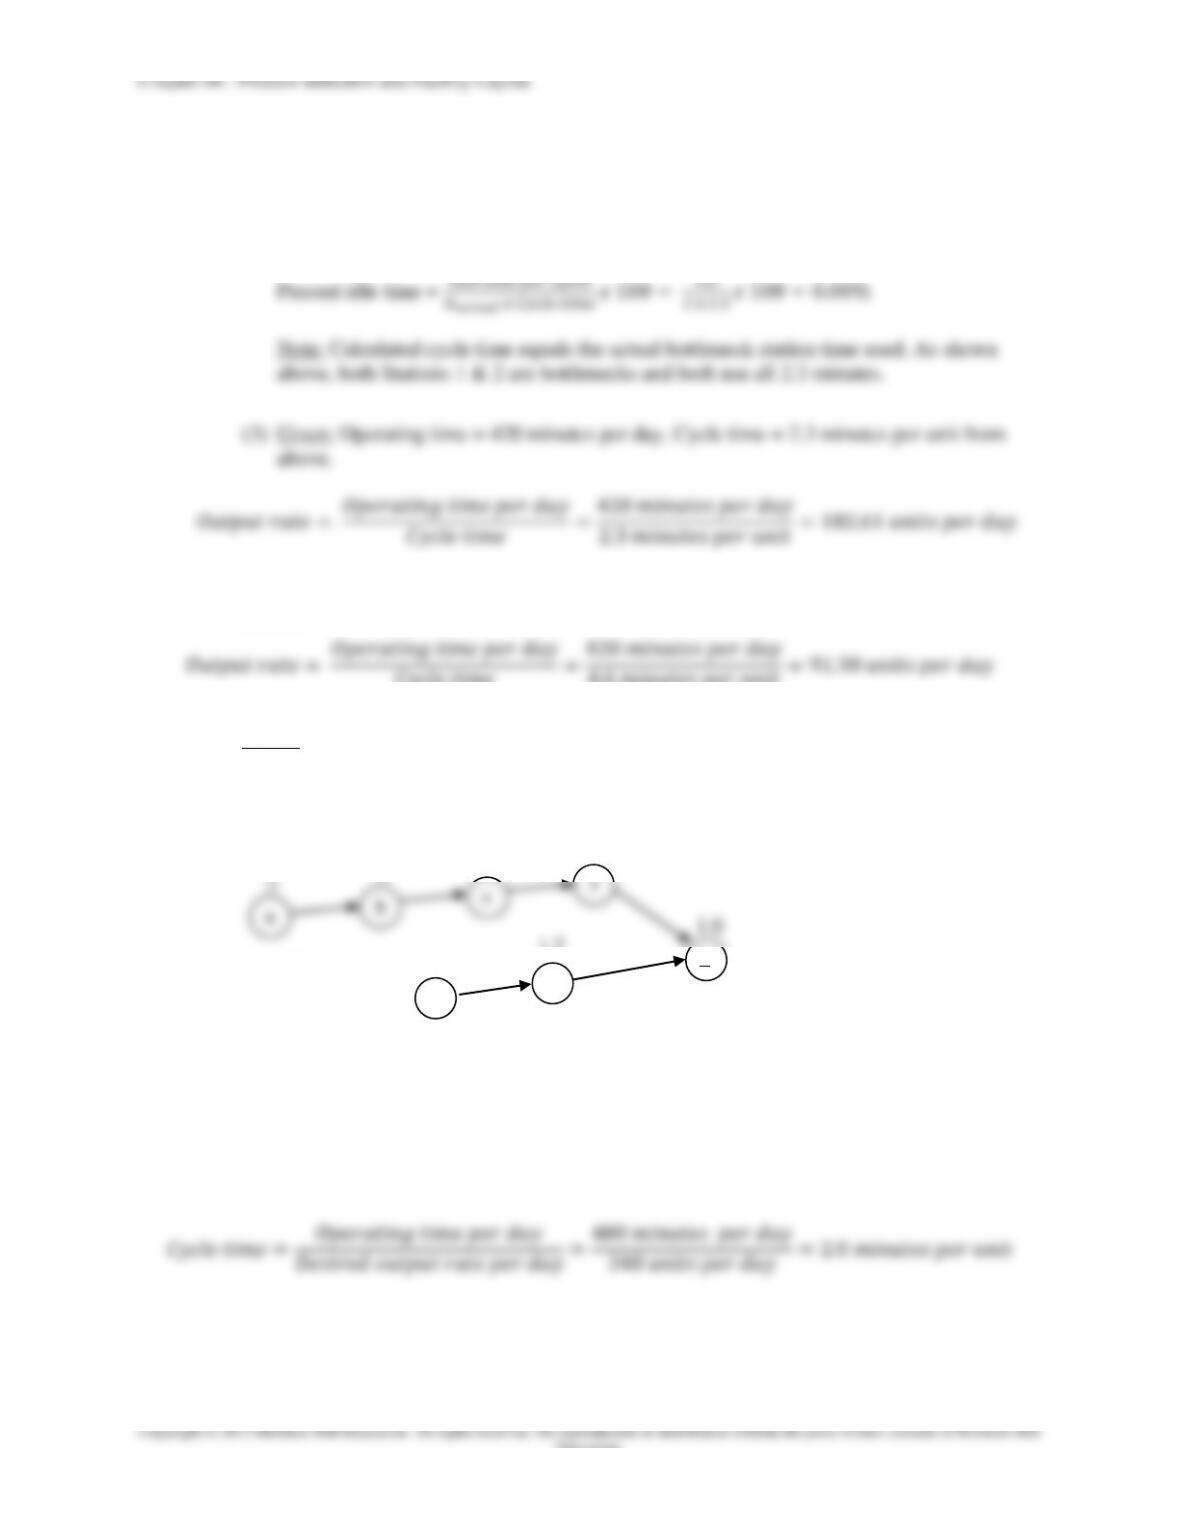
(2) Percent idle time:
Idle time per cycle = 0.0 + 0.0 = 0.0 minutes
(4) Maximum cycle time = sum of all task times = 4.6 minutes
5.
a. Given: Desired output = 240 units per eight-hour day.
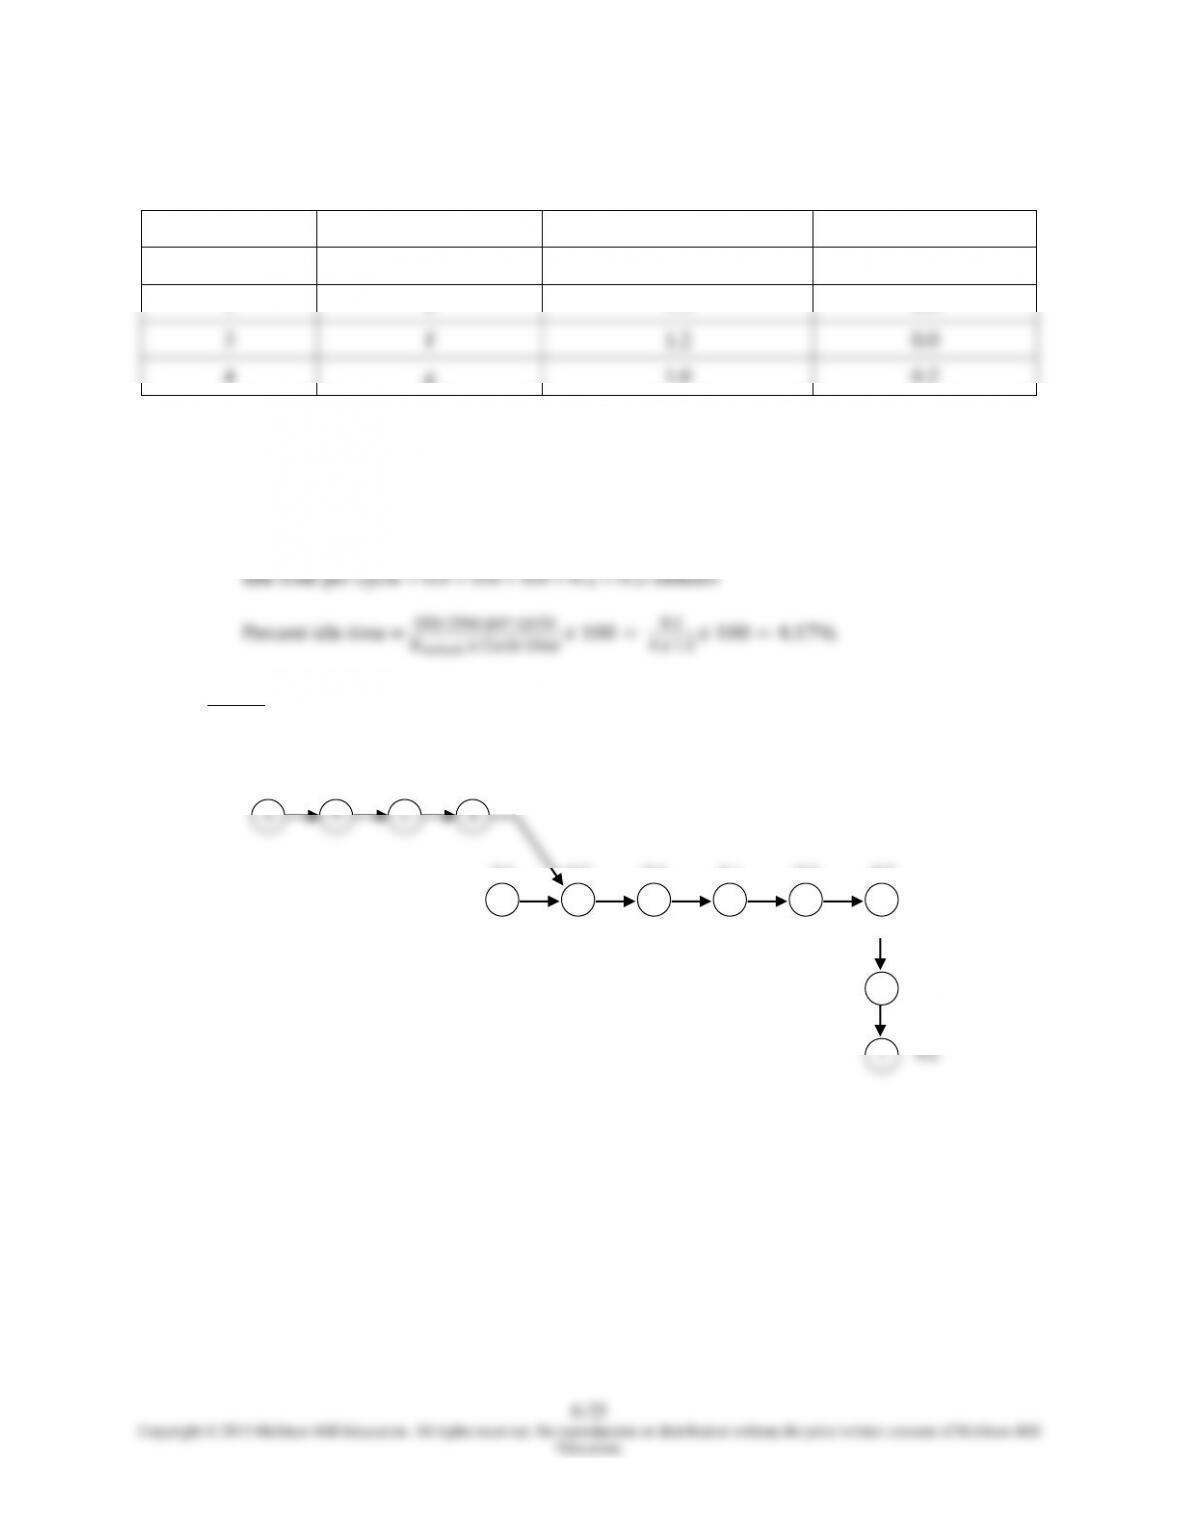
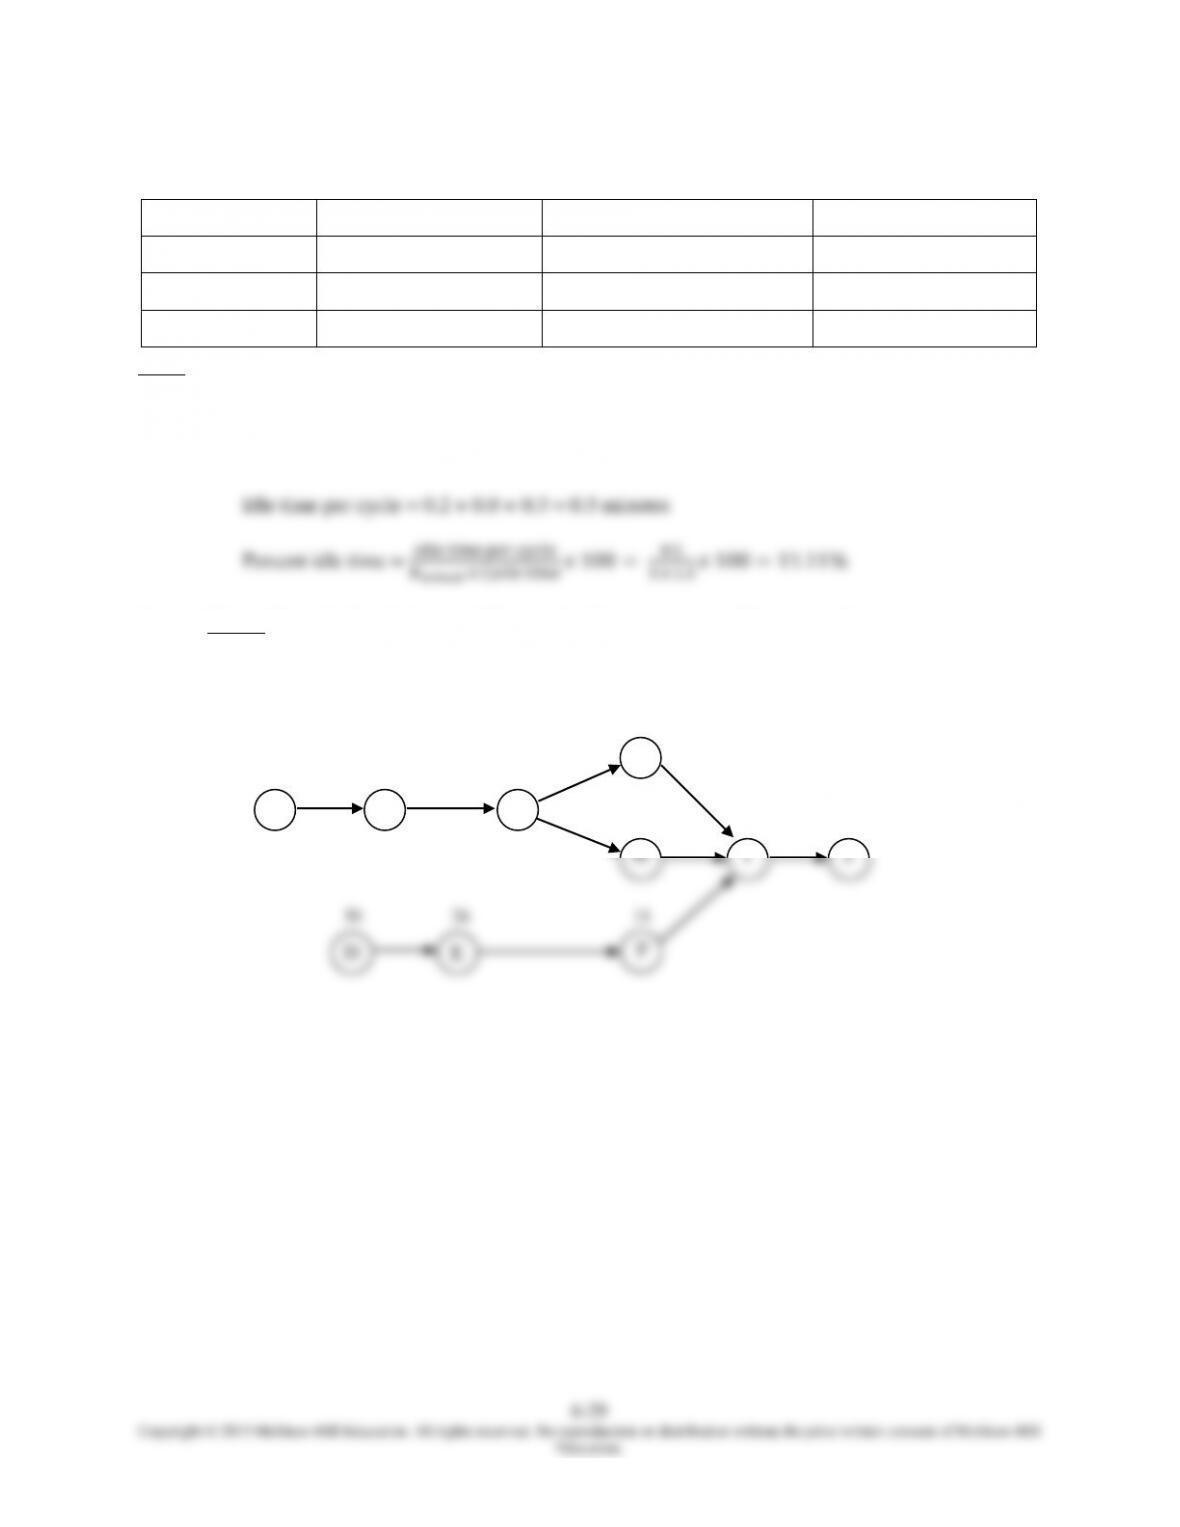
The precedence diagram appears below.
b. The minimum cycle time = maximum task time =1.2 minutes
The maximum cycle time = sum of task times = .2 + .4 + .2 + .4 + 1.2 + 1.2 + 1.0 = 4.6
minutes
Calculated cycle time:
d
e
g
.4
.2
1.2
1.0
1.2
.4
Chapter 06 - Process Selection and Facility Layout
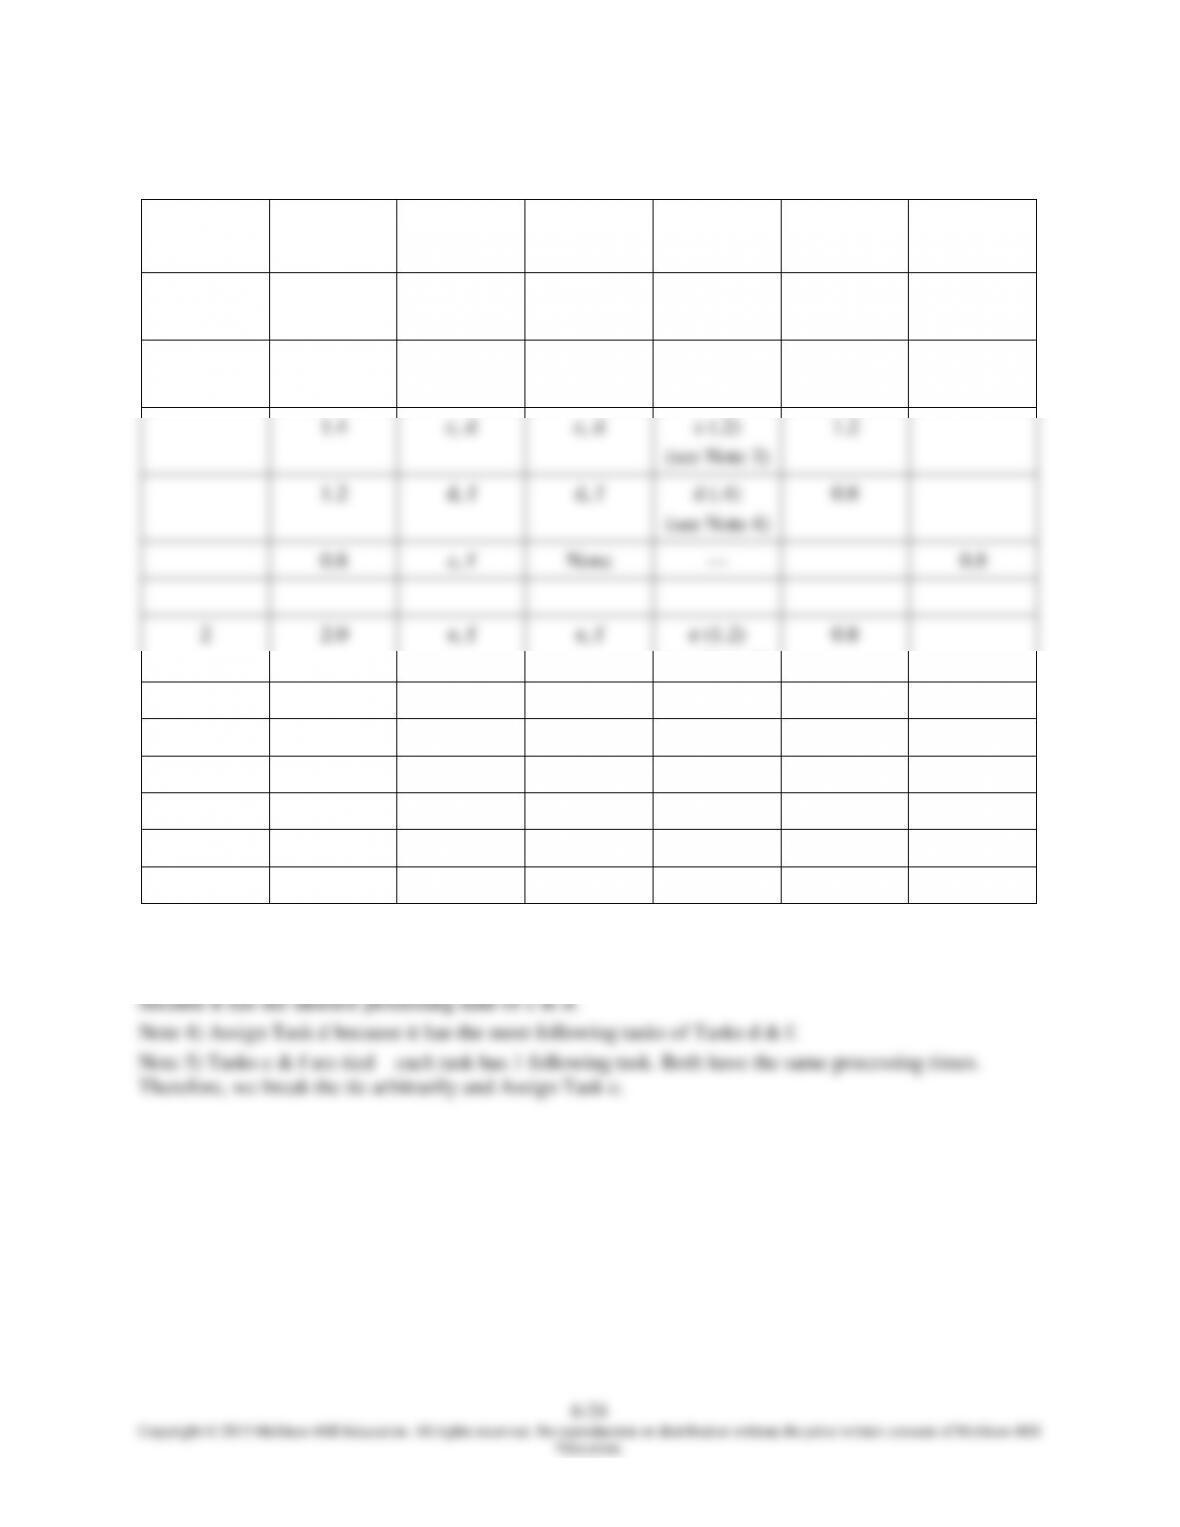
Most Following Tasks Solution (Cycle time = 2.0 minutes per unit)
Station
Time
Remaining
Eligible
Will Fit
Assign
(task time)
Revised
Time
Remaining
Idle
1
2.0
a, d
a, d
a (.2)
(see Note 1)
1.8
1.8
b, d
b, d
b (.4)
(see Note 2)
1.4
1.4
c, d
c, d
c (.2)
(see Note 3)
1.2
1.2
d, f
d, f
d (.4)
(see Note 4)
0.8
0.8
e, f
None
---
0.8
2
2.0
e, f
e, f
e (1.2)
(see Note 5)
0.8
0.8
f
None
---
0.8
3
2.0
f
f
f (1.2)
0.8
0.8
g
None
---
0.8
4
2.0
g
g
g (1.0)
1.0
1.0
Note 1) Assign Task a because it has the most following tasks of Tasks a & d.
Note 2) Assign Task b because it has the most following tasks of Tasks b & d.
Note 3) Tasks c & d are tied—each task has 2 following tasks. We break the tie by assigning Task c
Chapter 06 - Process Selection and Facility Layout
Overview of Workstations: Most Following Tasks Solution
*Note: The calculated cycle time (2.0 minutes per unit) and the actual bottleneck station time (1.2
minutes per unit) differ. The actual bottleneck time (1.2 minutes) should be used as the cycle time in
all calculations. The actual bottleneck time is determined by Stations 1, 2, & 3.
e. Percent idle time:
6. Given: Cycle time = 1.5 minutes per unit.
a. The precedence diagram is shown below.
Station
Tasks Assigned
Total Time Used at Station
Idle Time at Station*
1
a, b, c, d
1.2
0.0
2
e
1.2
0.0
3
f
1.2
0.0
4
g
1.0
0.2
0.1
0.2
0.9
0.6
0.1
0.2
0.4
0.1
0.2
0.7
a
b
c
d
e
f
g
h
i
j
k
0.3
Chapter 06 - Process Selection and Facility Layout
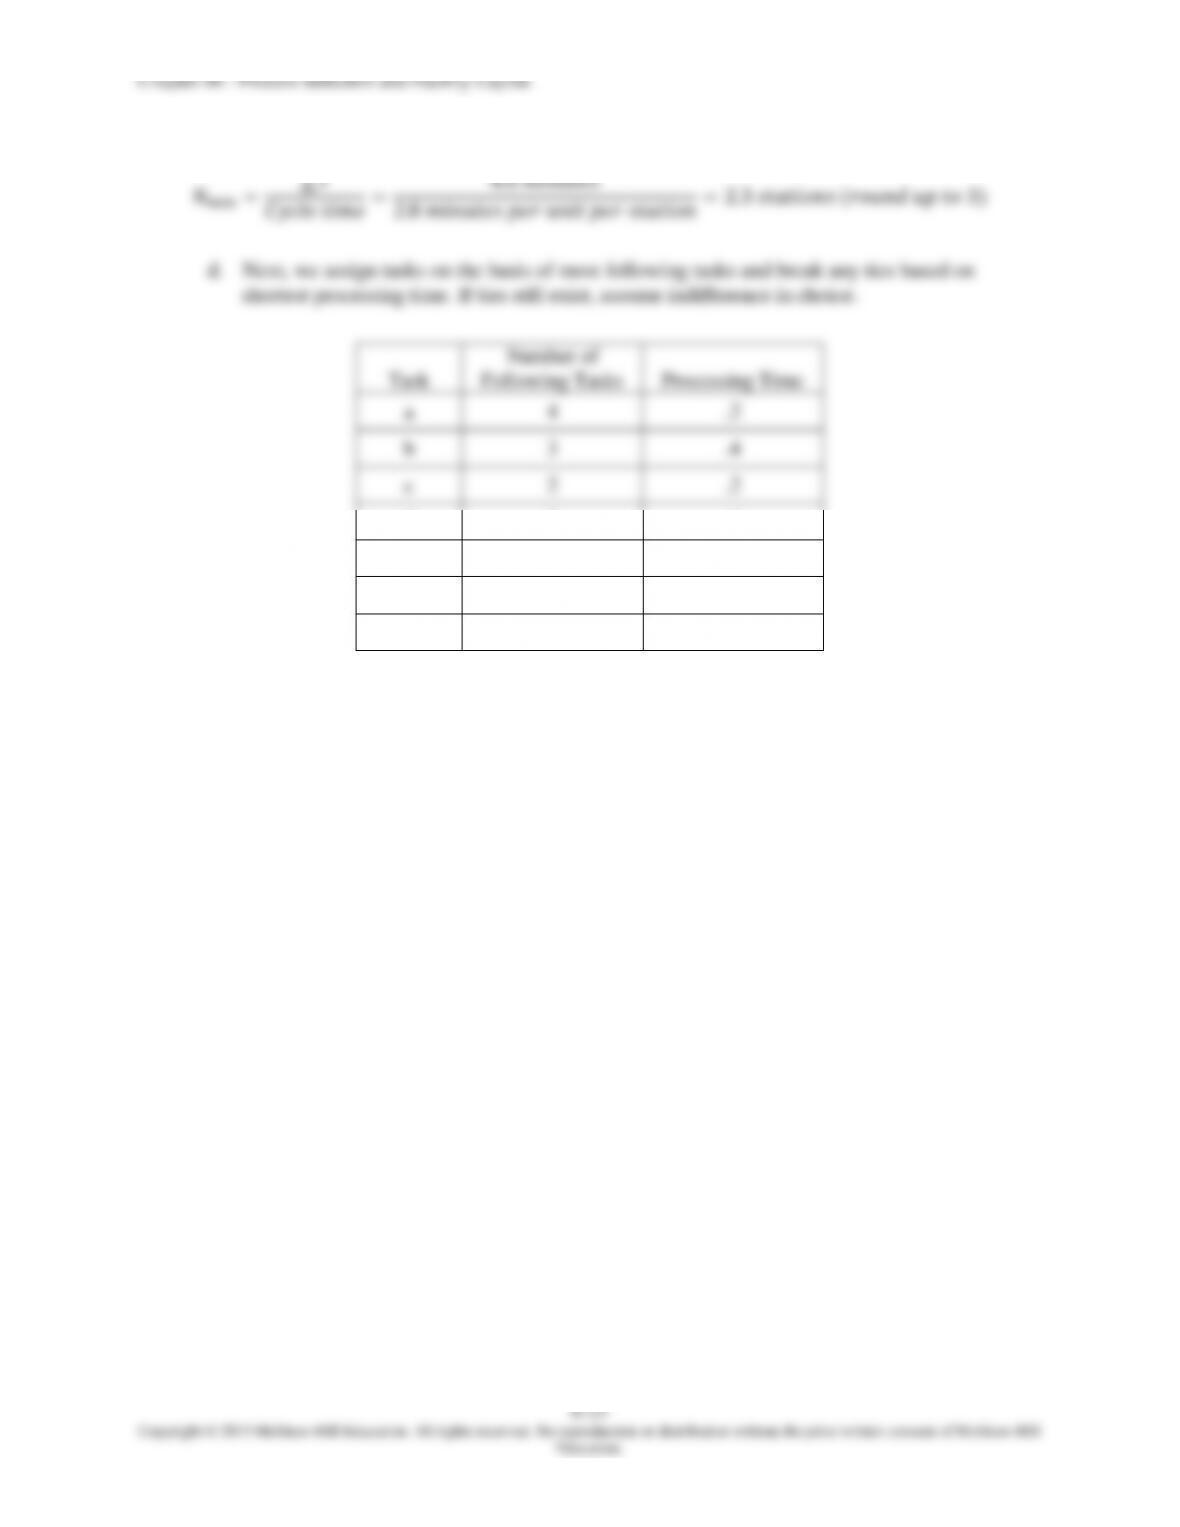
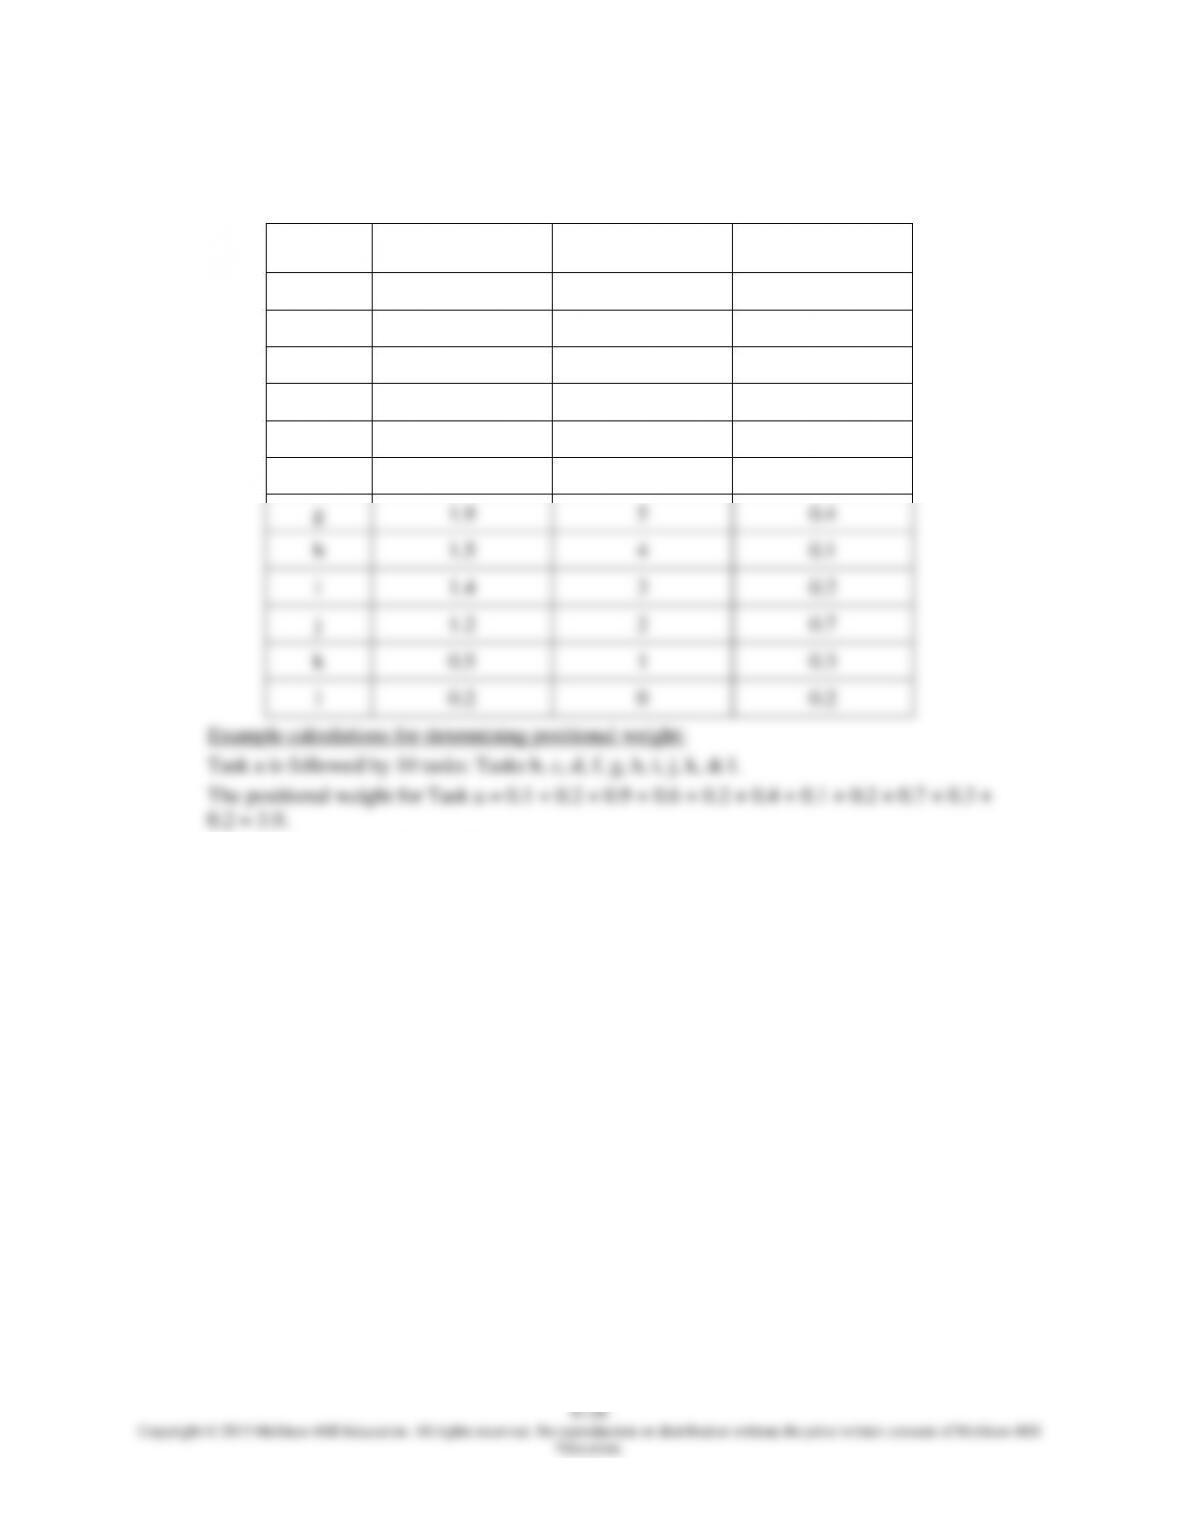
b. (1) Assign tasks in order of greatest positional weight. Break ties based on shortest
processing time.
Task
Positional Weight
Number of
Following Tasks
Processing Time
a
3.9
10
0.1
b
3.8
9
0.2
c
3.6
8
0.9
d
2.7
7
0.6
e
2.2
7
0.1
f
2.1
6
0.2
g
1.9
5
0.4
h
1.5
4
0.1
i
1.4
3
0.2
j
1.2
2
0.7
k
0.5
1
0.3
l
0.2
0
0.2
Example calculations for determining positional weight:
Task a is followed by 10 tasks: Tasks b, c, d, f, g, h, i, j, k, & l.
The positional weight for Task a = 0.1 + 0.2 + 0.9 + 0.6 + 0.2 + 0.4 + 0.1 + 0.2 + 0.7 + 0.3 +
0.2 = 3.9.
Task e is followed by 7 tasks: Tasks f, g, h, i, j, k, & l.
The positional weight for Task e = 0.1 + 0.2 + 0.4 + 0.1 + 0.2 + 0.7 + 0.3 + 0.2 = 2.2.
Chapter 06 - Process Selection and Facility Layout
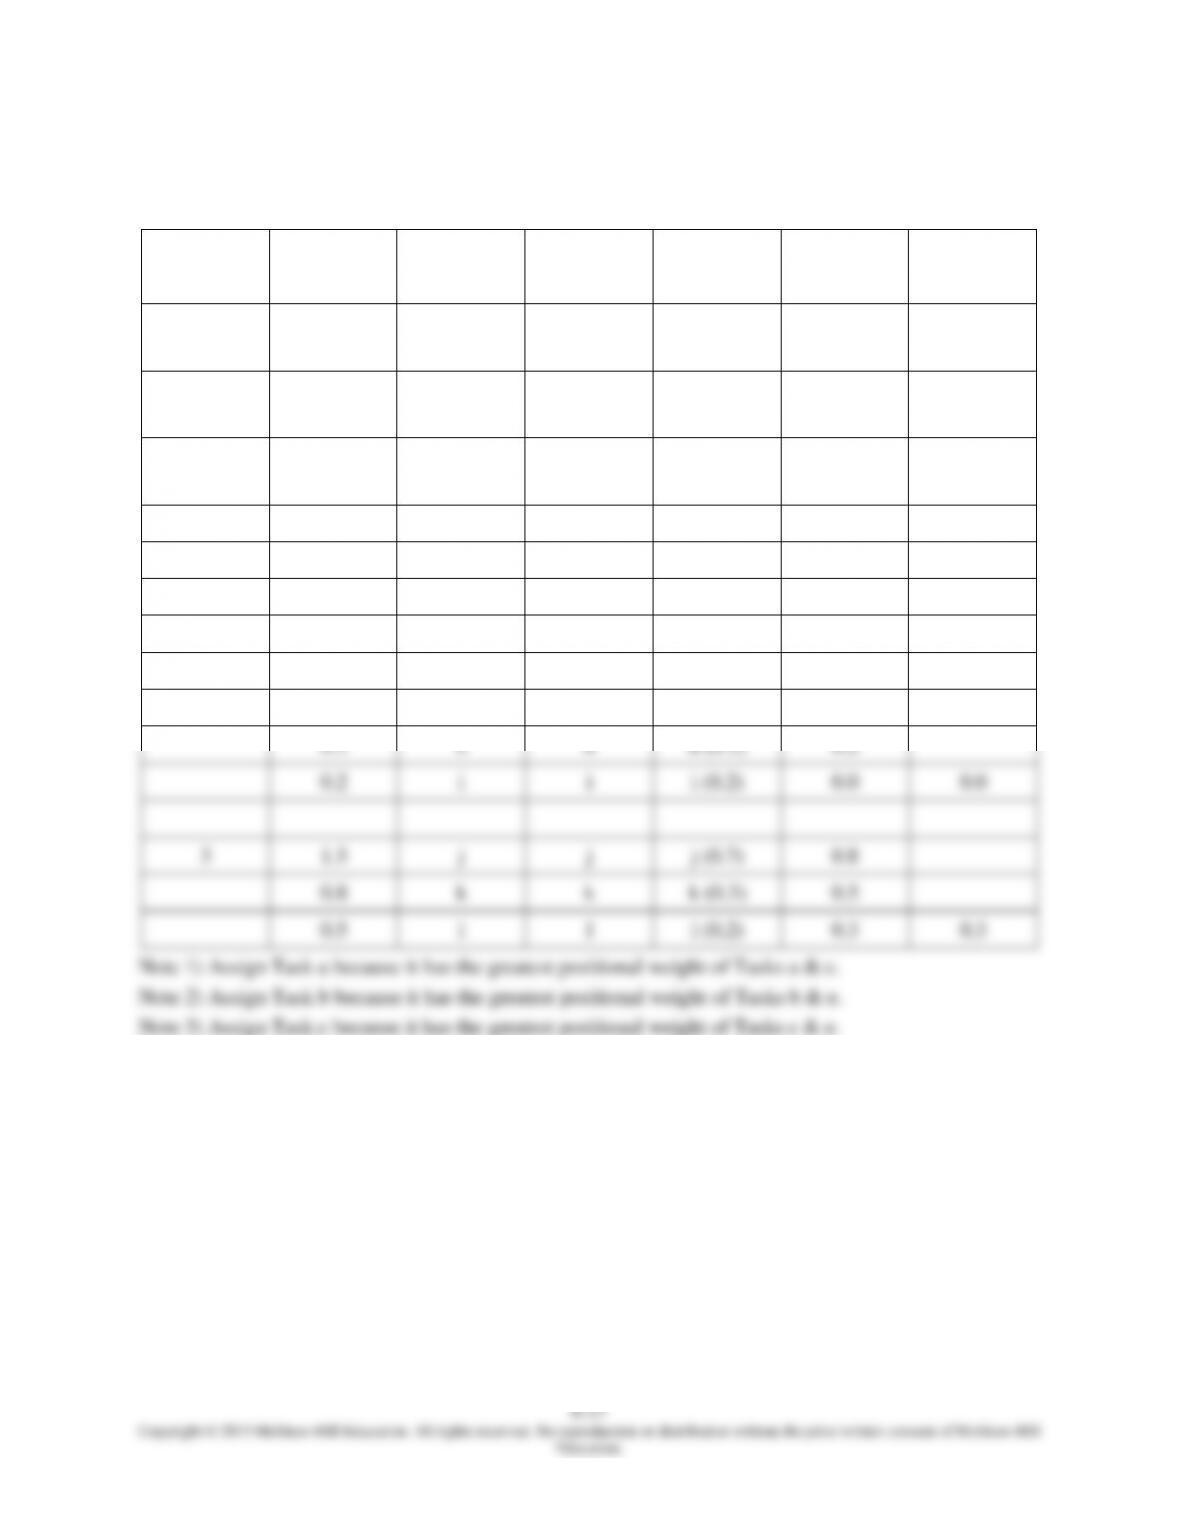
Greatest Positional Weight Solution (Cycle time = 1.5 minutes per unit)
Station
Time
Remaining
Eligible
Will Fit
Assign
(task time)
Revised
Time
Remaining
Idle
1
1.5
a, e
a, e
a (0.1)
(see Note 1)
1.4
1.4
b, e
b, e
b (0.2)
(see Note 2)
1.2
1.2
c, e
c, e
c (0.9)
(see Note 3)
0.3
0.3
d, e
e
e (0.1)
0.2
0.2
d
None
---
0.2
2
1.5
d
d
d (0.6)
0.9
0.9
f
f
f (0.2)
0.7
0.7
g
g
g (0.4)
0.3
0.3
h
h
h (0.1)
0.2
0.2
i
i
i (0.2)
0.0
0.0
3
1.5
j
j
j (0.7)
0.8
0.8
k
k
k (0.3)
0.5
0.5
l
l
l (0.2)
0.3
0.3
Chapter 06 - Process Selection and Facility Layout
Overview of Workstations: Greatest Positional Weight Solution
Station
Tasks Assigned
Total Time Used at Station
Idle Time at Station
1
a, b, c, e
1.3
0.2
2
d, f, g, h, i
1.5
0.0
j, k, l
1.2
0.3
(2) Assign tasks based on most following tasks. Break ties based on shortest processing time.
Most Following Tasks Solution (Cycle time = 1.5 minutes per unit)
Station
Time
Remaining
Eligible
Will Fit
Assign
(task time)
Revised
Time
Remaining
Idle
1
1.5
a, e
a, e
a (0.1)
(see Note 1)
1.4
1.4
b, e
b, e
b (0.2)
(see Note 2)
1.2
1.2
c, e
c, e
c (0.9)
(see Note 3)
0.3
0.3
d, e
e
e (0.1)
0.2
0.2
d
None
---
0.2
2
1.5
d
d
d (0.6)
0.9
0.9
f
f
f (0.2)
0.7
0.7
g
g
g (0.4)
0.3
0.3
h
h
h (0.1)
0.2
0.2
i
i
i (0.2)
0.0
0.0
3
1.5
j
j
j (0.7)
0.8
0.8
k
k
k (0.3)
0.5
0.5
l
l
l (0.2)
0.3
0.3
Note 1) Assign Task a because it has the most following task of Tasks a & e.
Note 2) Assign Task b because it has the most following tasks of Tasks b & e.
Note 3) Assign Task c because it has the most following tasks of Tasks c & e.
Chapter 06 - Process Selection and Facility Layout
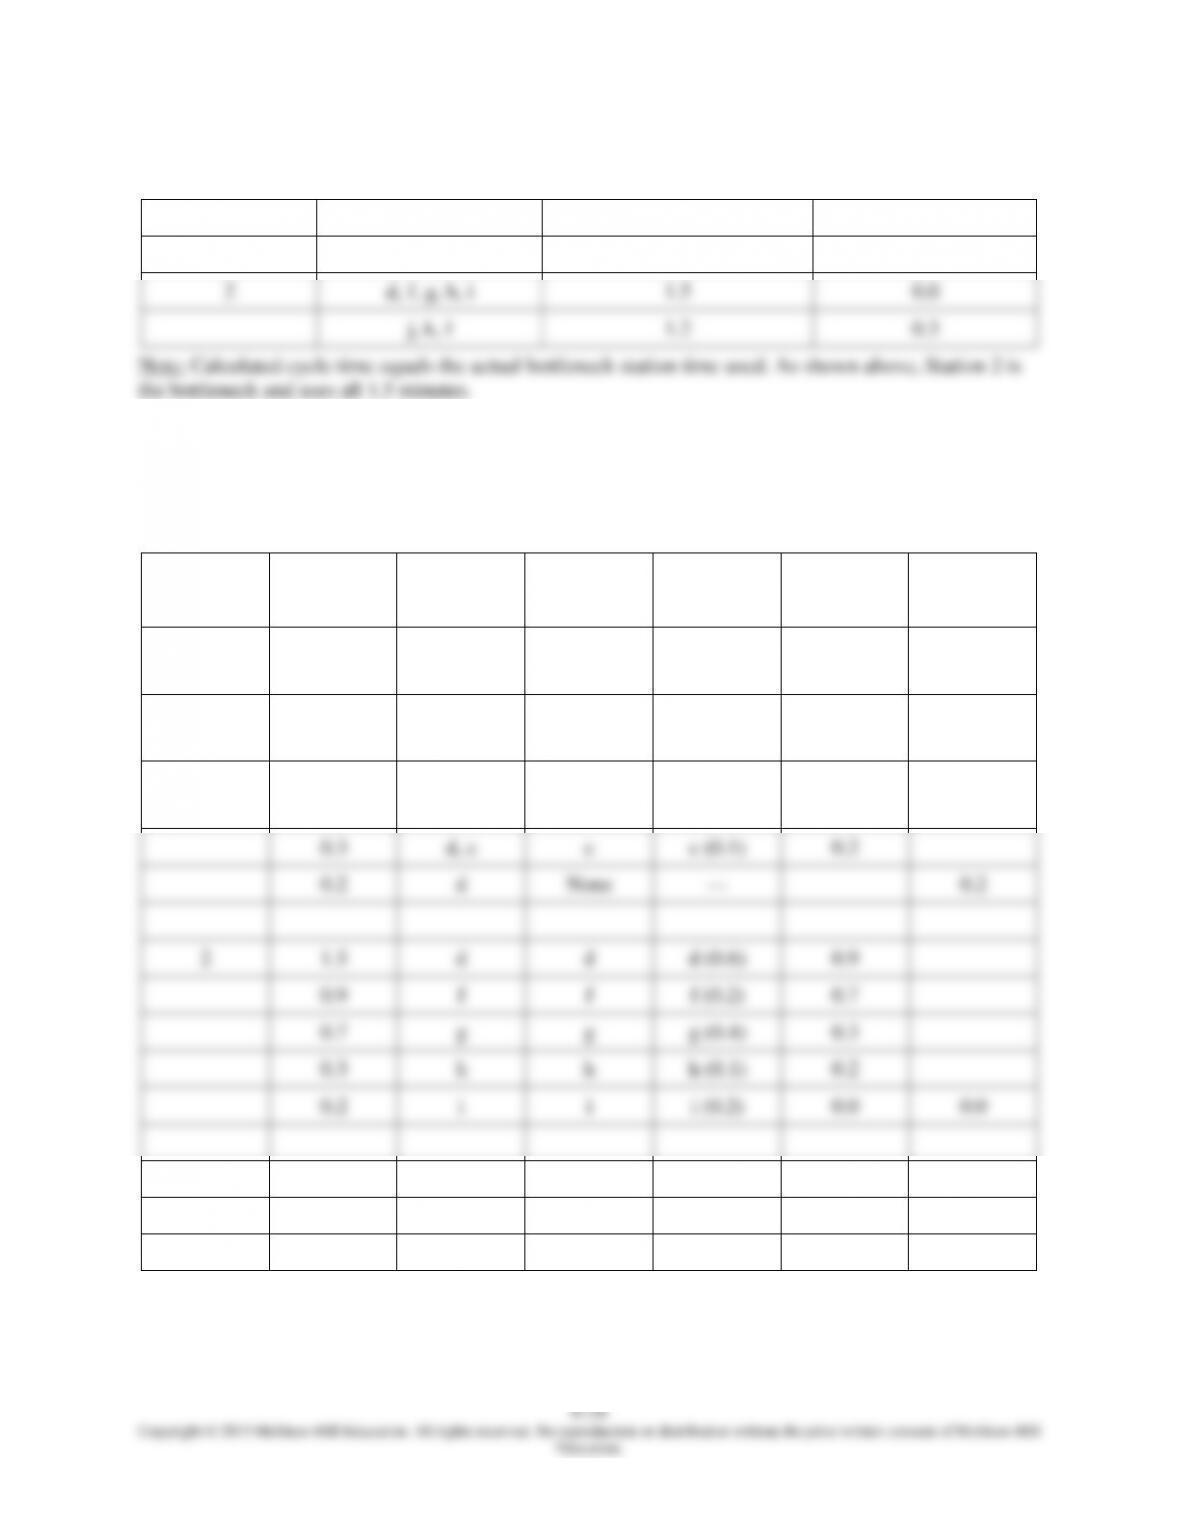
Overview of Workstations: Most Following Tasks Solution
Station
Tasks Assigned
Total Time Used at Station
Idle Time at Station
1
a, b, c, e
1.3
0.2
2
d, f, g, h, i
1.5
0.0
3
j, k, l
1.2
0.3
Note: Calculated cycle time equals the actual bottleneck station time used. As shown above, Station 2 is
the bottleneck and uses all 1.5 minutes.
c. Percent Idle Time (Both solutions were identical):
7. Given: Sum of all task times = 193 seconds. Operating time = 7 hours per day.
a. Draw the precedence diagram (all times are in seconds).
A
B
C
H
G
I
J
45
11
9
12
10
9
10
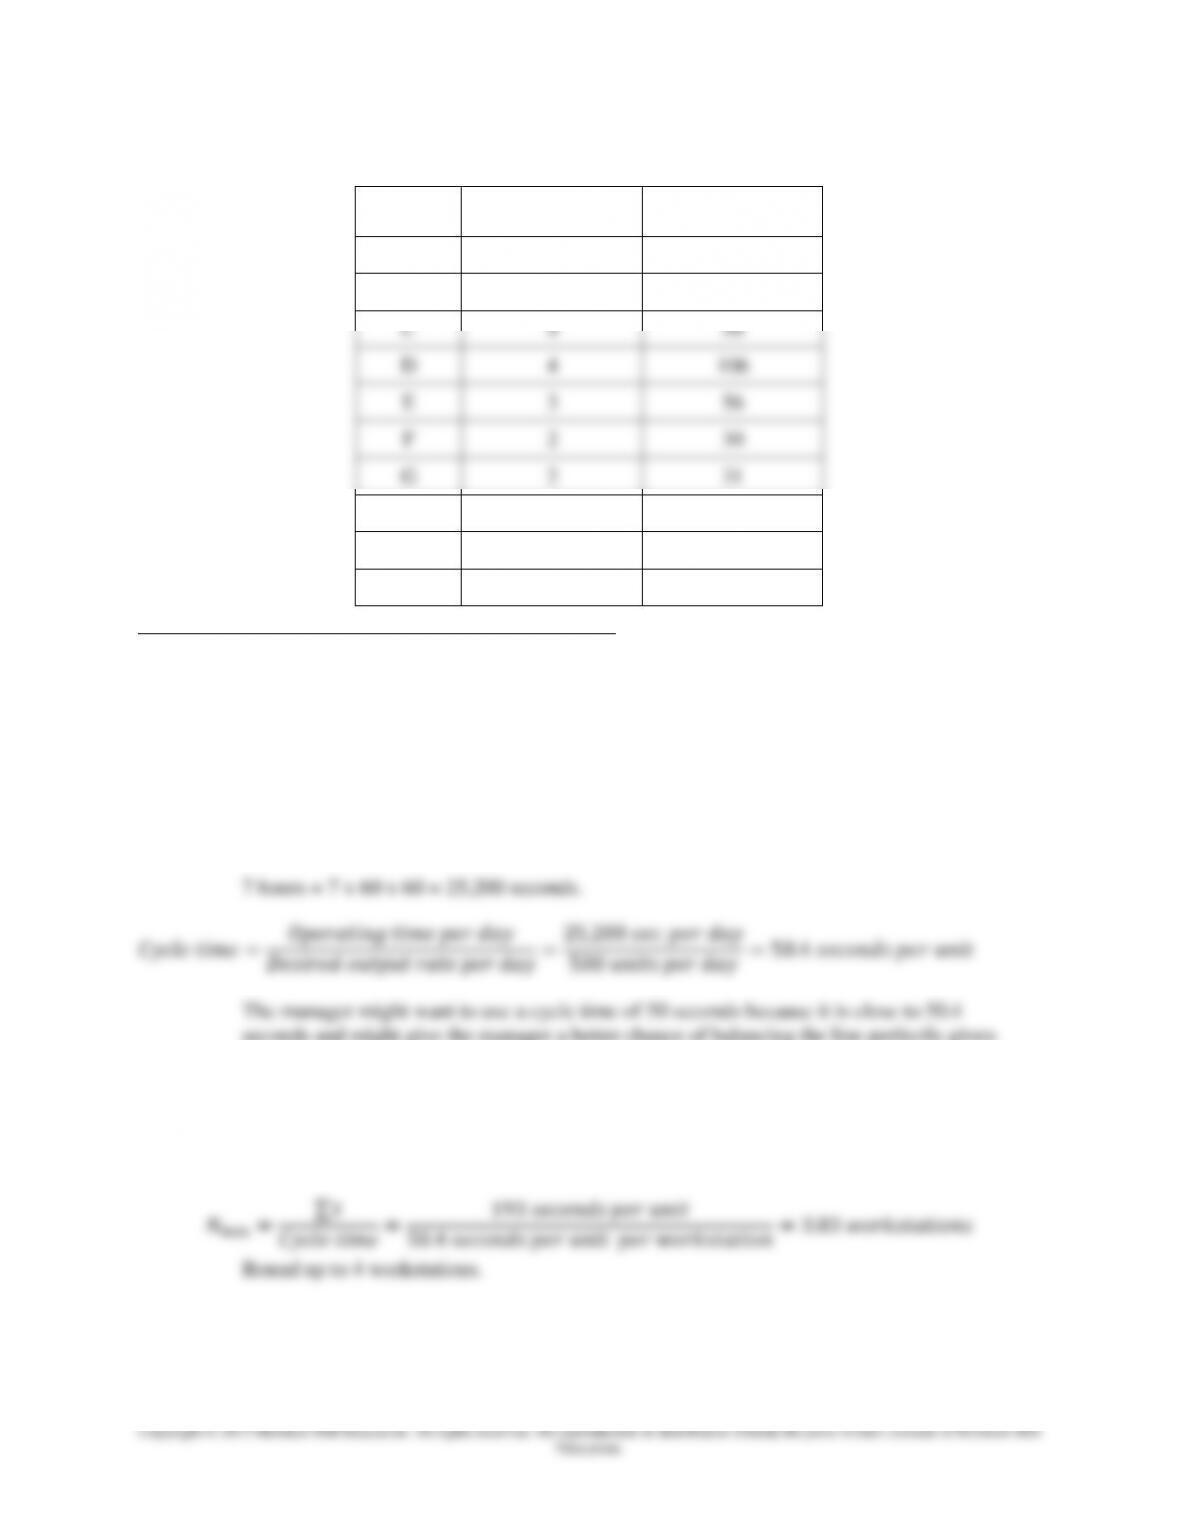
Chapter 06 - Process Selection and Facility Layout
6-30
Task
Number of
Following Tasks
Positional Weight
A
6
106
B
5
61
C
4
50
D
4
106
E
3
56
F
2
30
G
2
31
H
2
29
I
1
19
J
0
10
Example calculations for determining positional weight:
Task A is followed by 6 tasks: Tasks B, C, G, H, I, & J.
The positional weight for Task A = 45 + 11 + 9 + 12 + 10 + 9 + 10 = 106.
Task D is followed by 4 tasks: Tasks E, F, I, & J.
The positional weight for Task D = 50 + 26 + 11 + 9 + 10 = 106.
b. Minimum cycle time = length of longest task = 50 seconds per unit.
Cycle time for a desired output of 500 units in a 7-hour day:
seconds and might give the manager a better chance of balancing the line perfectly given
that all task times are integer values.
c. Minimum number of workstations needed for output of 500 units per day:
Cycle time = 50.4 seconds per unit.


