Chapter 05 – Strategic Capacity Planning for Products and Services
5–20
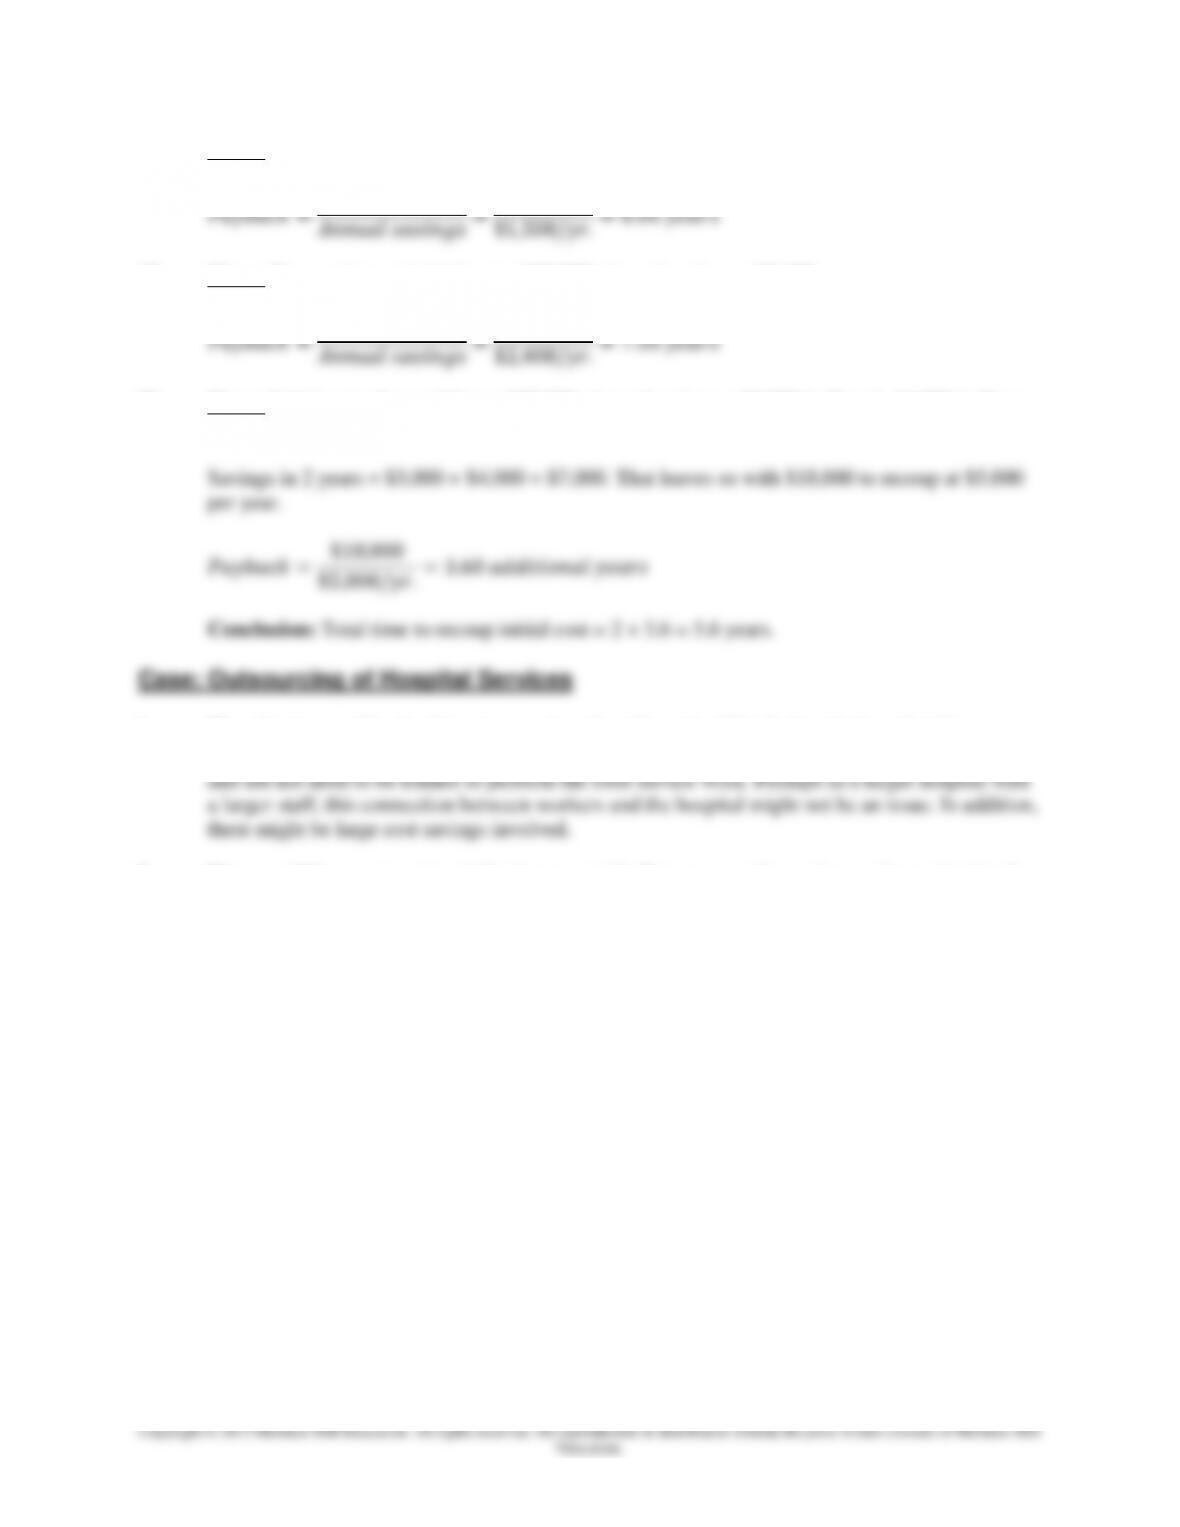
18. Given: New equipment initial cost = $12,000. Annual savings = $1,500.
19. Given: New equipment initial cost = $18,000. Annual savings = $2,400.
20. Given: Initial cost of remodeling = $25,000. Annual savings = $3,000 in Year 1, $4,000 in Year
2, & $5,000 thereafter.
1. The advantages of having the outsourced work performed within the hospital are that the
hospital’s workers felt a connection with the hospital, still felt a sense of ownership in their jobs,
2. There could be a cost savings in having an outside firm manage the service, or the motivation for
outsourcing could be avoidance of the burden of managing housekeeping.
3. The reason for asking another hospital to join it would be economies of scale and lower costs for
laundry service.

Chapter 05 – Strategic Capacity Planning for Products and Services
5–21
Education.
Enrichment Module: Solving Capacity Planning Problems
Capacity-planning problems can be classified in a number of different ways. One such classification for
intermediate and short-range problems is given below:
1. Output capacity determination
2. Input capacity determination
3. Capacity-demand match (input or output)
The categories listed above can involve either manufacturing or service problems. The solutions to the
following realistic examples will provide an easy and an intuitive way to comprehend and solve capacity-
planning problems.
Problem 1 Manufacturing Example
(Output capacity determination and capacity-demand match)
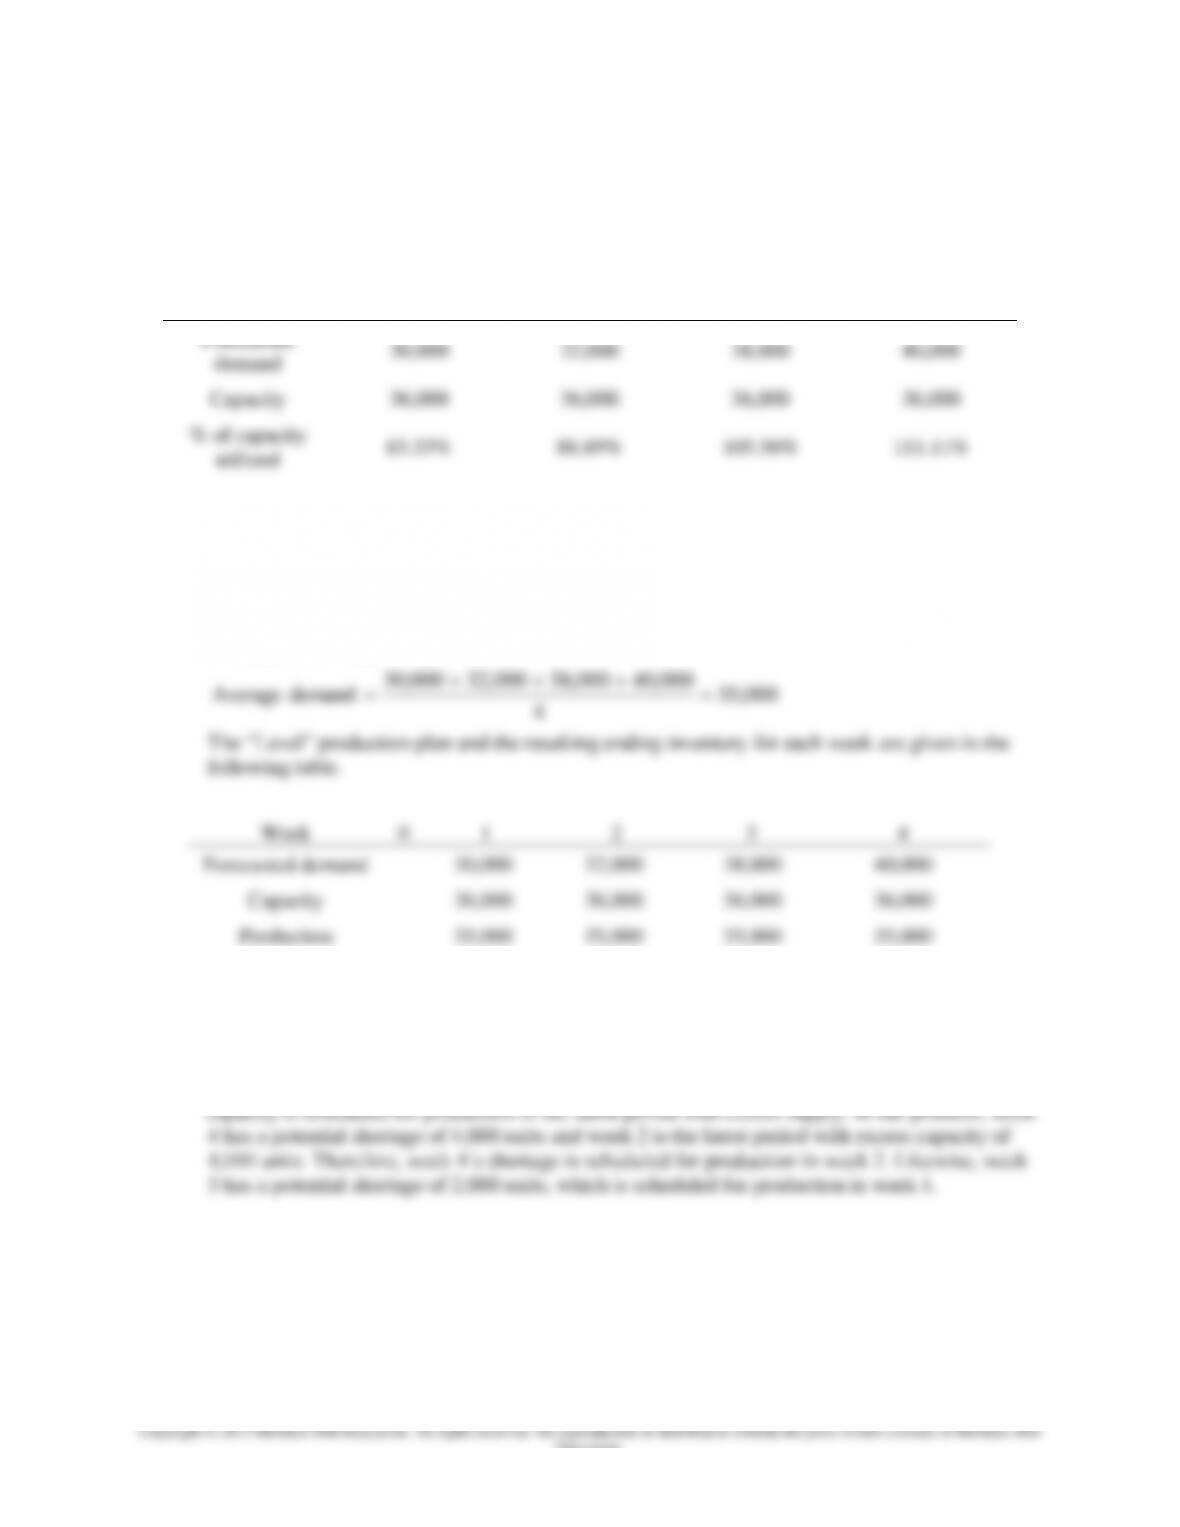
A battery manufacturing plant normally operates two eight–hour shifts per day and 6 days per week. The
manufacturer can produce 375 units per hour. Over the next four weeks, the aggregate demand for the
batteries is given in the following table.
Week
1
2
3
4
Demand
30,000
32,000
38,000
40,000
a. Calculate the weekly capacity of the plant.
b. If the firm attempts to produce the demanded quantity, at what percentage of the capacity would
it be operating each week?
c. Determine the “Level” production schedule and the resulting average inventory for the 4-week
period. Assume that no shortages are allowed and the current inventory is zero and desired ending
inventory in week 4 also is zero.
d. Determine the “Chase” production schedule and the resulting average inventory for the 4-week
period. Assume that no shortages are allowed and the current and desired ending inventory in
week 4 is zero.
e. Based on your answers to part c and d, discuss the trade-off between “Level” and the “Chase”
production plans.
Note: Part a of this problem can be classified as output capacity determination while parts b
through e deal with capacity-demand match.

Chapter 05 – Strategic Capacity Planning for Products and Services
5–22
Education.
Problem 2 Service Example
(Output capacity determination)
A small grocery store has a total of four regular checkout lines and one express checkout line. Recently
on Sundays the store has been experiencing either excessive idle time for cashiers or excessively long
customer waiting lines. The results of a recent time study performed by a management consulting
company showed that the average service time for express and regular checkout lines are 3 and 10
minutes respectively. As the next step in analyzing the problem, the manager of the grocery store wants to
determine the estimated capacity of the store on Sundays in terms of total number of customers. Currently
the store is open from 6 a.m. to midnight on Sundays. The express checkout line is always open while
there is only one regular line open from 6 a.m. to 9 a.m. and also only one regular line open from 9 p.m.
to midnight. There are two regular checkout lines open from 9 a.m. to noon and also from 6 p.m. to 9 p.m.
All four regular lines are open between noon and 6 p.m.
a. Determine the current capacity of the store in total number of customers for Sundays.
b. Assume that the store manager decides to reduce the number of regular lines from 2 to 1 between
7 p.m. and 9 p.m. and closes the express line between 6 a.m. and 8 a.m. and 10 p.m. and
midnight. What is the revised capacity for Sundays?
Problem 3 Manufacturing Example
(Input capacity determination – number of resources needed)
A video equipment manufacturer produces videotapes and DVDs. The manufacturing facility operates
two eight-hour shifts per day for 6 days a week. The unit manufacturing time is 6 minutes for each
videotape and 8 minutes for each DVD.
a. Given that machine operators work at 80% efficiency, determine the number of workers needed
to produce 5000 videotapes and 2500 DVDs per week.
b. Given that machines have 95% efficiency, determine the number of machines needed to produce
5000 videotapes and 2500 DVDs per week.
c. Assume that the number of workers is sufficient, what is the maximum number of videotapes and
the maximum number of DVDs that can be manufactured with 15 machines.
d. Assume that the number of machines is sufficient, what is the maximum number of videotapes
and the maximum number of DVDs that can be manufactured with 20 workers.

Chapter 05 – Strategic Capacity Planning for Products and Services
5–23
Education.
Problem 4 Manufacturing Example with Multiple Products and Multiple Machines
(Input capacity determination – number of resources needed)
Among many other products, a firm manufactures three different electronic components (A, B, C) on any
of three different machines (1, 2, 3). The quarterly forecasted demand for the three components is given in
Table 1.
Table 1
Quarterly Forecasted Demand by Product Type
Season
Component
Winter
Spring
Summer
Fall
A
8,000
20,000
12,000
6,400
B
4,000
12,000
8,000
5,600
C
9,600
19,200
14,400
7,200
Table 2 displays the unit production time for each product on each machine.
Table 2
Unit Production Time (in hours)
Component
Machine
A
B
C
1
.25
.50
.40
2
.10
.30
.15
3
.45
.20
.35
Interpreting Table 2, we can state that each unit of product A takes 15 minutes (.25 x 60 min.) to process
on machine 1, while it takes 12 minutes (.20 x 60 minutes) to process one unit of product B on machine 3.
a. Determine the maximum number of machine hours demanded for each quarter machine
combination.
b. The production manager has determined that the amount of productive time available for each
machine per quarter is 600 hours. Determine the maximum number of each machine type needed
to be dedicated to produce all components in each quarter.
c. Does there appear to be seasonal variation in demand? Explain.
Chapter 05 – Strategic Capacity Planning for Products and Services
Solution to Problem 1 Manufacturing Example
(Output capacity determination and capacity-demand match)
a. The number of units/week = (375 units/hr.) (8 hrs/shift) (2 shifts/day) (6 days/week)
The number of units/week = 36,000 batteries
b.
Week
1
2
3
4
Forecasted
demand
30,000
32,000
38,000
40,000
Capacity
36,000
36,000
36,000
36,000
% of capacity
utilized
83.33%
88.89%
105.56%
111.11%
c. In determining the “Level” production plan, if the demand is less than or equal to the production
capacity, we simply determine the average demand for the four-week period and use the average
demand as our production quantity. However, if the average demand is above capacity, then we
can try either to expand capacity, to delay the order, or to reduce the quantity. Because in this
instance the average demand is less than capacity in each week, we can use the average demand
as our production quantity.
000,40000,38000,32000,30
Chapter 05 – Strategic Capacity Planning for Products and Services
5–25
Education.
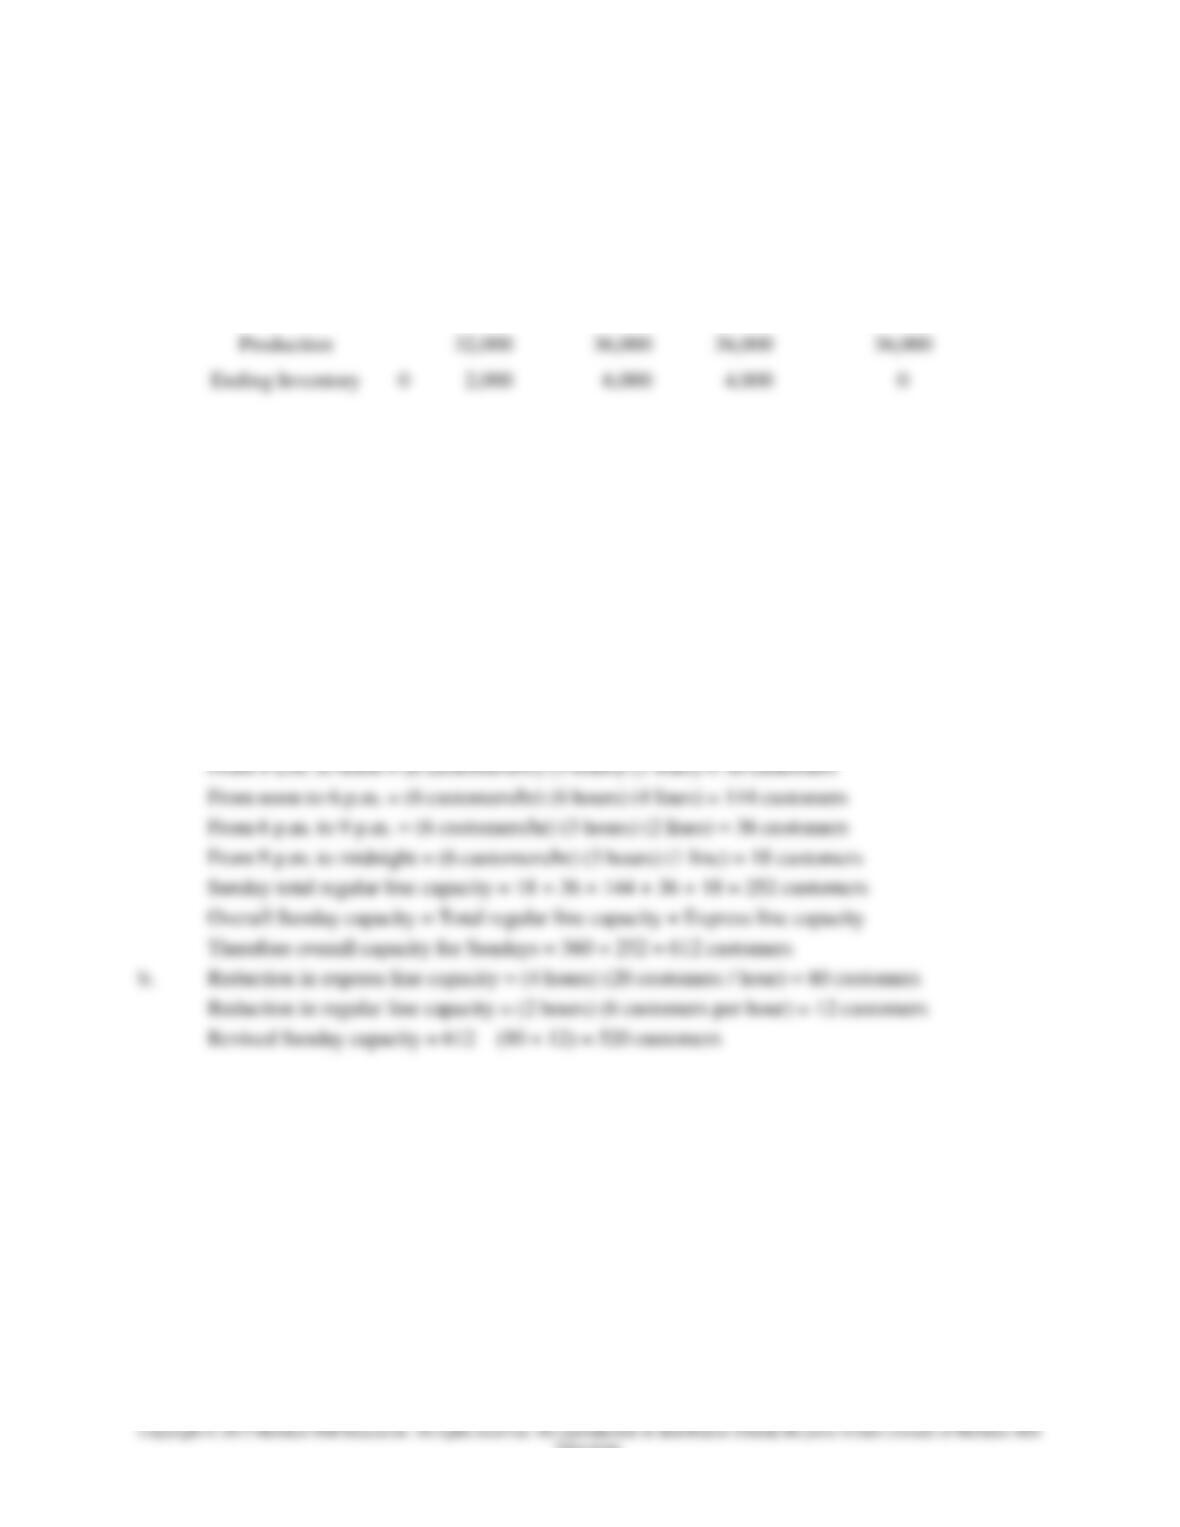
The “Chase” production plan and the resulting ending inventory for each week are given in the
following table.
Week
0
1
2
3
4
Forecasted demand
30,000
32,000
38,000
40,000
Capacity
36,000
36,000
36,000
36,000
Production
32,000
36,000
36,000
36,000
Ending Inventory
0
2,000
6,000
4,000
0
Average inventory = 12,000/4 = 3,000 units.
e. The “Chase” production plan results in fewer units in inventory, while the “Level” production
plan results in more uniform production, thus less hiring and layoff costs.
Solution to Problem 2 Service Example
(Output capacity determination)
a. Hourly capacity of the express line = (60 minutes) / (3 minutes per cust.) = 20 customers
Hourly capacity of the regular line = (60 minutes) / (10 minutes per cust.) = 6 customers
Capacity of the express line for Sundays = (20 customers) x (18 hours) = 360 customers
Capacity of the regular line:
From 6 a.m. to 9 a.m. = (6 customers/hr) (3 hours) (1 line) = 18 customers
Chapter 05 – Strategic Capacity Planning for Products and Services
Solution to Problem 3 Manufacturing Example
(Input capacity determination – number of resources needed)
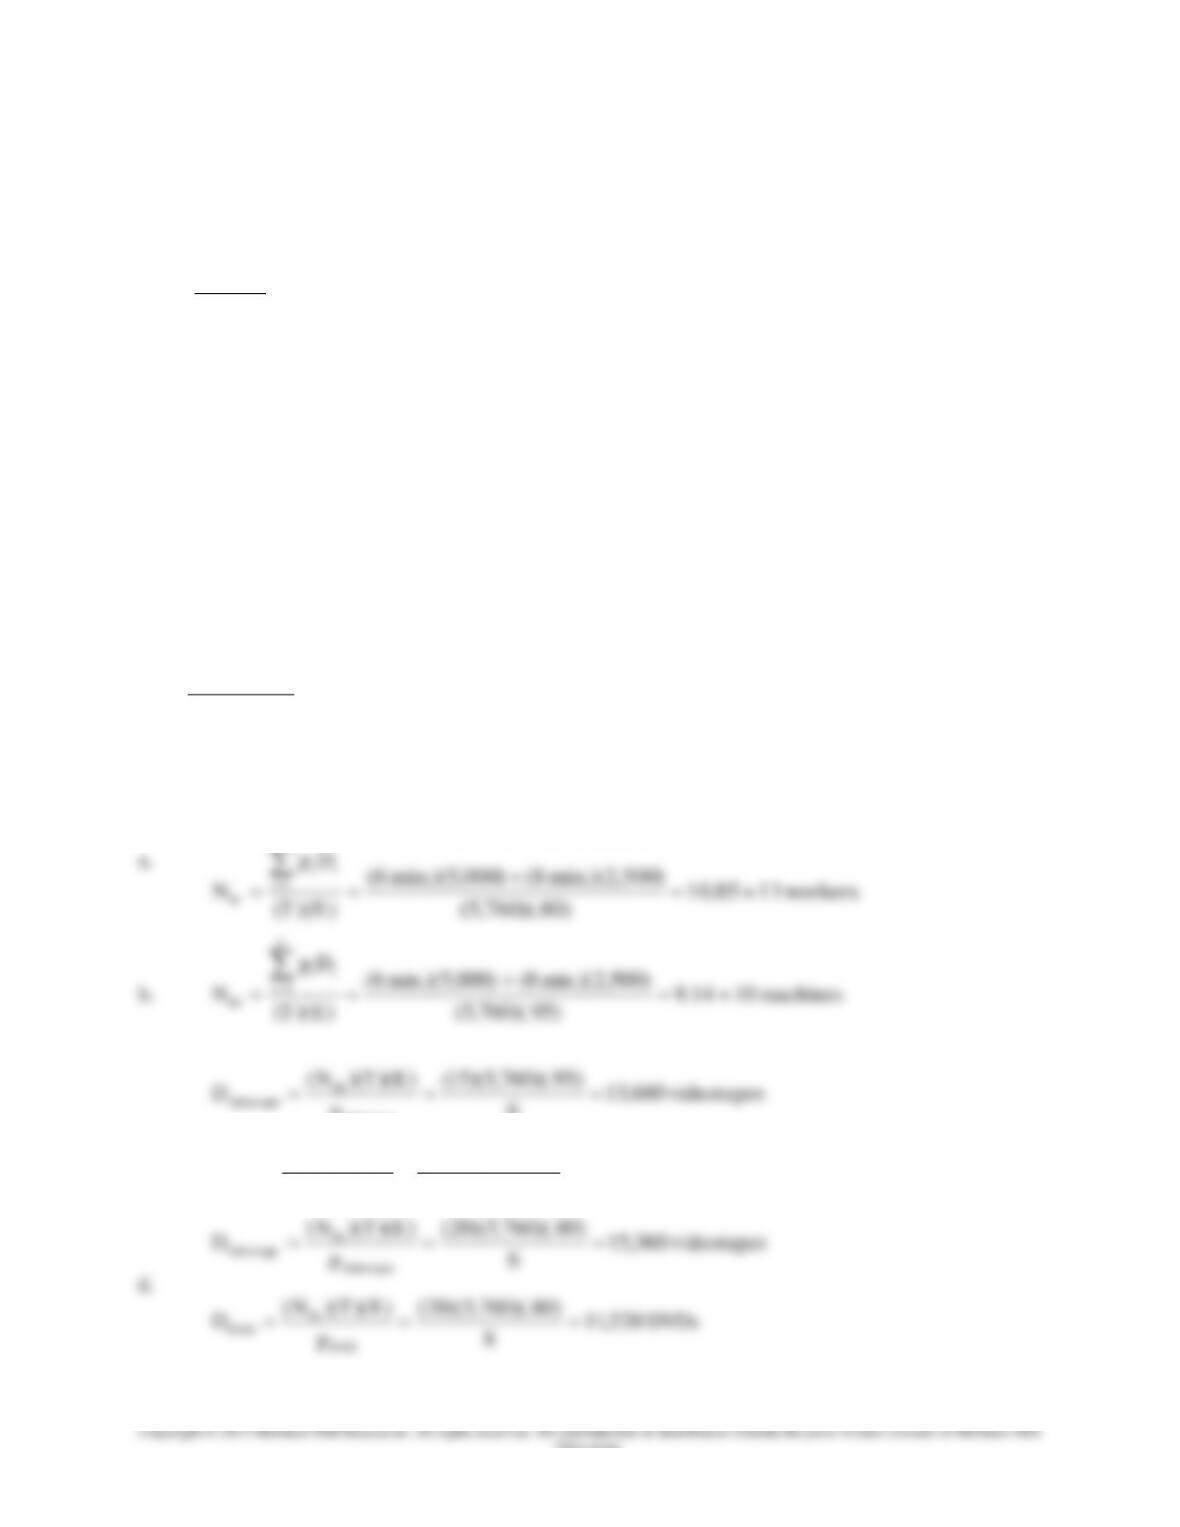
In general, we can express the equation for number of resources using the following notation:
))((
1
ET
Dp
N
k
i
ii
R
where:
NR = Number of resources (machines or workers) required
k = number of products produced
T = Total time available per resource per scheduled time period i
pi = Unit production time for product i
Di = Demand for product i for the scheduled time period
E = Efficiency of the resource measured as a percentage
Therefore, if we know the number of workers and want to determine the maximum demand that can be
satisfied for a given product, we can manipulate the formula given above and obtain the following
equation:
i
R
ip
ETN
D))()((
Given the above information, we can now solve Problem 3.
/.min 760,5.)/min. 60)(/. 8)( 6)( 2(
weekhrshifthrsdaysshiftsT
k

Chapter 05 – Strategic Capacity Planning for Products and Services
5–27
Education.
Solution to Problem 4 Manufacturing Example with Multiple Products and Multiple Machines
(Input capacity determination – number of resources needed)
a. First, we need to convert the demand to machine hours for each machine in each season.
The demand in the winter is 100, 50, and 120 for components A, B and C respectively and it takes
.25 hours, .5 hours, and .4 hours to process components A, B and C respectively on machine 1.
Therefore with this information, we can compute the maximum machine hours demanded for
machine 1 (M1) in the winter quarter.
Max. hrs. for M1 in Winter = (.25)(8000)+(.5)(4,000)+(.4)(9600) = 7,840 hrs.
Similarly the quarterly machine hours demanded can be calculated for the rest of the machine-
season combinations:
Max. hrs. for M3 in Winter = (.45)(8,000)+(.2)(4,000)+(.35)(9,600) = 7,760 hrs.
Max. hrs. for M3 in Spring = (.45)(20,000)+(.2)(12,000)+(.35)(19,200) = 18,120 hrs.
Max. hrs. for M3 in Summer = (.45)(12,000)+(.2)(8,000)+(.35)(14,400) = 12,040 hrs.
Max. hrs. for M3 in Fall = (.45)(6,400)+(.2)(5,600)+(.35)(7,200) = 6,520 hrs.
Chapter 05 – Strategic Capacity Planning for Products and Services
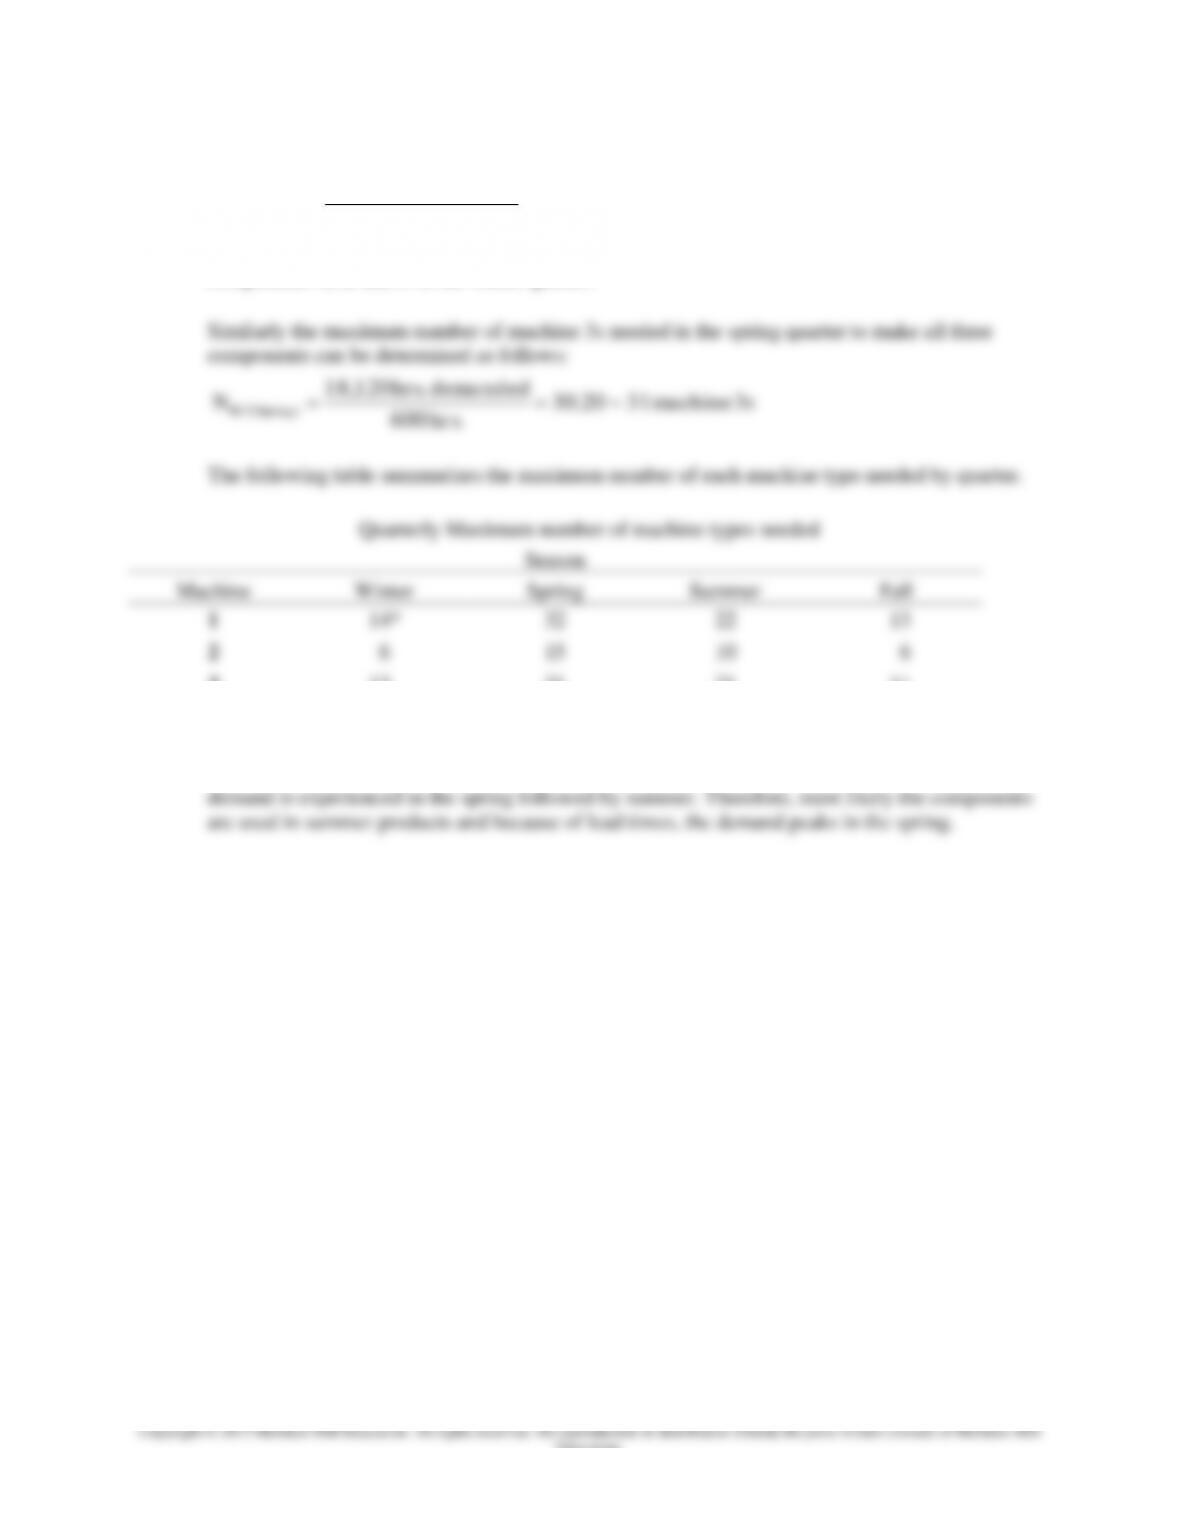
b. Because (T) (E) = 600 productive hours per quarter,
smachine
hrs
demandedhrs
NM1 14~07.13
. 600
. 840,7
)Winter(1
Therefore we can conclude that at most we need to allocate 14 machine 1s to produce
components A, B and C in the winter quarter.