Unlock document.
This document is partially blurred.
Unlock all pages and 1 million more documents.
Get Access
Chapter 05 - Strategic Capacity Planning for Products and Services
5-1
Education.
CHAPTER 05
STRATEGIC CAPACITY PLANNING FOR PRODUCTS AND
SERVICES
Teaching Notes
Capacity is an upper bound on the load that a facility or a plant can serve or manufacture. We measure the
capacity of a plant, machine department, worker, hospital, etc., in terms of output (number of units or
number of pounds manufactured) or in terms of input (number of machine hours or machines needed to
satisfy demand).
Capacity planning refers to the activities of the firm in determining the capacity of a plant or a facility in
terms of equipment, machines, space, workers, and processes based on the resource constraints of the
facility. In other words, a major function of capacity planning is to match the capacity of the machine or
facility with the demand for the products of the firm.
Capacity planning can be classified into three planning horizons:
1. Long-range
2. Medium-range
3. Short-range
The amount of time covered by each of the above planning horizons can vary from industry to industry.
Therefore, the lines of demarcation between the three different levels of planning horizons can be very
imprecise. Nevertheless, the long-range planning generally considers planning horizons of one year or
longer. A time period of one year or longer is needed to provide sufficient time to build a new facility, to
expand the existing facility, or to move to a new facility due to forecasted changes in demand.
The medium-range capacity-planning horizon ranges approximately from one month to six months. At
this level of planning, decisions or activities include acquisition of a major piece of machinery and
subcontracting.
The short-range planning horizon covers capacity-planning activities on a daily or a weekly basis and is
generated as a result of disaggregation of the long- or medium-range capacity plans. These activities
include machine loading and detailed production scheduling.
The main quantitative technique covered is cost-volume analysis. It may be skipped or may need only
light review if students have had it in another course.
Reading: My Compliments to the Chef, er, Buyer
1. The “hours” part of the phrase refers to the original, long time for restaurants to cook some menu
2. The advantages to restaurants from outsourcing include labor costs savings (less time spent cooking
items), faster service, and the ability to offer a wider variety of menu items.
3. Some disadvantages of outsourcing include the possibility that the chef might lose his/her cooking
skills, potential quality issues, and potential stockouts if problems occur at suppliers.
4. Student answers will vary. One possible answer is that restaurant outsourcing is dishonest and
5. Restaurant outsourcing does increase capacity because outsourcing allows a restaurant to serve more
meals per hour.
Chapter 05 - Strategic Capacity Planning for Products and Services
Answers to Discussion and Review Questions
1. Design capacity is the maximum possible output. Effective capacity is the maximum output given
product mix, scheduling realities, machine maintenance requirements, and so on.
2. Student answers will vary. The factors that may inhibit capacity utilization are all factors that impact
effective capacity such as the factors listed in Table 5.2.
3. Long-term considerations are related to the overall level of capacity, while short-term considerations
are related to variations in capacity requirements caused by seasonality, randomness, etc.
4. a. Annual seasonality in demand for campgrounds, Christmas trees, Mother’s Day cards, snow skis,
lawn and garden equipment, and snow tires.
b. Monthly seasonal patterns are often created by welfare and social security checks being sent out
5. Examples of building flexibility into system design include buying more land than is currently
6. This amounts to a systems approach: the different parts of the system are interrelated, so unless the
entire system is considered, it is likely that the overall system capacity will suffer. One example of
7. Capacity in “chunks” refers to the large stepwise increases that are frequently encountered in capacity
8. Many schools are attempting to “scale-down” capacity due to the decrease in school-age children.
9. Failure to take all aspects of a system into account can result in uneven capacity, which is evidenced
10. Capacity designs establish constraints within which operations must function. They offer an
11. It is the most efficient position. If a producer should choose some other combination, such as an
assembly line for a customized product or service, he or she would find that the highly customized
requirements of the various products were in direct conflict with the more uniform requirements
needed to effectively operate in the assembly-line mode. Matching process capabilities with product
5-3
Copyright © 2015 McGraw-Hill Education. All rights reserved. No reproduction or distribution without the prior written consent of McGraw-Hill
Education.
12. Uncertainty could have an effect on demand, which in turn would have an effect on volume or desired
13. Capacity planning for deciding the number of police officers or fire trucks is somewhat different from
capacity planning for manufacturing or other types of service operations. In the above, the service
14. The long-term strategic implications of capacity planning can be enormous. If we do not obtain the
necessary capacity when we need to, our firm could be at a significant disadvantage. On the other
15. a. The need to be near customers, b. inability to store services, and c. volatility of demand.
16. a. University capacity measures include: The number and sizes of classrooms, the size and number
of labs, equipment capacities, the number of faculty members by area of specialization, the
number of staff people, the number of offices, the number of parking spaces, library space and the
size of library collections, the number of seats in the cafeteria, the amount of recreational
17. Having capacity measures enables a business organization to know its capabilities and, when
combined with forecasts of future demand, use that knowledge to assess how capacity does or does
Chapter 05 - Strategic Capacity Planning for Products and Services
Taking Stock
1. The major trade-off in capacity planning is having too much capacity vs. not having sufficient
2. Some of the employees who are involved in forecasting should also be involved in capacity planning.
3. Automation and computer operated machinery have revolutionized the manufacturing and service
industries. However, these machines and equipment are very expensive. Therefore, the consequences
of making a mistake (buying the machinery when we should not have) could be very costly for the
firm. On the other hand, these machines tend to be powerful and produce large number of quantities
of a given product. Therefore, if we do not purchase the machinery and the demand turns out to be
high, then our losses due to lost sales or backorders would be larger than usual.
Critical Thinking Exercises
1.
%88.96%100
64
62
capacity Effective
output Actual xEfficiency
62
output Actual xnUtilizatio
Chapter 05 - Strategic Capacity Planning for Products and Services
Solutions
1. a.
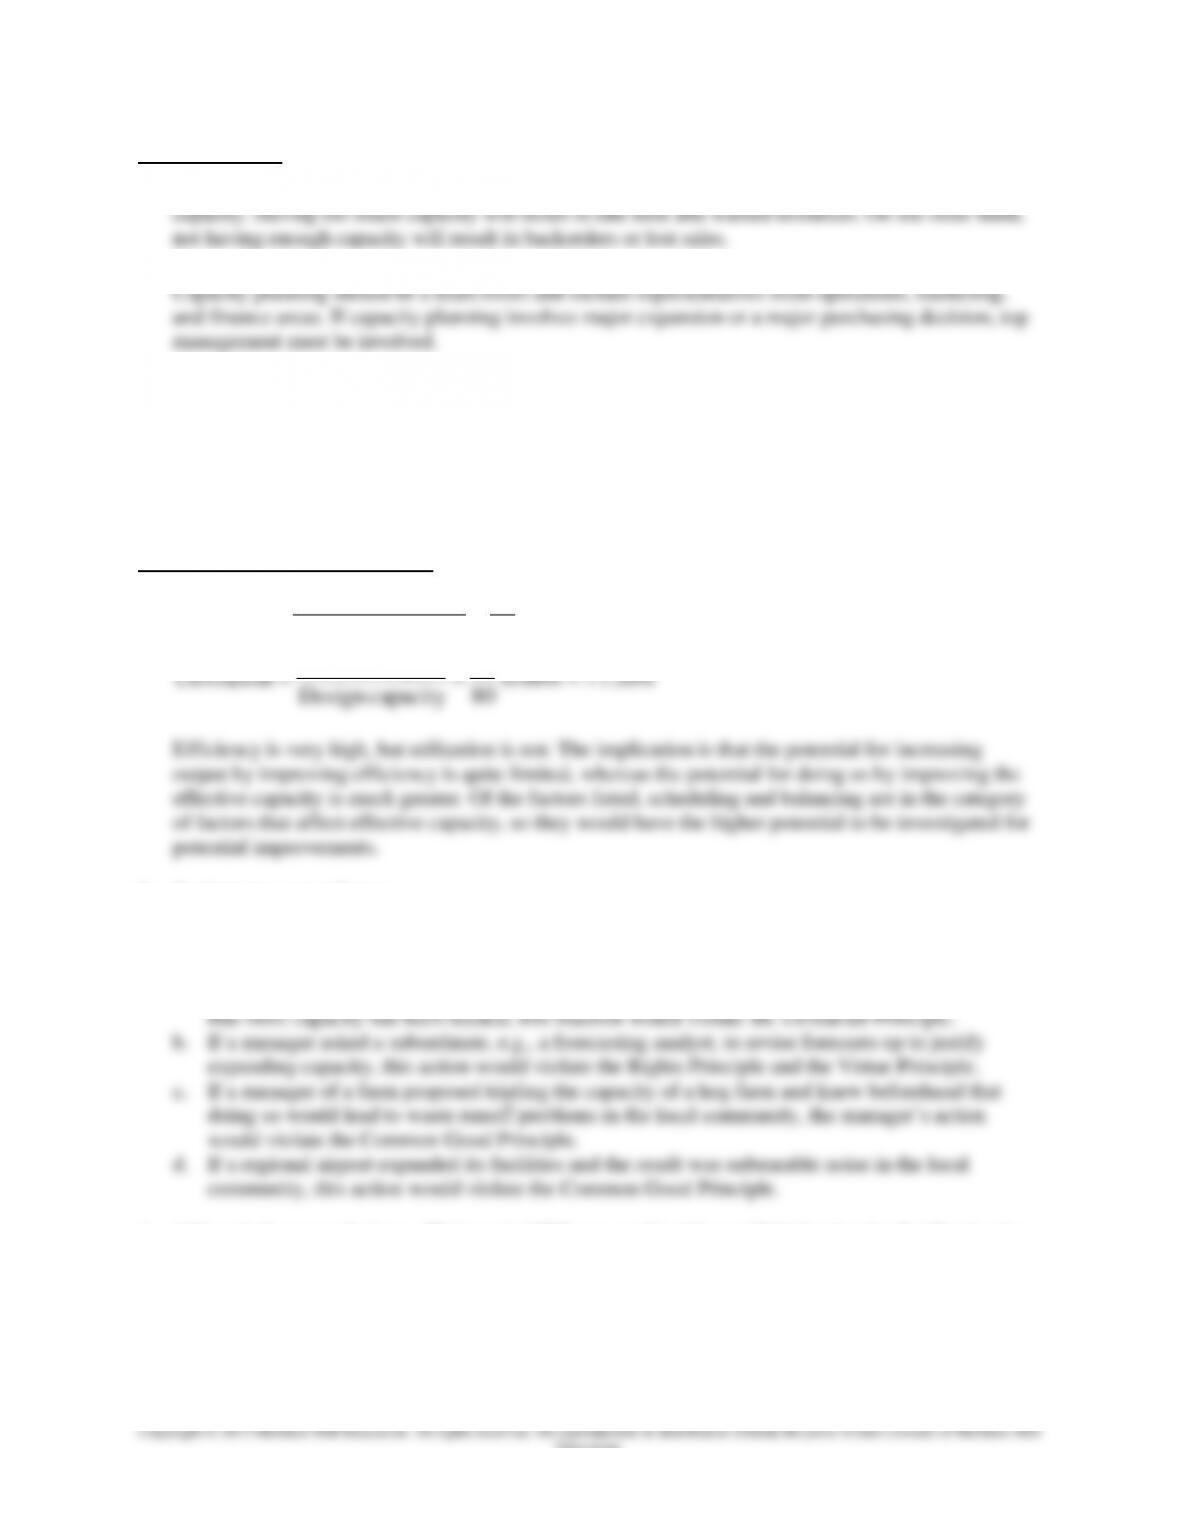
%00.70%100
10
7
capacityDesign
output Actual xnUtilizatio
7
output Actual xEfficiency
Chapter 05 - Strategic Capacity Planning for Products and Services
3. Given:
FC = $9,200/month
v = $ .70/unit
R = $ .90/unit
a.
units
v
FC
QBEP 000,46
70$.90$.
200,9$
R
unitunitv
/70$./90$.
R
d. Total Revenue = R x Q, so Q =
units
unitR 56.555,25
/90$.
000,23$Revenue Total
e.
1.
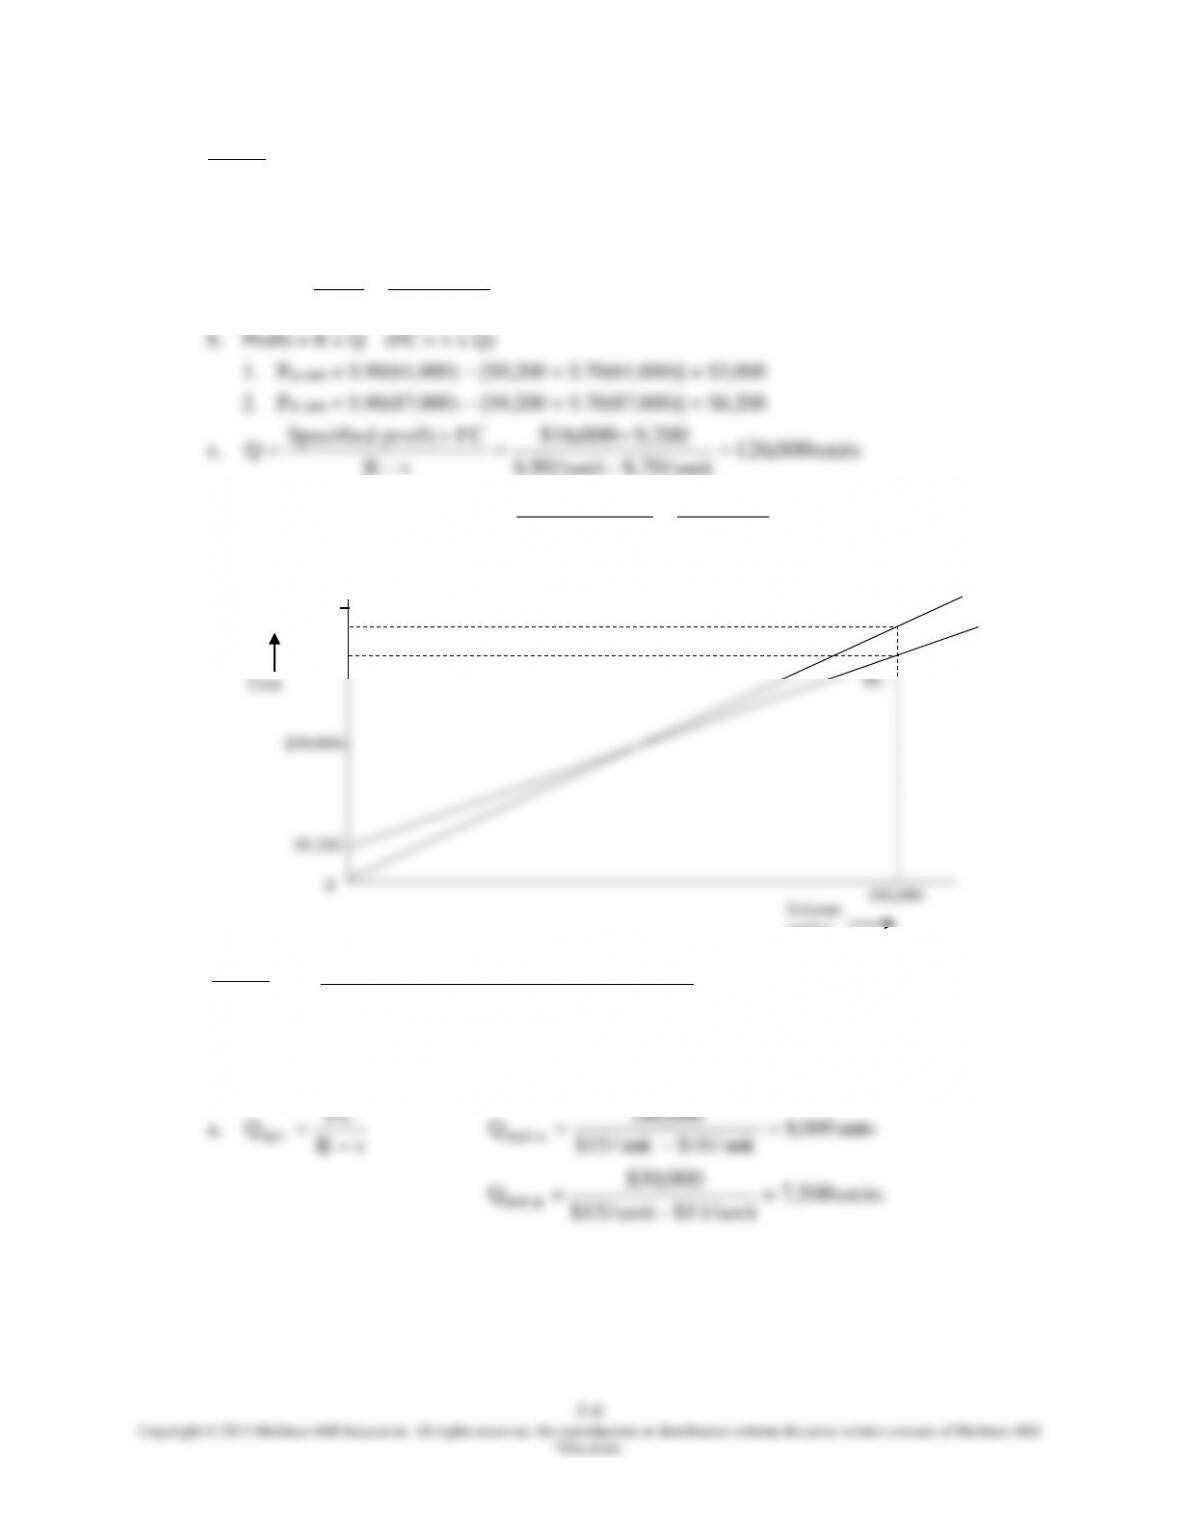
4. Given:
FC
R
v
A:
$40,000
$15/unit
$10/unit
B:
$30,000
$15/unit
$11/unit
FC
000,40$
0
Volume
(units)
TR = $90,000 @ Q = 100,000 units
TC = $79,200 @ Q = 100,000 units
TR
TC
100,000
$100,000
$50,000
$9,200
Cost
Chapter 05 - Strategic Capacity Planning for Products and Services
5-7
Education.
b. Profit = Q(R – v) – FC
[A’s Profit] [B’s Profit]
Q($15 – $10) – $40,000 = Q($15 – $11) – $30,000
c. PA = 12,000($15 – $10) – $40,000 = $20,000 [A is higher]
5. Given:
Demand = 30,000 = Q
FC = $25,000
v = $.37/pen
a. Given: R = $1.00/pen
units
v
FC
QBEP 54.682,39
37$.00.1$
000,25$
R
b. Given: Demand = 30,000 units. Specified profit = $15,000
000,25$000,15$
FCprofitSpecified
37$.R
By substitution:
37$.R
000,40$
000,30
30,000 x (R - $.37) = $40,000
30,000R - $11,100 = $40,000
Chapter 05 - Strategic Capacity Planning for Products and Services
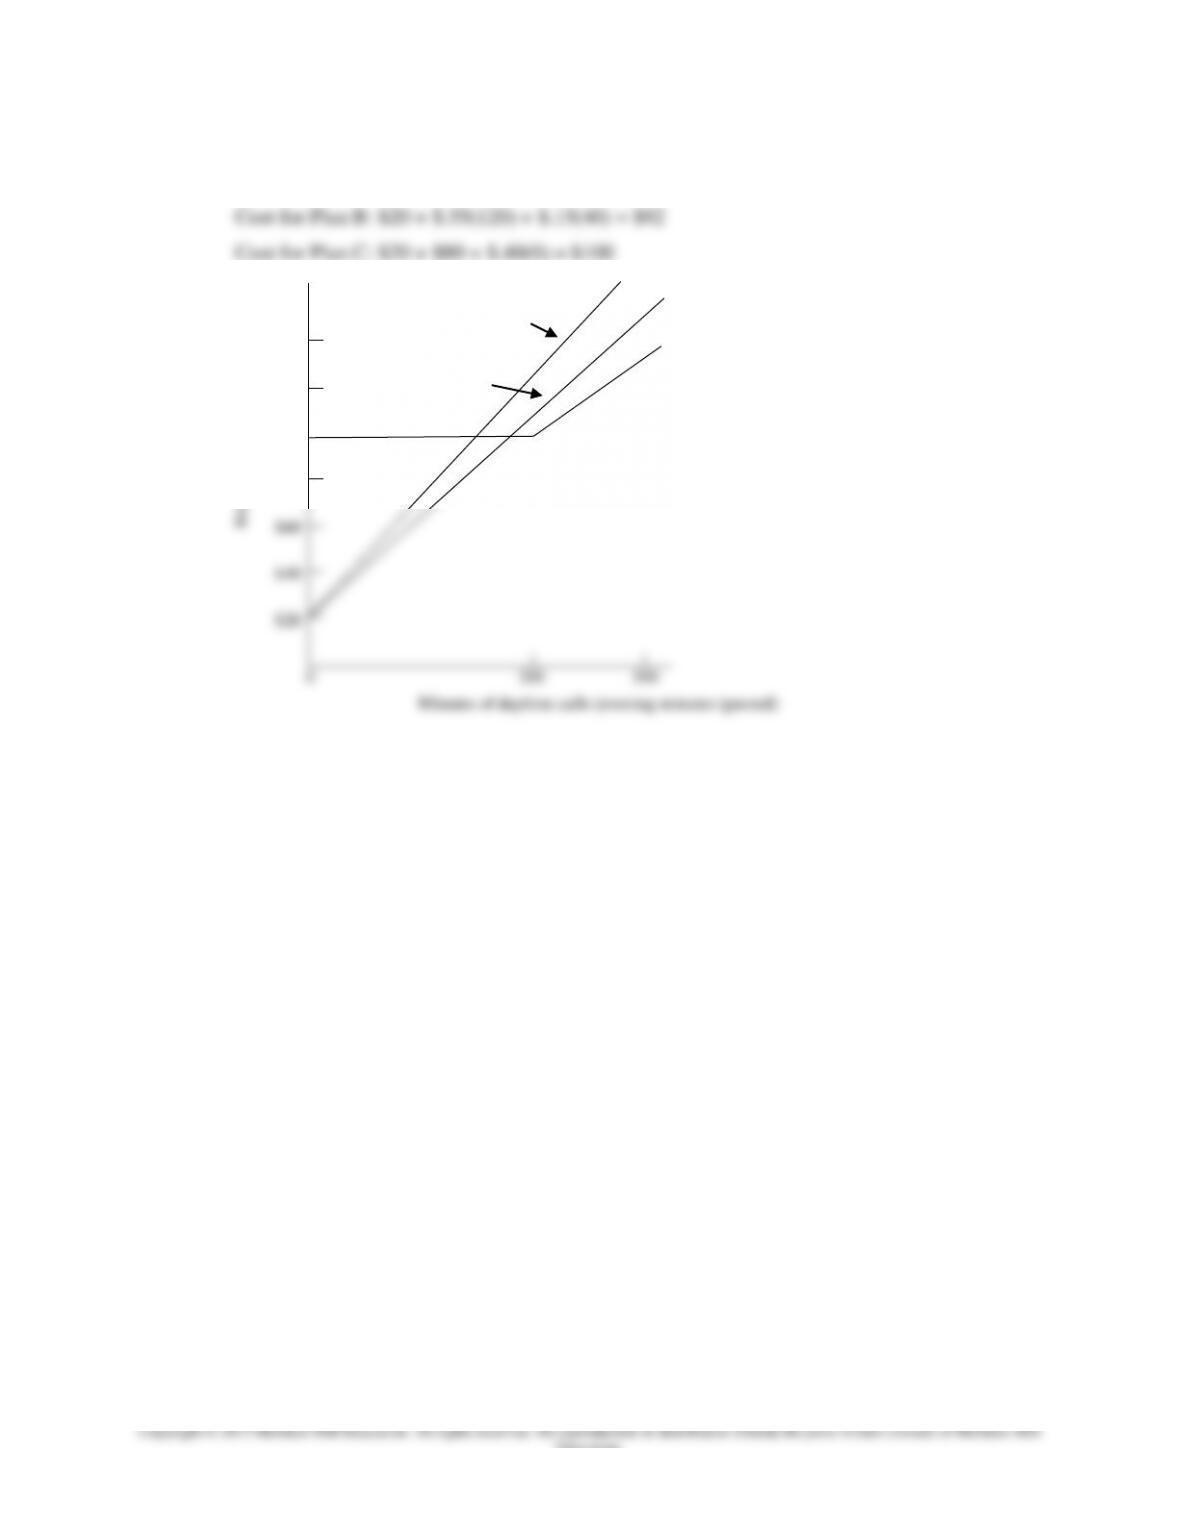
6.
a.
Cost for Plan A: $20 + $.45(120) + $.20(40) = $82
Cost for Plan B: $20 + $.55(120) + $.15(40) = $92
Cost for Plan C: $20 + $80 + $.40(0) = $100
b.
Minutes of daytime calls (evening minutes ignored)
$140
$120
$100
$80
$60
$40
$20
0 200 300
Monthly cost
Plan C
Plan B
Plan A
Chapter 05 - Strategic Capacity Planning for Products and Services
c.
Considering only daytime cost functions:
Plan A = $20 + $.45D
Plan B = $20 + $.55D
Plan C (up to 200 minutes) = $20 + $80 = $100
Plan C (over 200 minutes) = $20 + $80 + $.40 (D - 200)
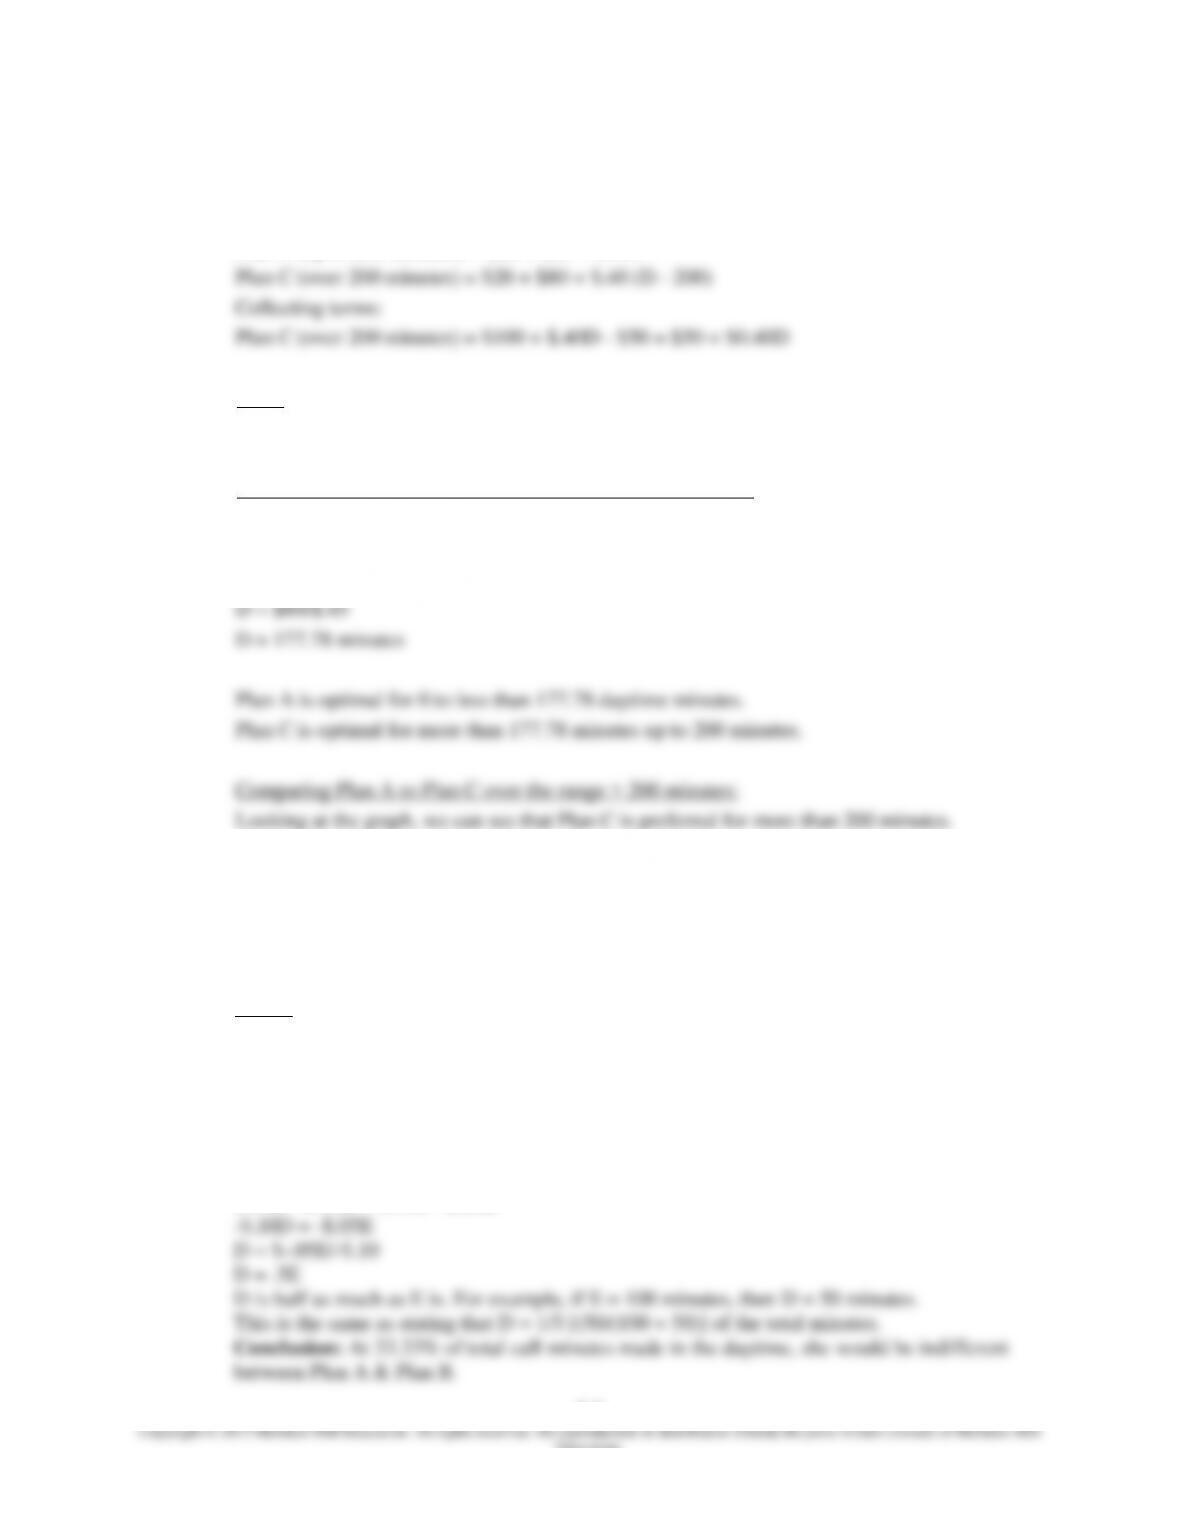
Collecting terms:
Plan C (over 200 minutes) = $100 + $.40D - $50 = $50 + $0.40D
Note: We can see that Plan A dominates Plan B over all volumes; therefore, we
can omit Plan B from our analysis.
Comparing Plan A to Plan C over the range 1 – 200 minutes:
Determine the indifference point between Plan A & Plan C:
$20 + $.45D = $100
$.45D = $80
D = $80/$.45
D = 177.78 minutes
Plan A is optimal for 0 to less than 177.78 daytime minutes.
Plan C is optimal for more than 177.78 minutes up to 200 minutes.
Comparing Plan A to Plan C over the range > 200 minutes:
Conclusion: Plan A is preferred from 0 to less than 177.78 daytime minutes.
Plan C is preferred for more than 177.78 daytime minutes.
We are indifferent between the two plans at 177.78 daytime minutes.
d. Given:
Plan A Cost for Daytime & Evening Minutes: $20 + $.45D + $.20E
Plan B Cost for Daytime & Evening Minutes: $20 + $.55D + $.15E
Setting these equal and solving for D:
Chapter 05 - Strategic Capacity Planning for Products and Services
7.
Given:
Source
FC
v
TC
Process A
$160,000
$5
160,000 + 5Q
Process B
190,000
4
190,000 + 4Q
Vendor
7
7Q
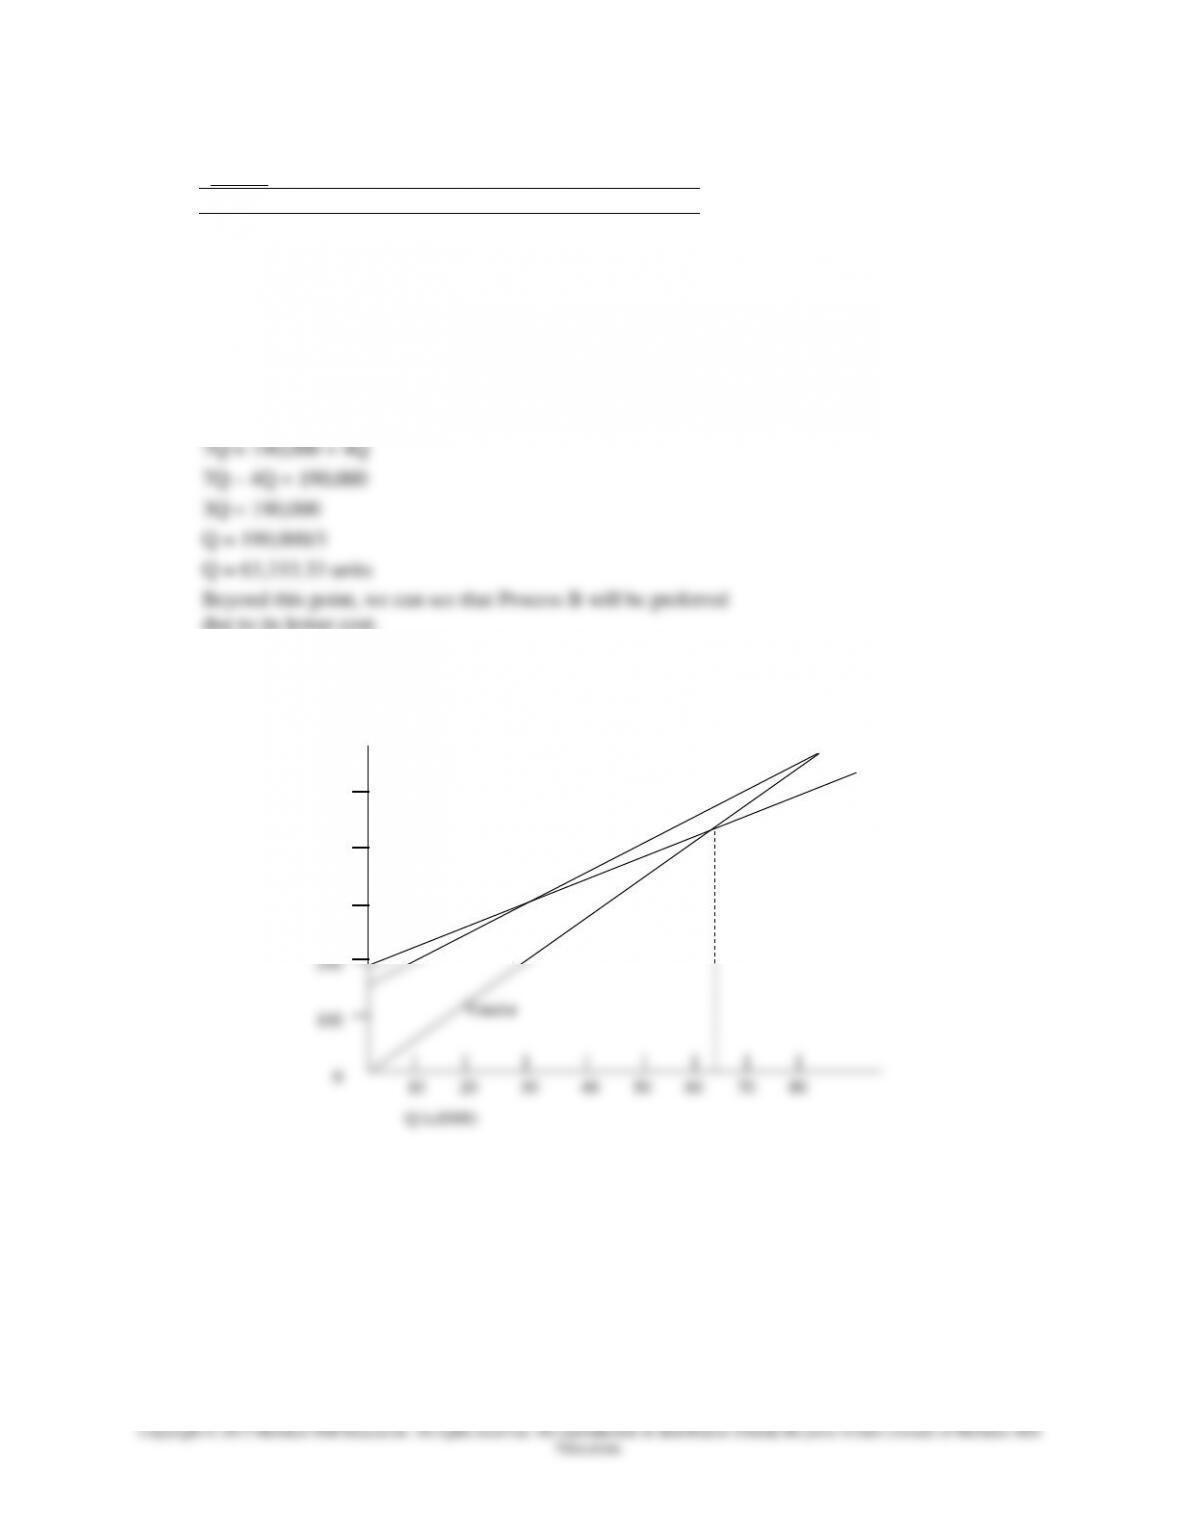
We can begin by graphing the three total cost functions as
shown below. We can see the Vendor costs less until its
function intersects with that of Process B.
Find the indifference point between the Vendor & Process B:
7Q = 190,000 + 4Q
7Q – 4Q = 190,000
3Q = 190,000
Q = 190,000/3
Q = 63,333.33 units
Beyond this point, we can see that Process B will be preferred
due to its lower cost.
The Vendor is preferred between 1 to less than 63,333.33 units.
Process B is preferred for more than 63,333.33 units.
500
400
300
200
100
0
10 20 30 40 50 60 70 80
Q (x1000)
Cost ($000)
A
B
Vendor


