Chapter 03 – Forecasting
3–31
Education.
c.
2222 )()()()(
))(()(
yynxxn
yxxyn
r
)076,1)(366()329,,31)(13(
independent variable.
d. y = 66.44 + 0.58 (41) = 90.22 (round to two decimals)
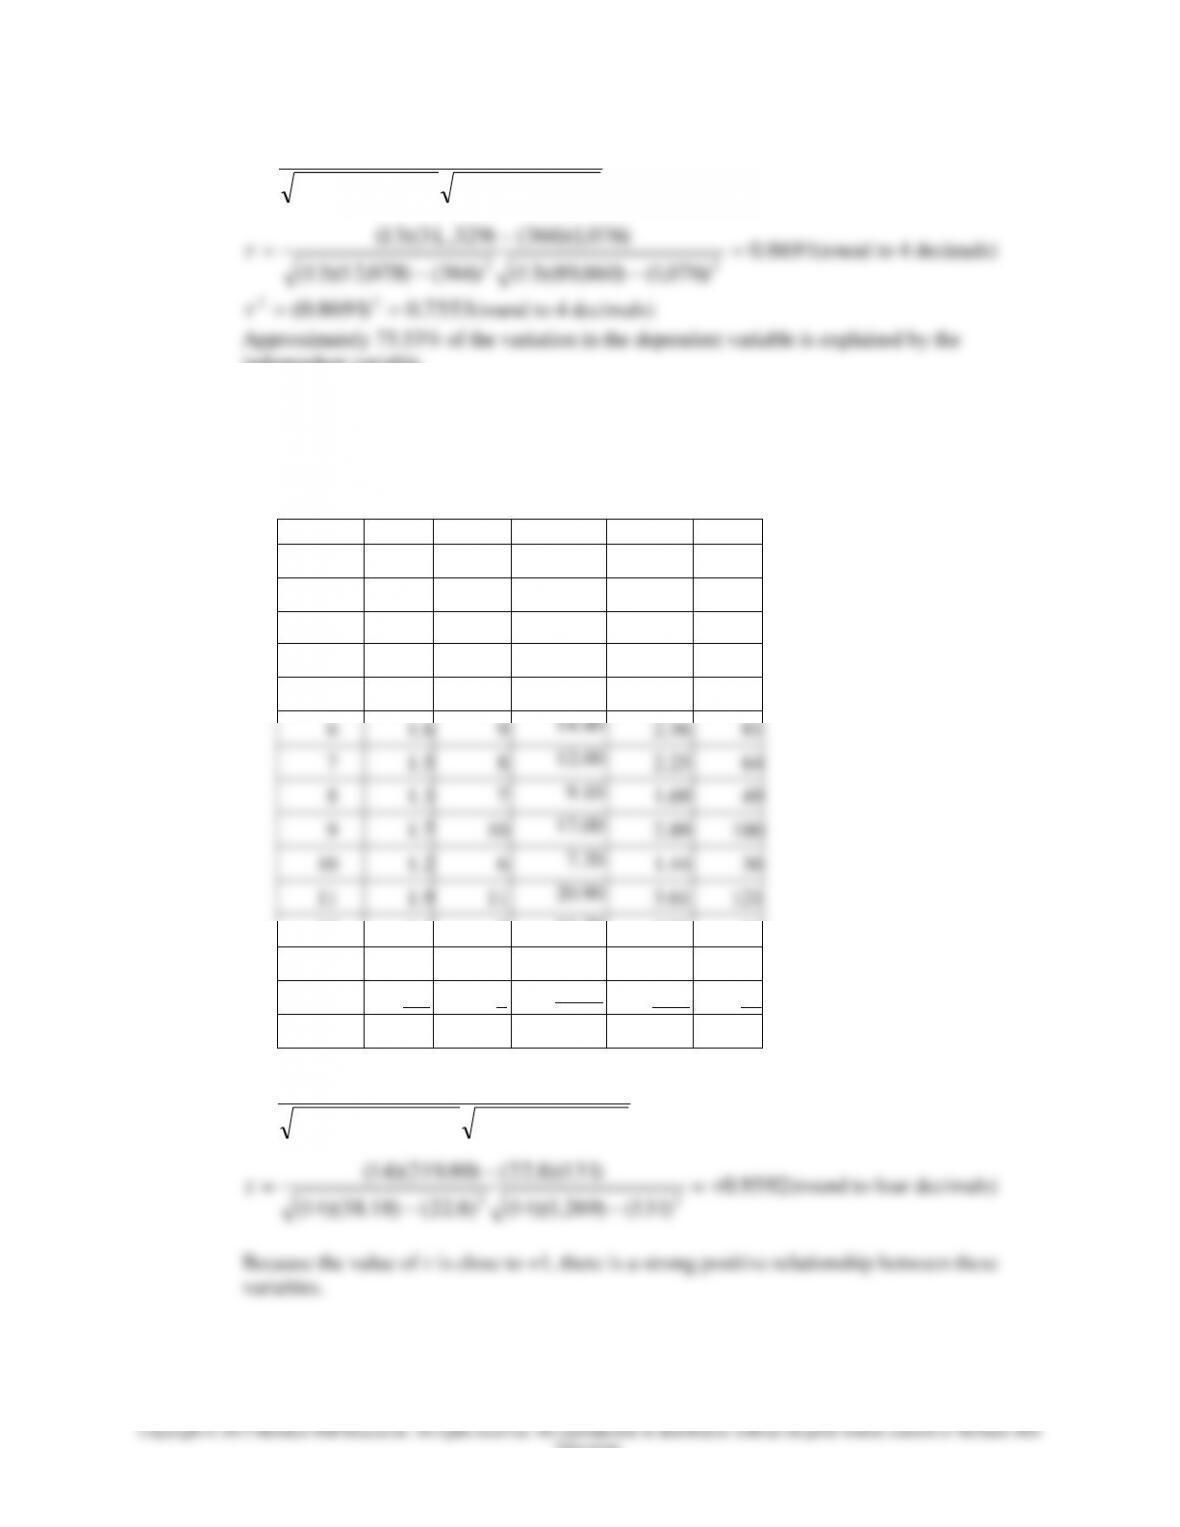
27. a. & b.
Period
X
Y
X * Y
X2
Y2
1
1.6
10
16.00
2.56
100
2
1.3
8
10.40
1.69
64
3
1.8
11
19.80
3.24
121
4
2.0
12
24.00
4.00
144
5
2.2
12
26.40
4.84
144
6
1.6
9
14.40
2.56
81
7
1.5
8
12.00
2.25
64
8
1.3
7
9.10
1.69
49
9
1.7
10
17.00
2.89
100
10
1.2
6
7.20
1.44
36
11
1.9
11
20.90
3.61
121
12
1.4
8
11.20
1.96
64
13
1.7
10
17.00
2.89
100
14
1.6
9
14.40
2.56
81
22.8
131
219.80
38.18
1,269
2222 )()()()(
))(()(
iiii
iiii
YYnXXn
YXYXn
r
9592.0
)131()269,1)(14()8.22()18.38)(14(
)131)(8.22()80.219)(14(
22
r
(round to four decimals)
Because the value of r is close to +1, there is a strong positive relationship between these
variables.
Chapter 03 – Forecasting
Round b & a to two decimals:
16.6
)8.22()18.38)(14(
)131)(8.22()80.219)(14(
)( 222
xxn
yxxyn
b
Chapter 03 – Forecasting
3–33
Education.
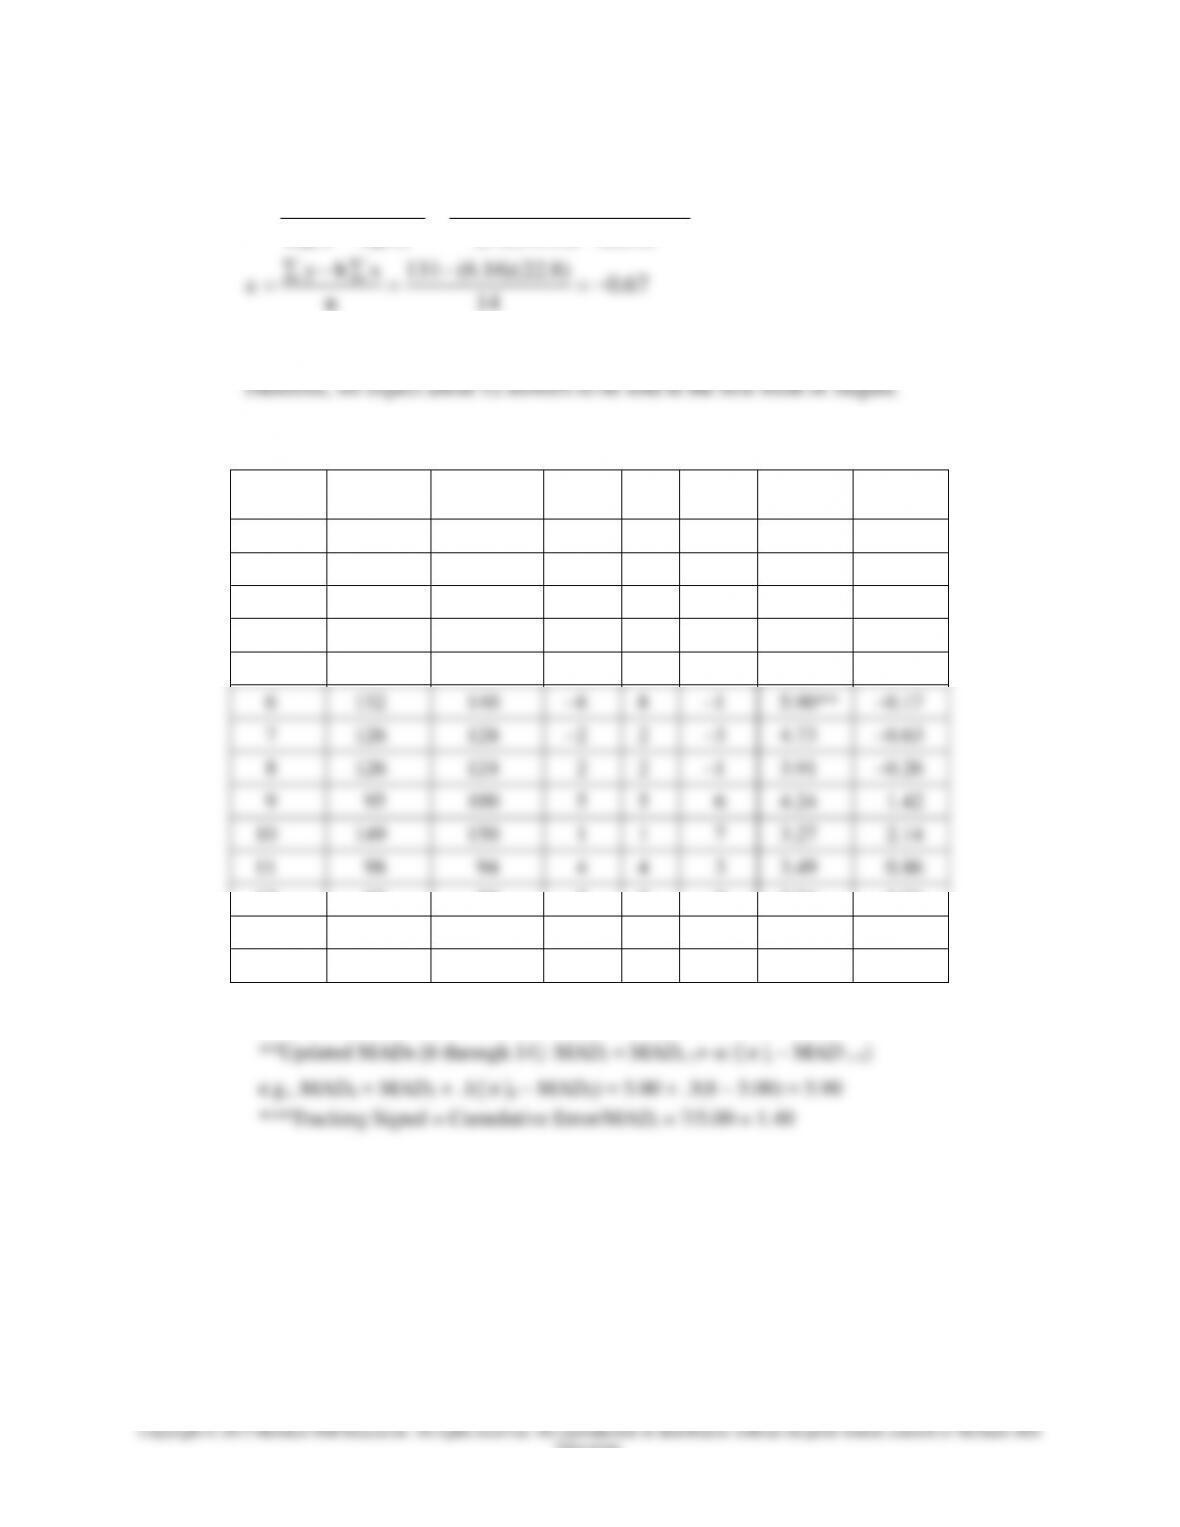
29. Refer to data in Problem 22 (shown below).
Period
Demand
F1
e
e
e2
(e/Demand)
x 100 (%)
F2
e
e
e2
(e/Demand)
x 100 (%)
1
770
771
-1
1
1
0.13%
769
1
1
1
0.13%
2
789
785
4
4
16
0.51%
787
2
2
4
0.25%
3
794
790
4
4
16
0.50%
792
2
2
4
0.25%
4
780
784
-4
4
16
0.51%
798
-18
18
324
2.31%
5
768
770
-2
2
4
0.26%
774
-6
6
36
0.78%
6
772
768
4
4
16
0.52%
770
2
2
4
0.26%
7
760
761
-1
1
1
0.13%
759
1
1
1
0.13%
8
775
771
4
4
16
0.52%
775
0
0
0
0.00%
9
786
784
2
2
4
0.25%
788
-2
2
4
0.25%
10
790
788
2
2
4
0.25%
788
2
2
4
0.25%
Sum
12
28
94
3.58%
-16
36
382
4.61%
MAD F1: 28/10 = 2.80
MAD F2: 36/10 = 3.60
4
0
-4
-5
-4
-3
-2
-1
0
1
2
3
4
5
5 6 7 8 9 10 11 12 13 14
Tracking Signal Data
TS
Chapter 03 – Forecasting
a. Tracking signal using cumulative error for months 1 to 10:
F1: 12/2.80 = +4.29
F2: -16/3.60 = –4.44
Both are slightly beyond the limits of ± 4.
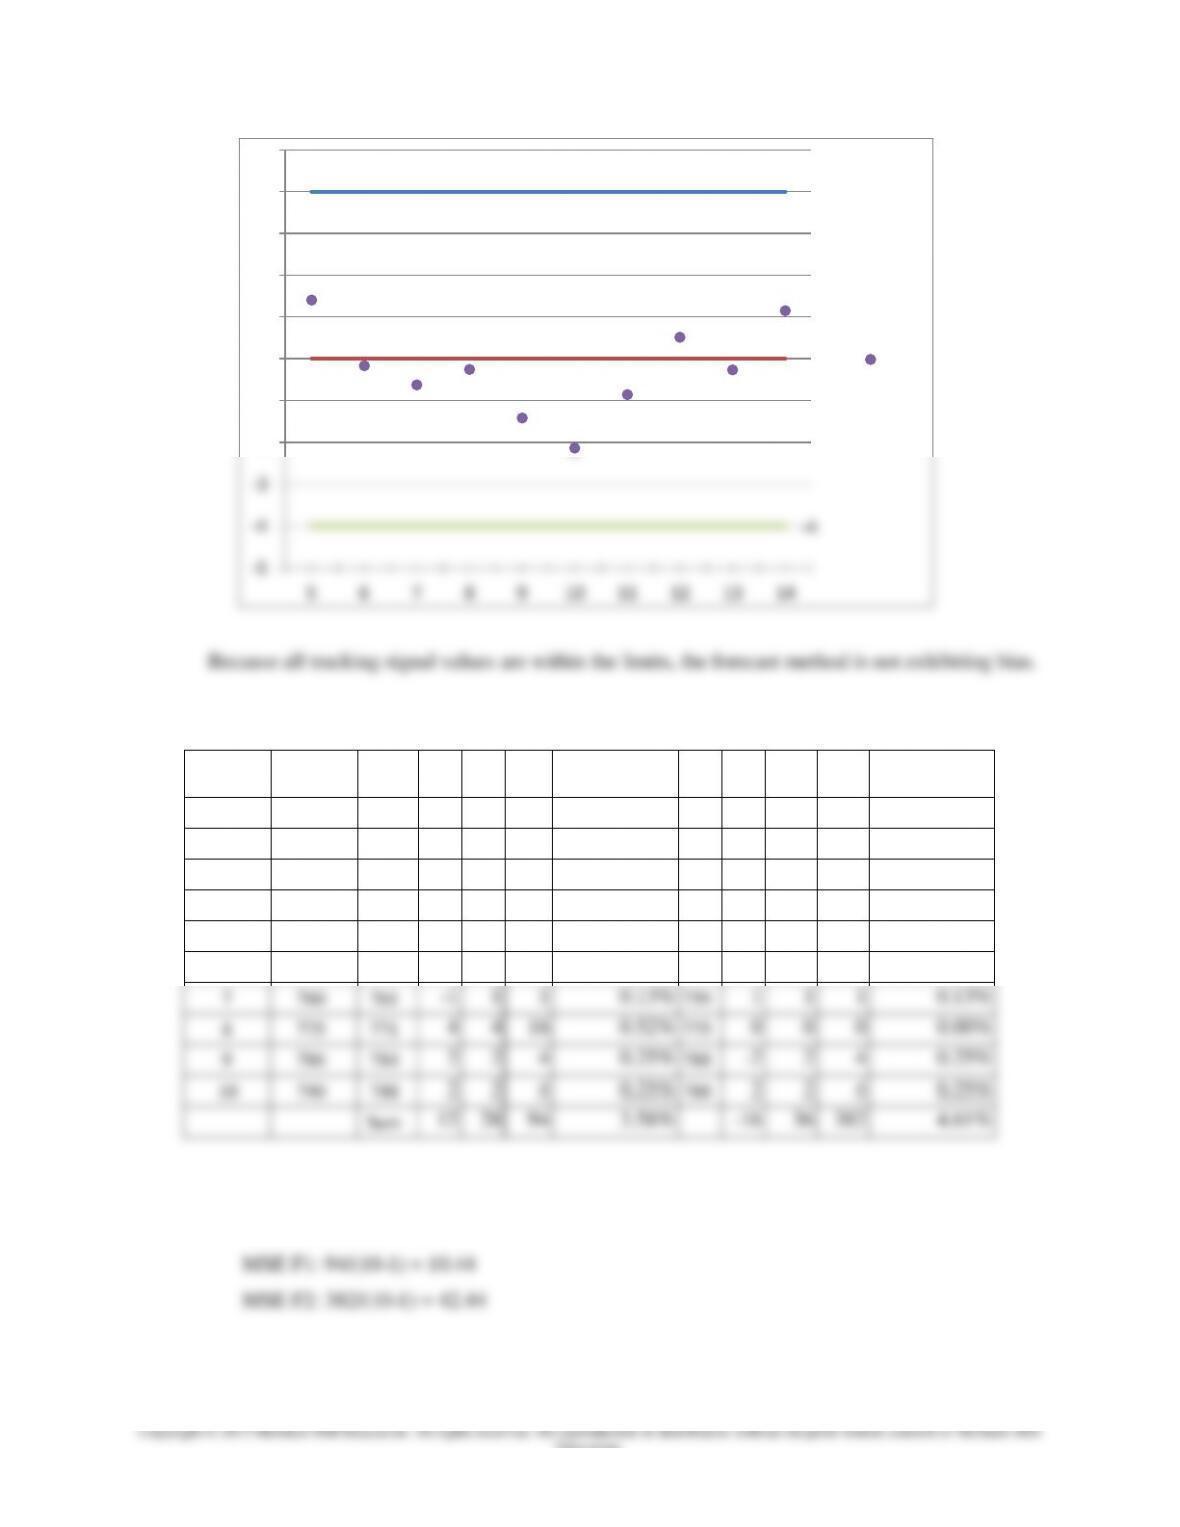
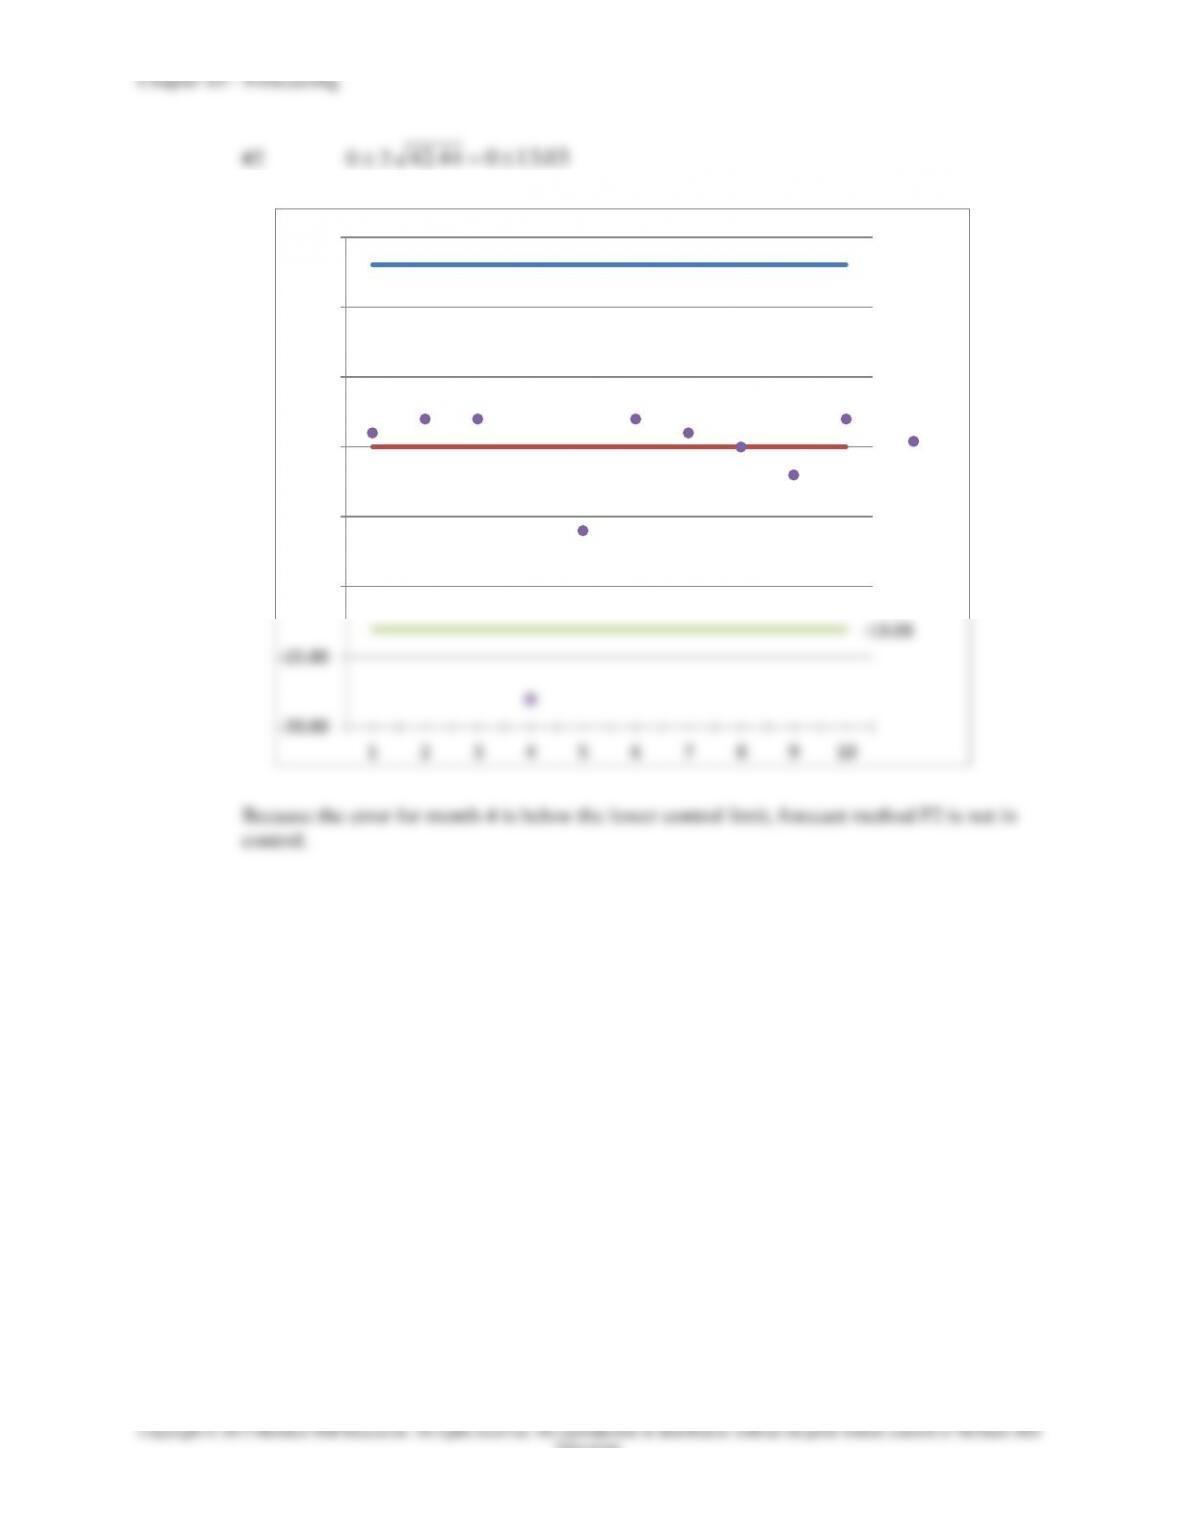
b. Compute 2s limits for errors of each forecast method (round to two decimals).
Control limits are 0 2
MSE
:
Because all errors are within these limits, forecast method F1 is in control.
6.46
0.00
-6.46
-8.00
-6.00
-4.00
-2.00
0.00
2.00
4.00
6.00
8.00
1 2 3 4 5 6 7 8 9 10
F1: 2sLimits for Errors
e
Education.
13.03
0.00
-13.03
-20.00
-15.00
-10.00
-5.00
0.00
5.00
10.00
15.00
1 2 3 4 5 6 7 8 9 10
F2: 2sLimits for Errors
e
3–36
Education.
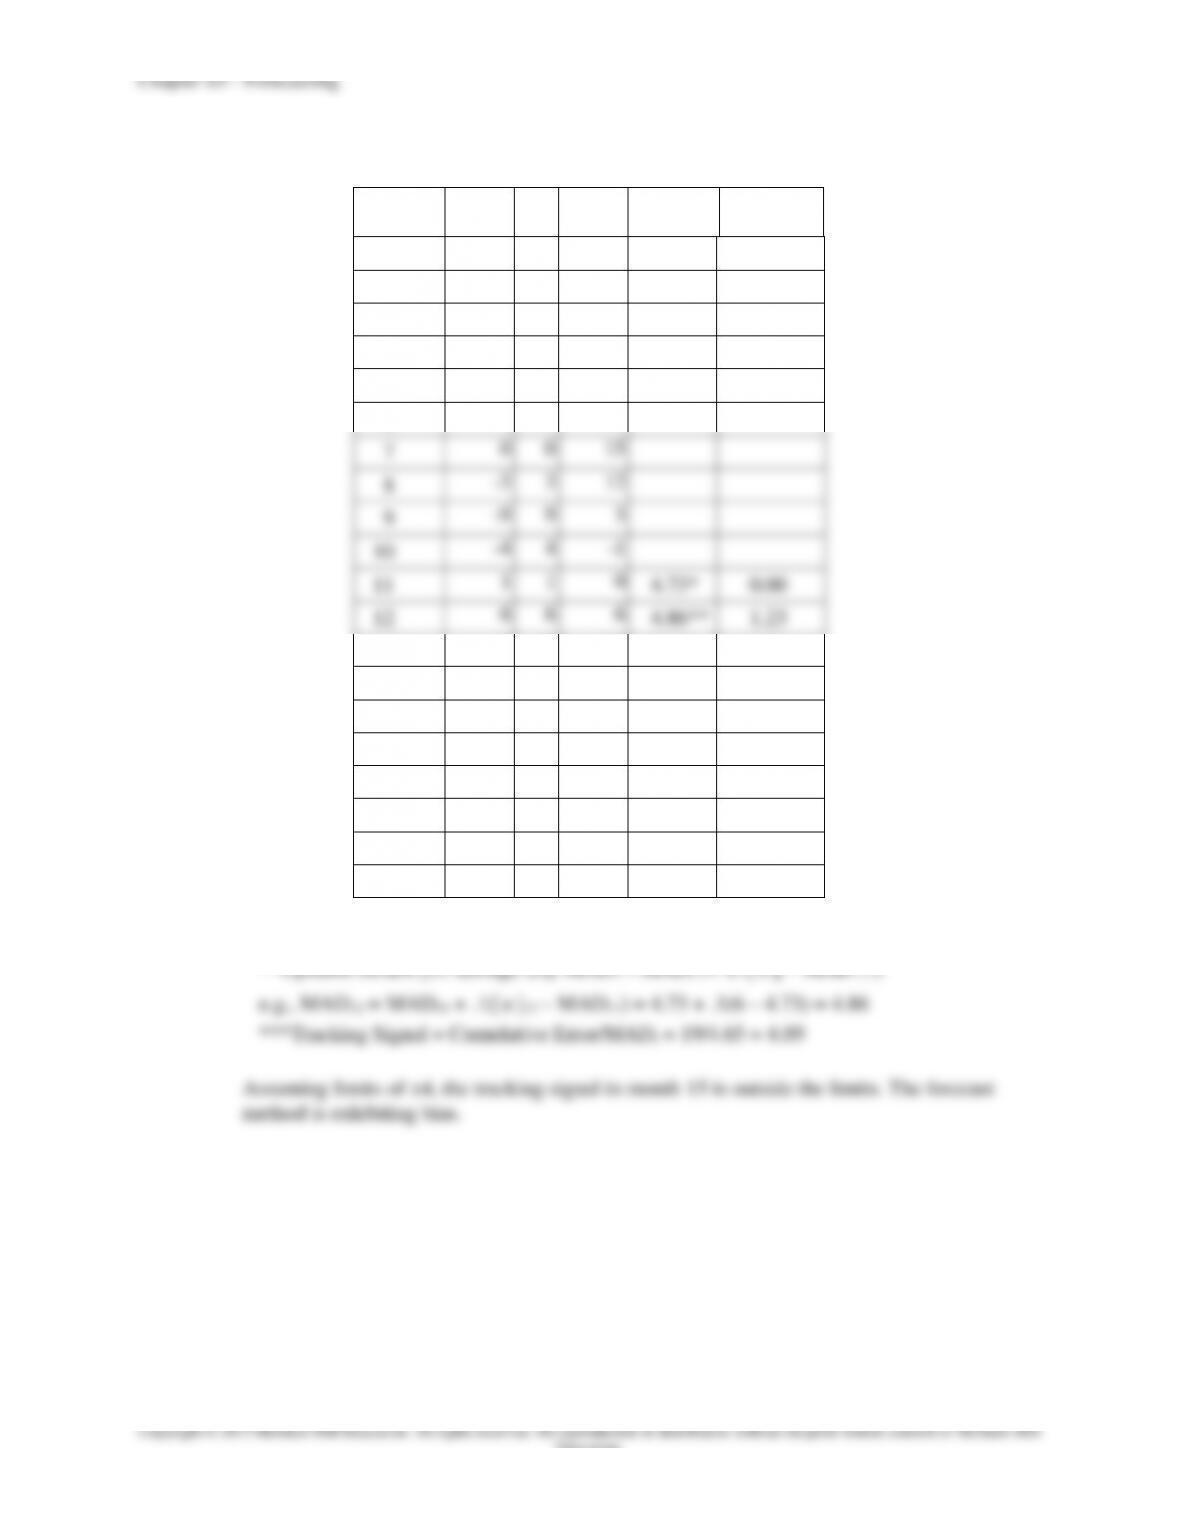
30. a. Round MAD & Tracking Signal values to two decimals:
t
Month
e
Error
| e |
Cum.
Error
MADt
Tracking
Signal
1
-8
8
-8
2
-2
2
-10
3
4
4
-6
4
7
7
1
5
9
9
10
6
5
5
15
7
0
0
15
8
-3
3
12
9
-9
9
3
10
-4
4
-1
11
1
1
0
4.73*
0.00
12
6
6
6
4.86**
1.23
13
8
8
14
5.17
2.71
14
4
4
18
5.05
3.56
15
1
1
19
4.65
4.09***
16
-2
2
17
4.39
3.87
17
-4
4
13
4.35
2.99
18
-8
8
5
4.72
1.06
19
-5
5
0
4.75
0.00
20
-1
1
-1
4.38
-0.23
*Initial MAD = Sum of Cumulative |e| [1 through 11]/11 = 52/11 = 4.73
**Updated MADs [11 through 20]: MADt = MADt–1+ (| e |t – MAD t–1)
e.g., MAD12 = MAD11 + .1(| e |12 – MAD11) = 4.73 + .1(6 – 4.73) = 4.86
***Tracking Signal = Cumulative Error/MADt = 19/4.65 = 4.09
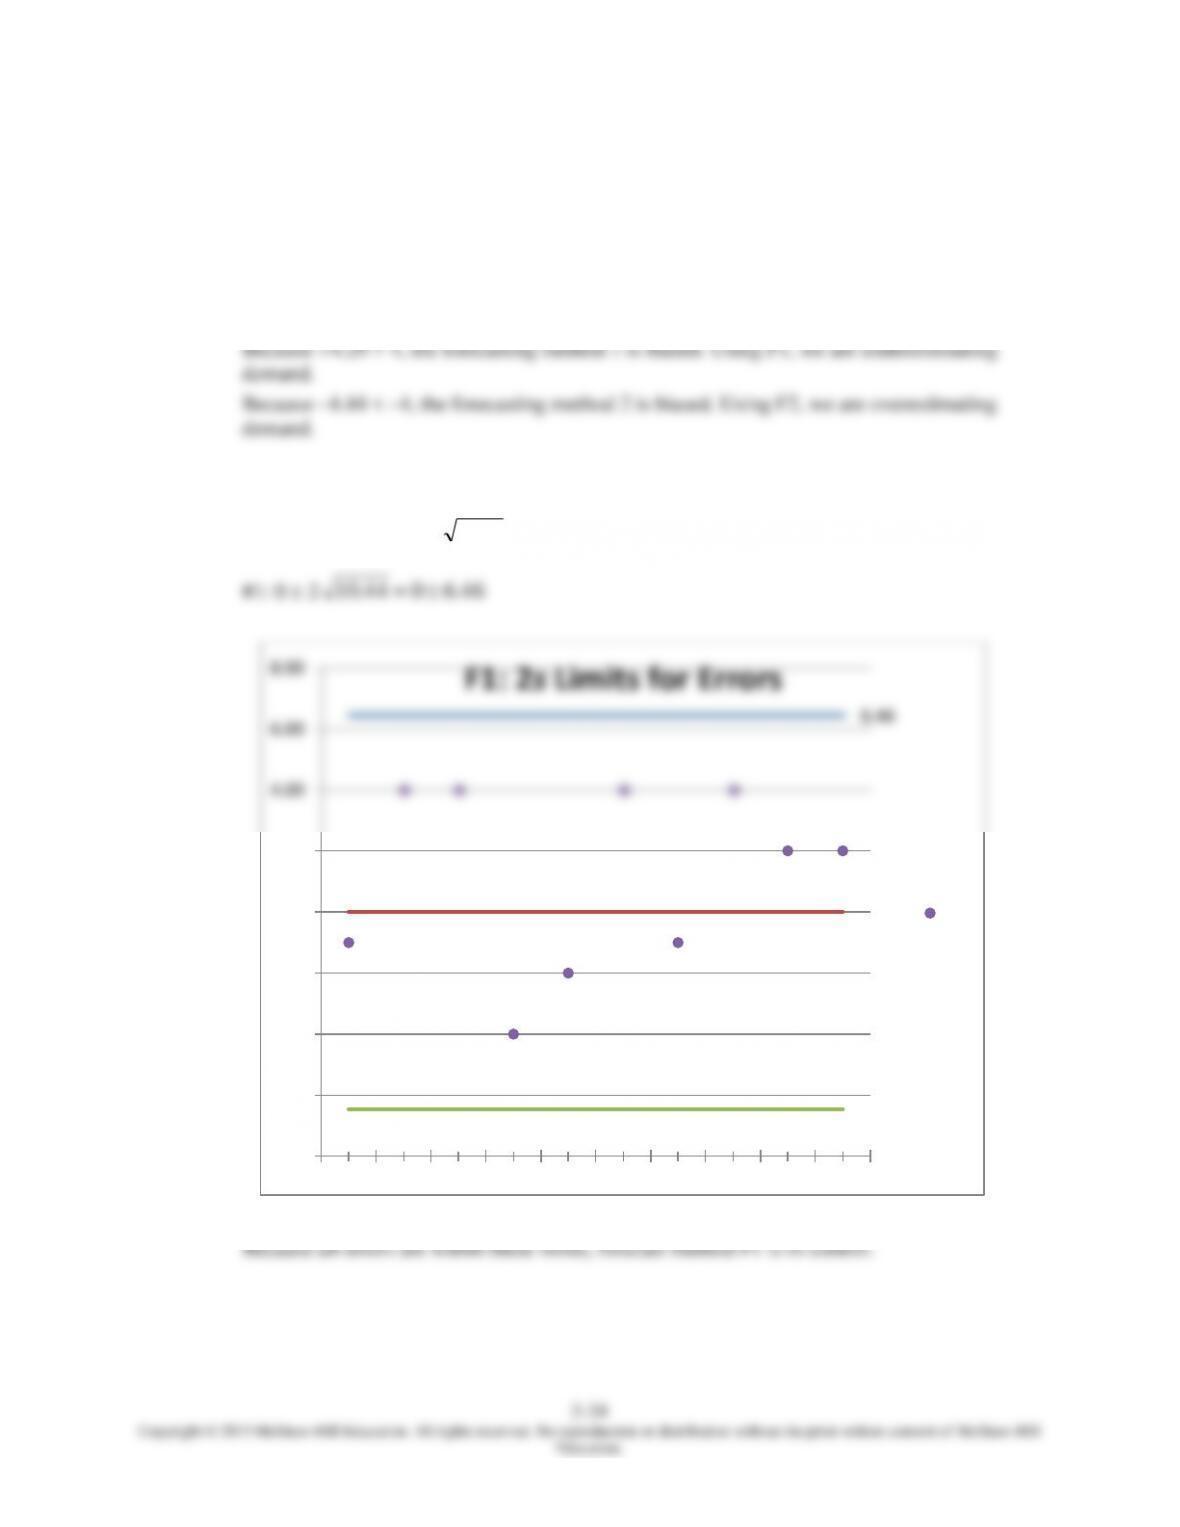
Assuming limits of ±4, the tracking signal in month 15 is outside the limits. The forecast
method is exhibiting bias.
Chapter 03 – Forecasting
3–37
Education.
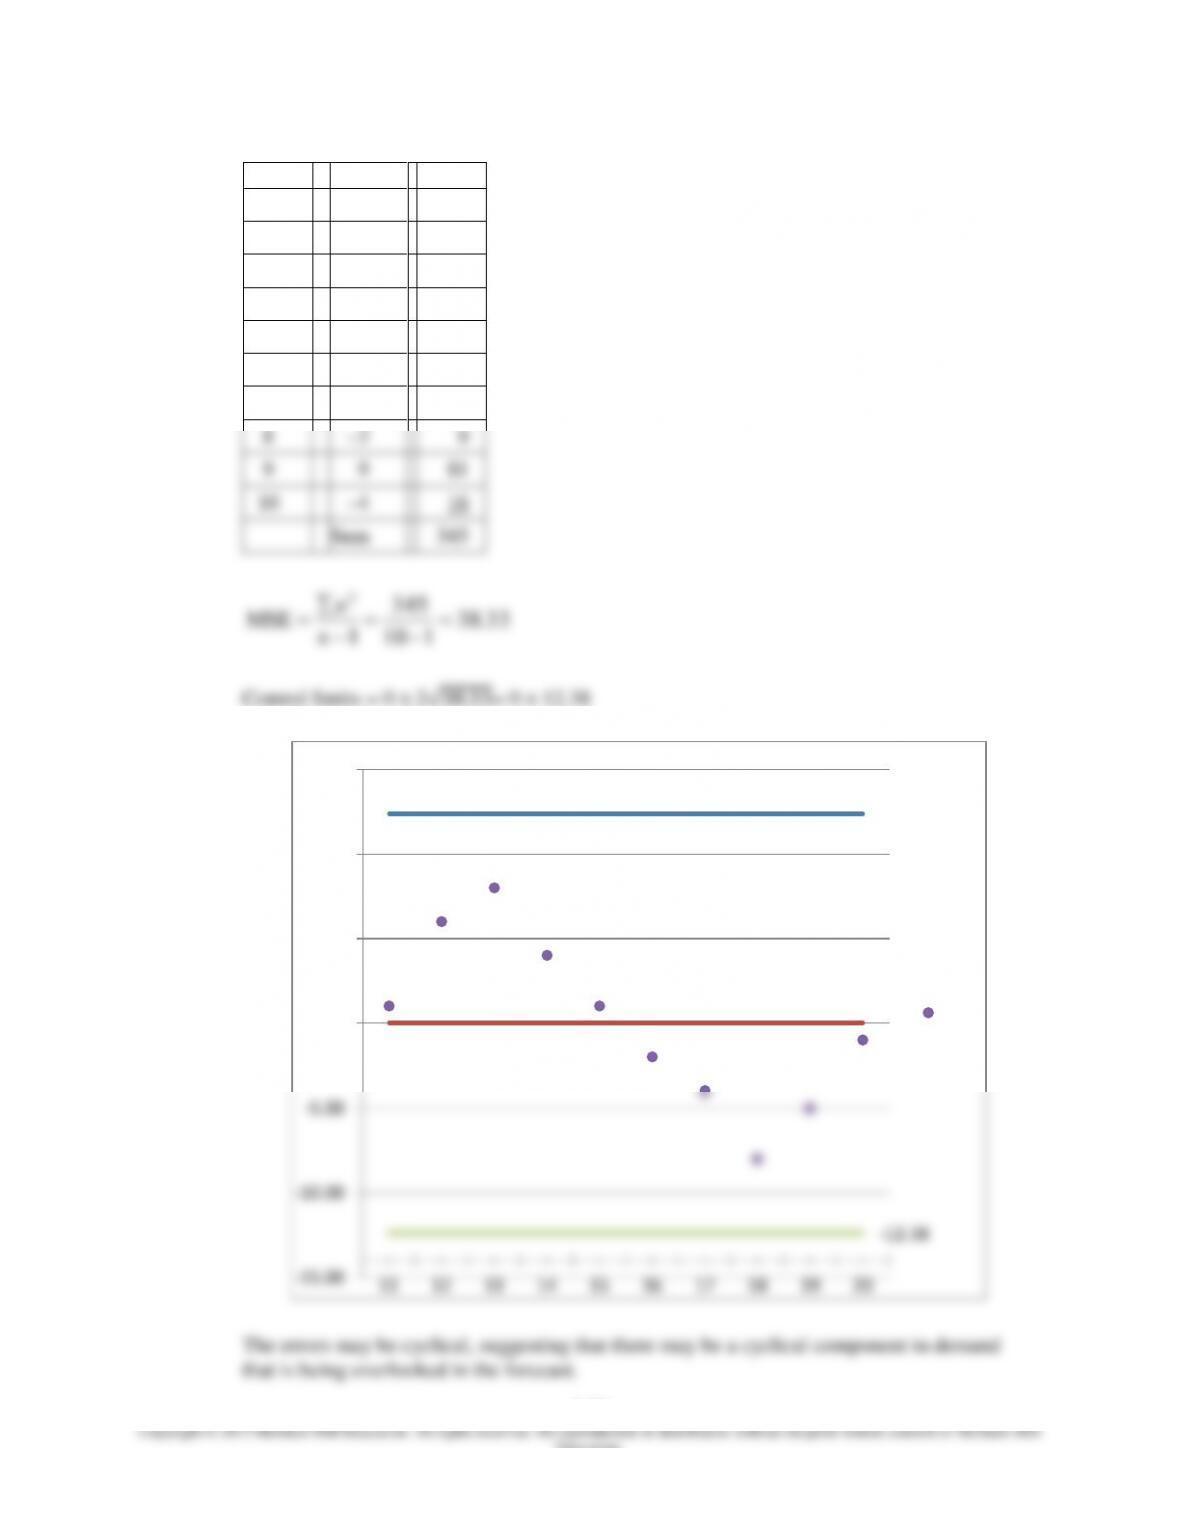
b.
Month
Error
Error2
1
–8
64
2
–2
4
3
4
16
4
7
49
5
9
81
6
5
25
7
0
0
8
–3
9
9
–9
81
10
–4
16
Sum
345
33.38
110
345
1
2
n
e
MSE
Control limits = 0 ± 2√.= 0 ± 12.38
12.38
0.00
-12.38
-15.00
-10.00
-5.00
0.00
5.00
10.00
15.00
11 12 13 14 15 16 17 18 19 20
2s Limits for Errors for 11-20
e
Chapter 03 – Forecasting
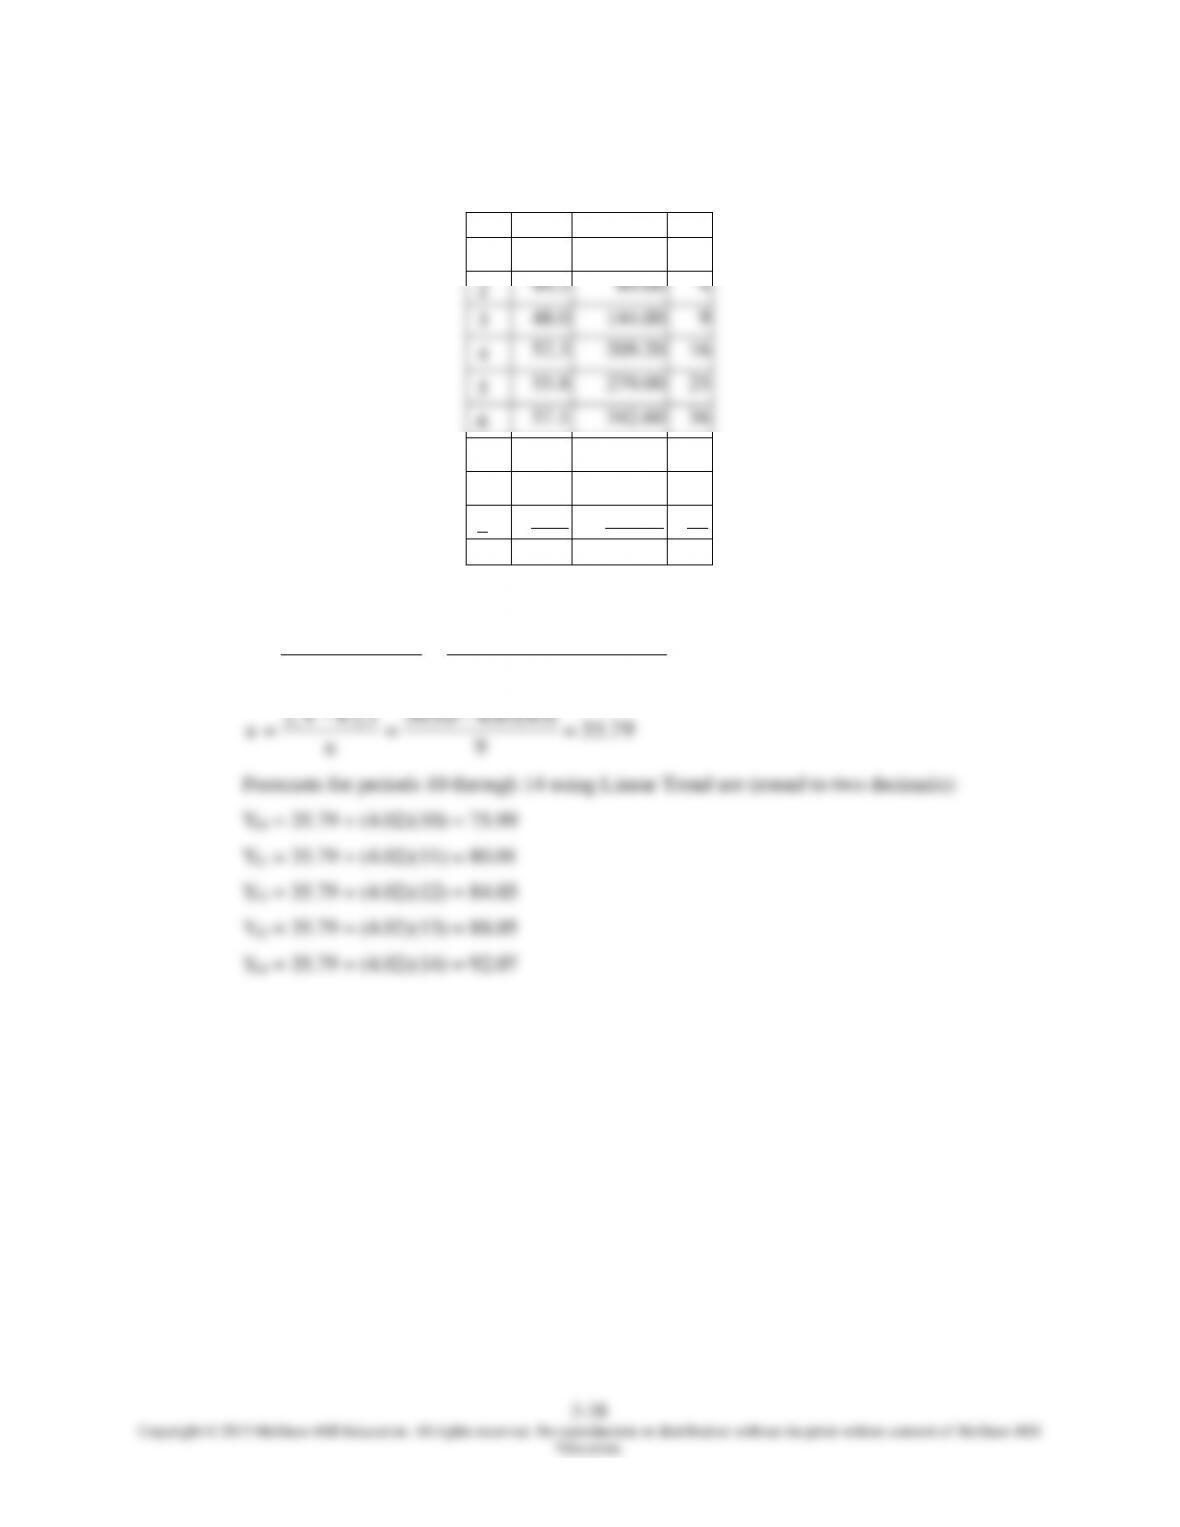
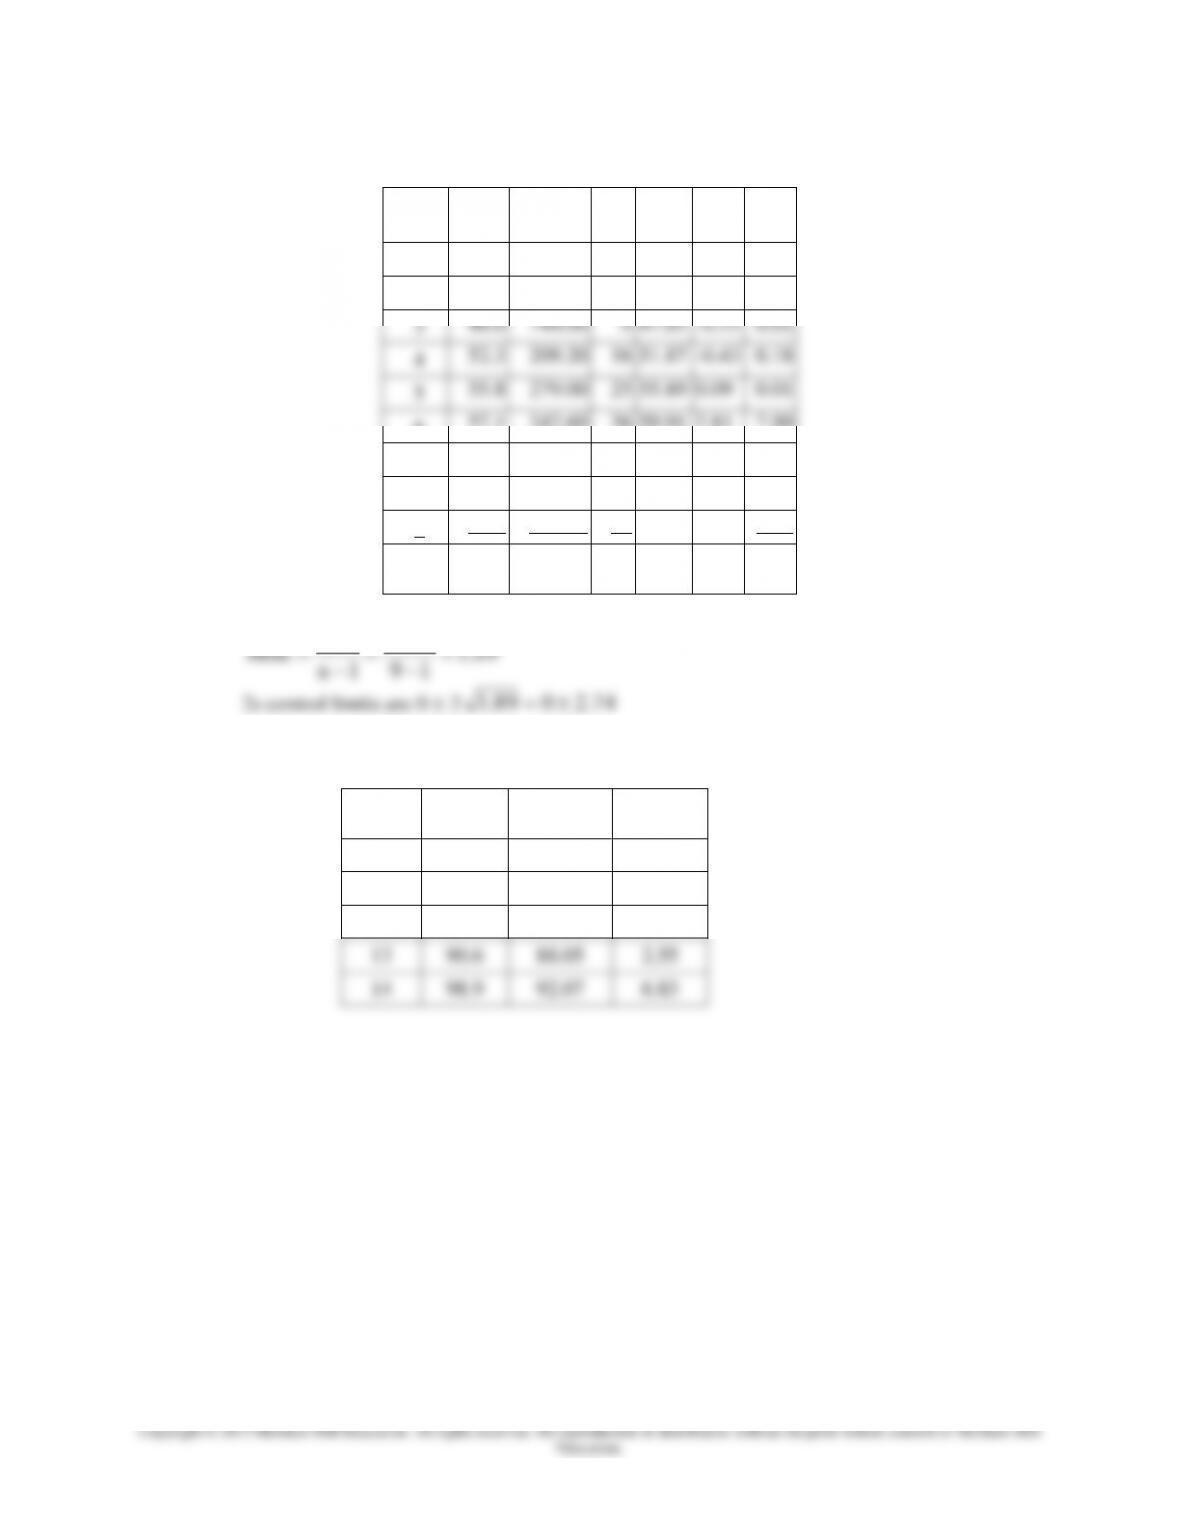
31. a. Linear regression model:
t
Y
t*Y
t2
1
40.2
40.20
1
2
44.5
89.00
4
3
48.0
144.00
9
4
52.3
209.20
16
5
55.8
279.00
25
6
57.1
342.60
36
7
62.4
436.80
49
8
69.0
552.00
64
9
73.7
663.30
81
45
503.0
2,756.10
285
02.4
)45()285(9
)0.503(45)10.756,2(9
)( 222
ttn
YttYn
b
79.35
9
)45(02.40.503
n
tbY
a
Forecasts for periods 10 through 14 using Linear Trend are (round to two decimals):
Y10 = 35.79 + (4.02)(10) = 75.99
Y11 = 35.79 + (4.02)(11) = 80.01
Y12 = 35.79 + (4.02)(12) = 84.03
Y13 = 35.79 + (4.02)(13) = 88.05
Y14 = 35.79 + (4.02)(14) = 92.07
Chapter 03 – Forecasting
3–39
b. Prepare a control chart using 2s limits.
Year
t
Sales
Y
t*Y
t2
F
e
e2
1
40.2
40.20
1
39.81
-0.39
0.15
2
44.5
89.00
4
43.83
-0.67
0.45
3
48.0
144.00
9
47.85
-0.15
0.02
4
52.3
209.20
16
51.87
-0.43
0.18
5
55.8
279.00
25
55.89
0.09
0.01
6
57.1
342.60
36
59.91
2.81
7.90
7
62.4
436.80
49
63.93
1.53
2.34
8
69.0
552.00
64
67.95
-1.05
1.10
9
73.7
663.30
81
39.81
-1.73
2.99
45
503.0
2,756.10
285
15.1
4
89.1
19
14.15
1
2
n
e
MSE
2s control limits are 0 2
74.2089.1
c.
Year
t
Sales
Y
Forecast
F
Error
e
10
77.2
75.99
1.21
11
82.1
80.01
2.09
12
87.8
84.03
3.77
13
90.6
88.05
2.55
14
98.9
92.07
6.83
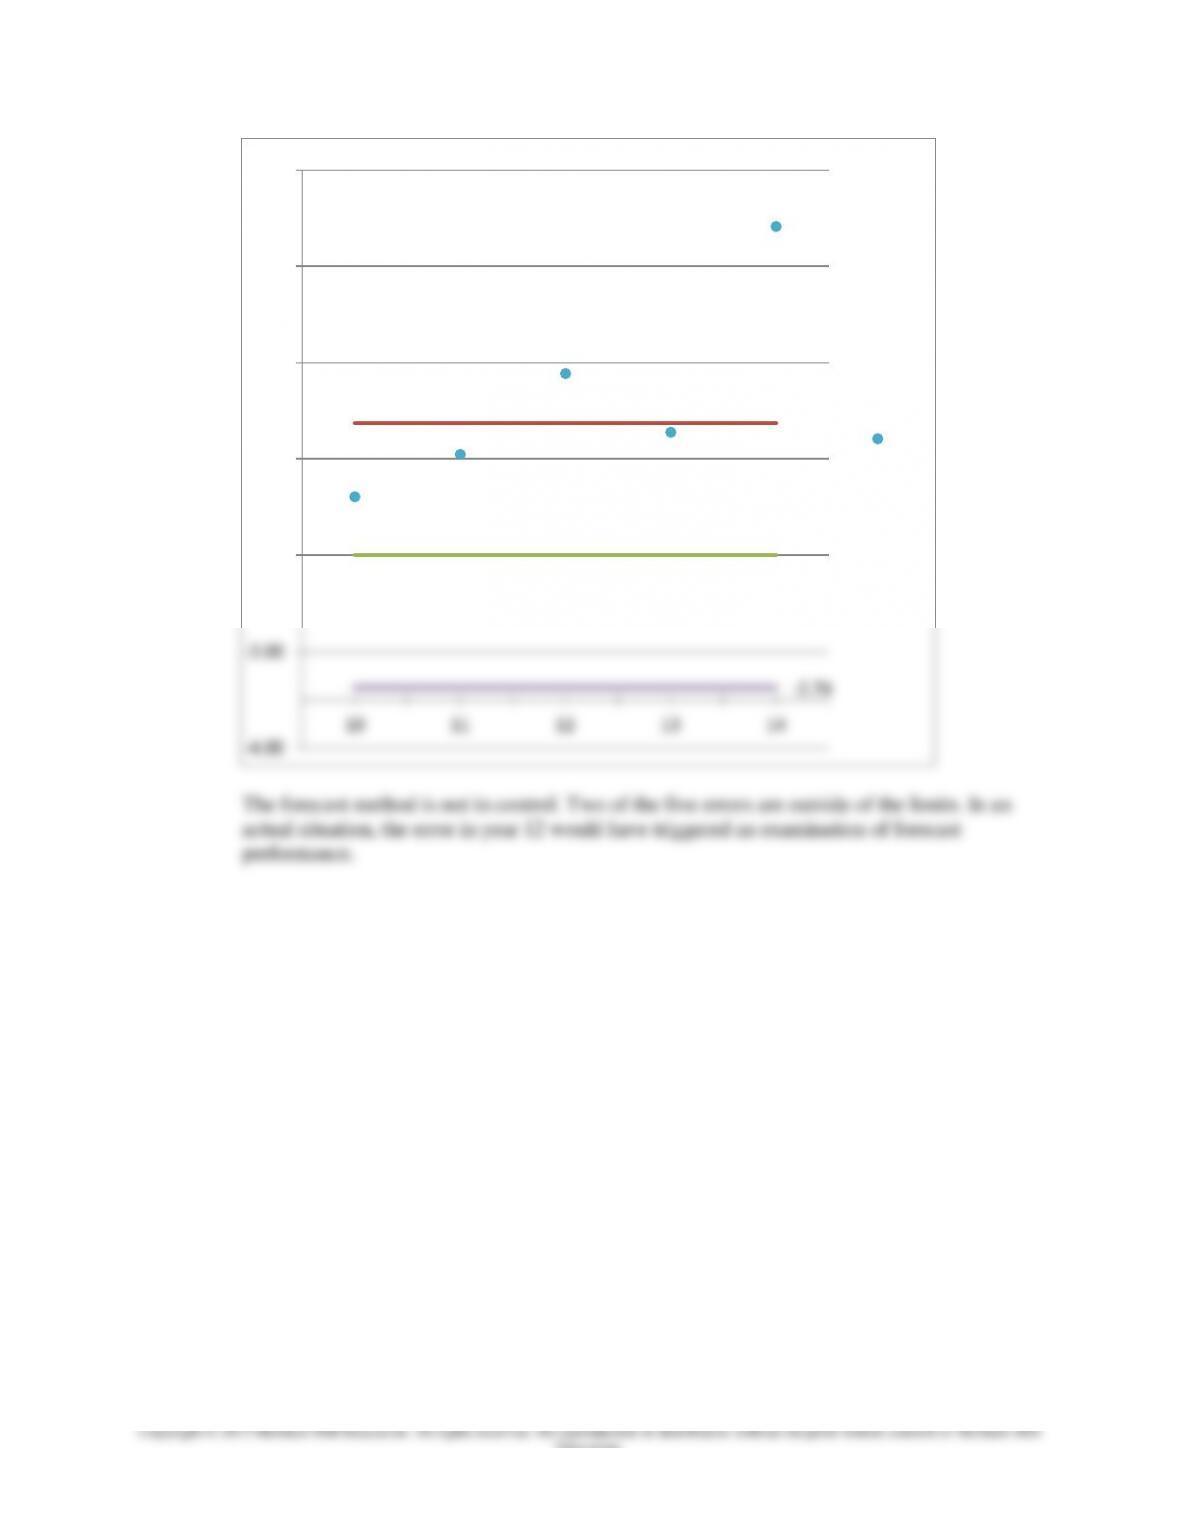
Chapter 03 – Forecasting
3–40
Education.
2.74
0.00
-2.74
-4.00
-2.00
0.00
2.00
4.00
6.00
8.00
10 11 12 13 14
2s Limits for Errors for 10-14
e