Unlock document.
This document is partially blurred.
Unlock all pages and 1 million more documents.
Get Access
Chapter 11 - Aggregate Planning and Master Scheduling
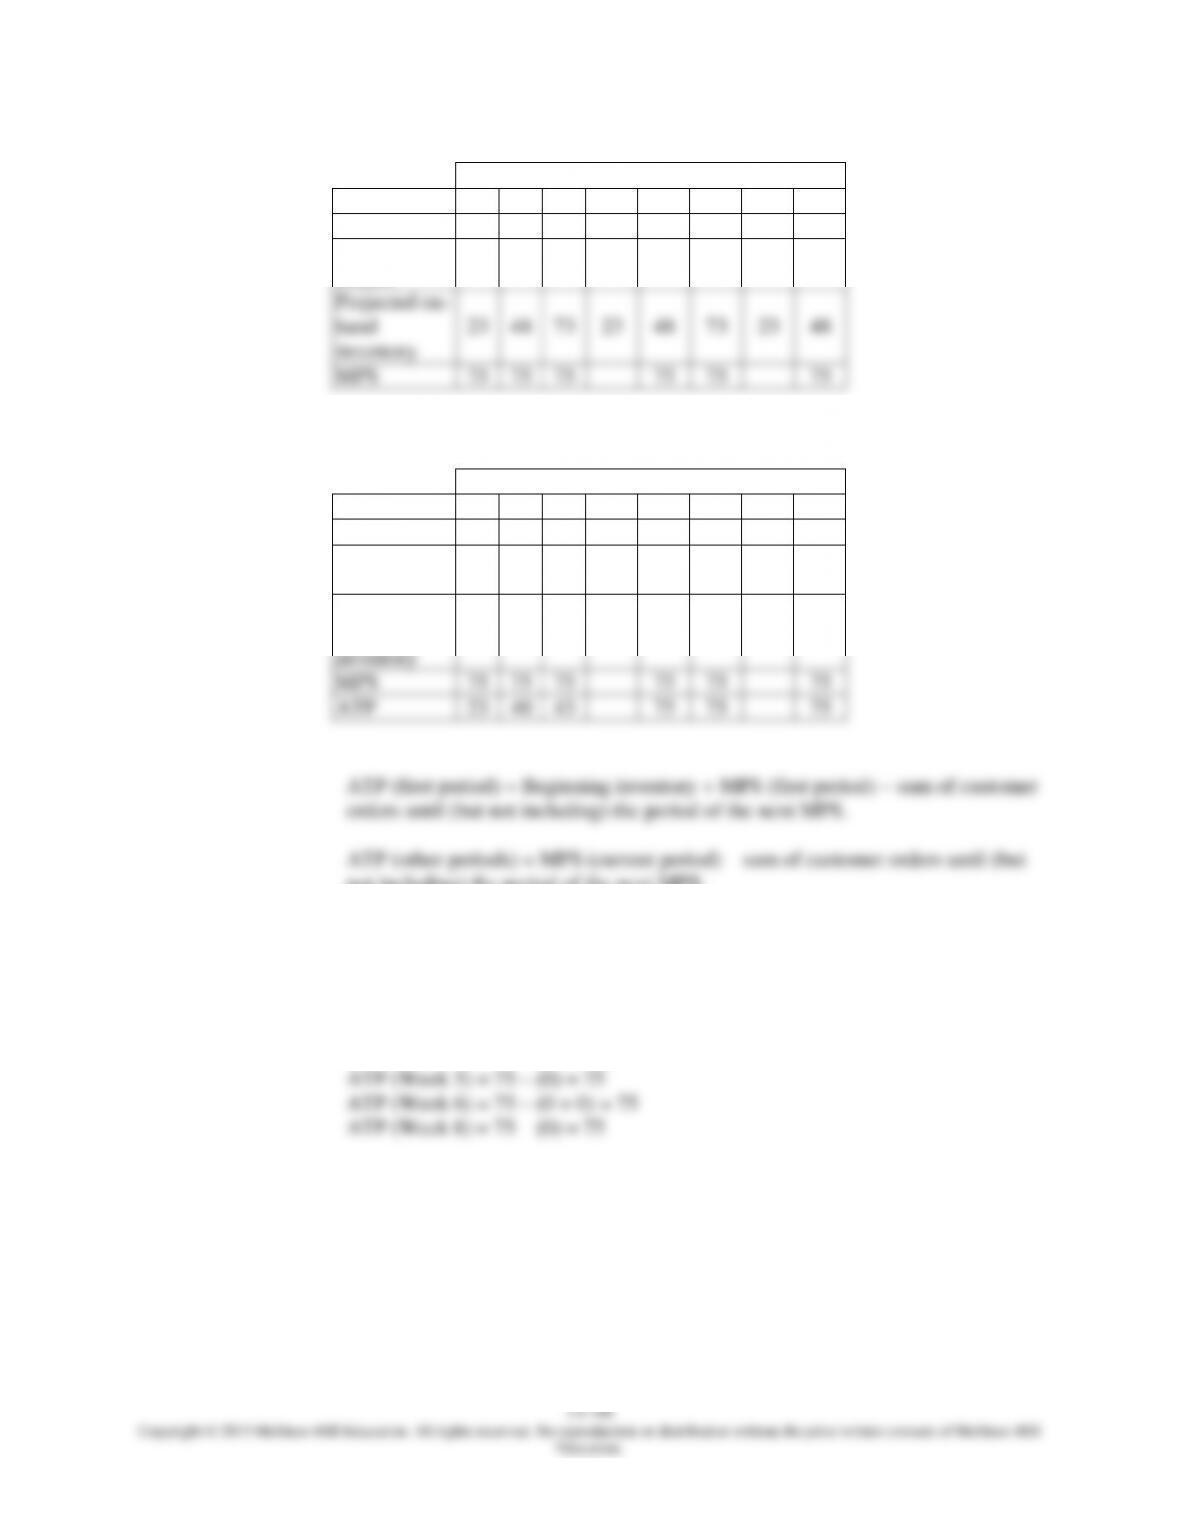
Beg. Inv. = 0
Week
1
2
3
4
5
6
7
8
Forecast
50
50
50
50
50
50
50
50
Customer
Orders
52
35
20
12
Projected on-
hand
inventory
23
48
73
23
48
73
23
48
MPS
75
75
75
75
75
75
22. Calculate the ATP for Problem 21:
Beg. Inv. = 0
Week
1
2
3
4
5
6
7
8
Forecast
50
50
50
50
50
50
50
50
Customer
Orders
52
35
20
12
Projected on-
hand
inventory
23
48
73
23
48
73
23
48
MPS
75
75
75
75
75
75
ATP
23
40
43
75
75
75
not including) the period of the next MPS.
*We calculate ATP in the first period and in all other periods with MPS
quantities.
ATP (Week 1) = 0 + 75 – (52) = 23
ATP (Week 2) = 75 – (35) = 40
ATP (Week 3) = 75 – (20 + 12) = 43
Chapter 11 - Aggregate Planning and Master Scheduling
11-49
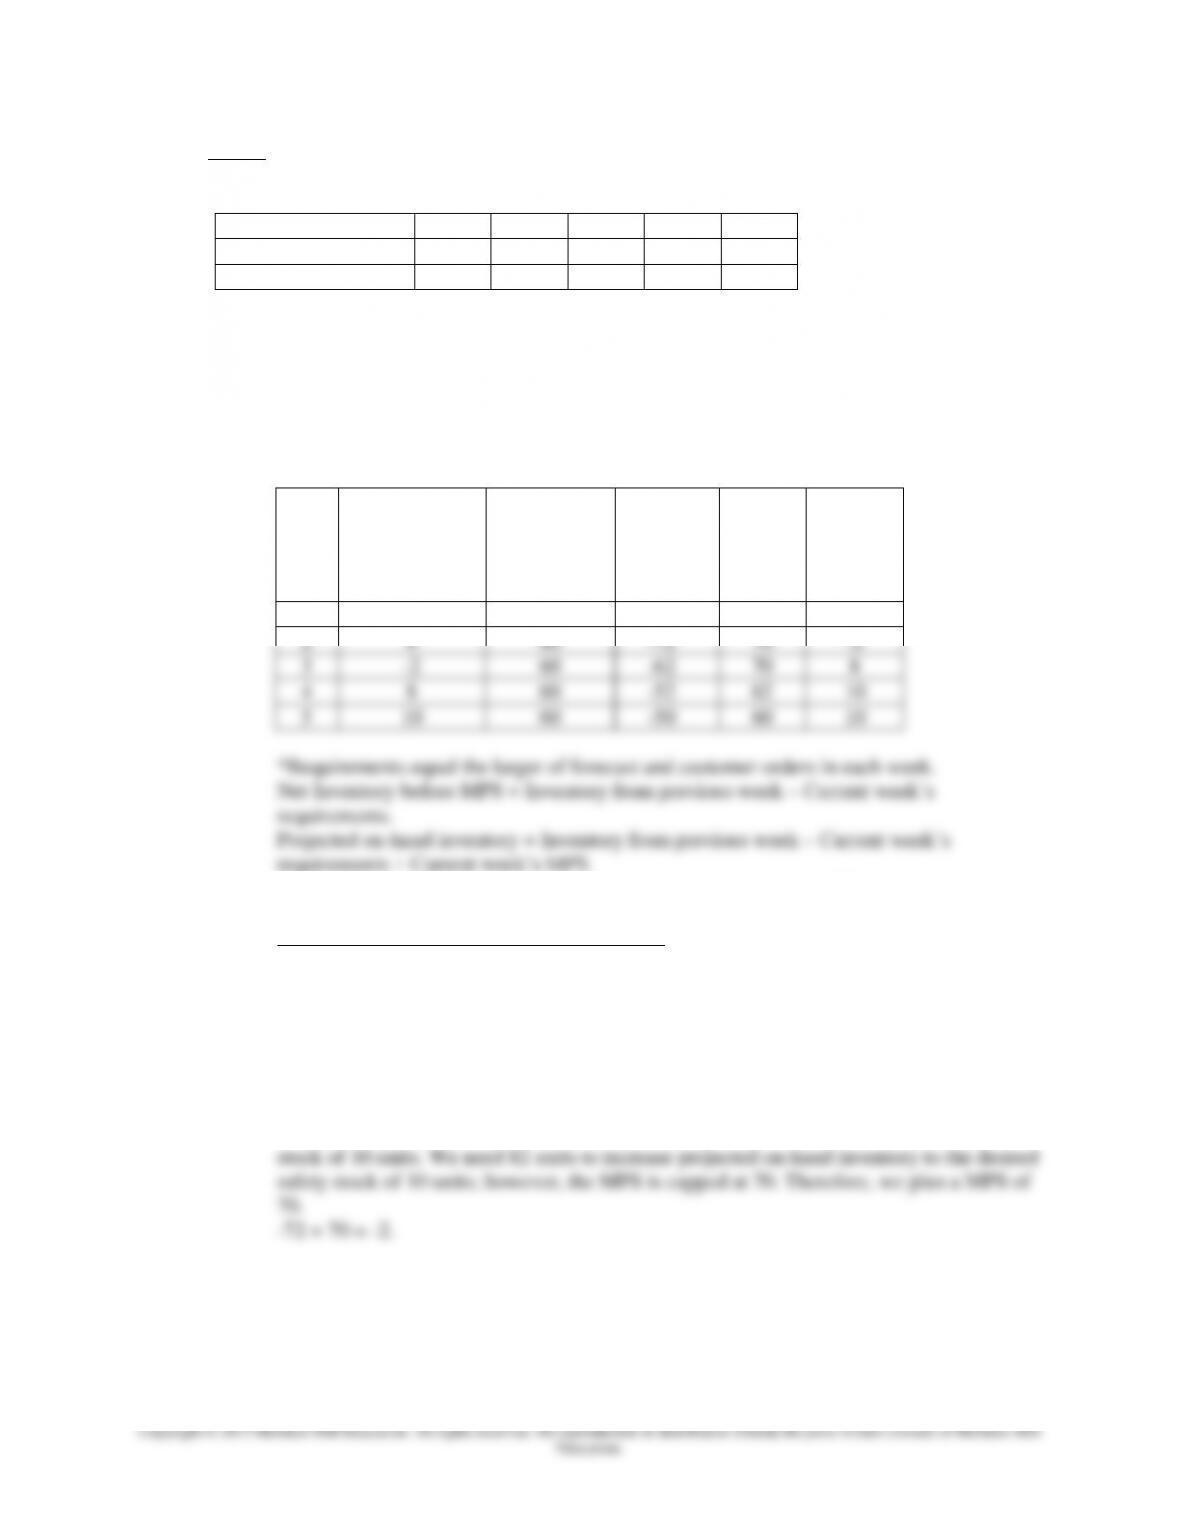
23. Given:
The forecasts and customer orders for the next five periods are shown below:
Period
1
2
3
4
5
Forecast
80
80
60
60
60
Customer Orders
82
80
60
40
20
Beginning inventory = 20 units.
The company uses a chase strategy for determining production lot size, except there is an upper
limit on the lot size of 70 units. The desired safety stock is 10 units. Note: A negative projected
on-hand can occur.
The calculations for MPS and projected on-hand inventory are shown below:
Week
Inventory From
Previous Week
Requirements*
Net
Inventory
before
MPS
Max. of
(70)
MPS
Projected
On-hand
Inventory
1
20
82
-62
70
8
2
8
80
-72
70
-2
3
-2
60
-62
70
8
4
8
60
-52
62
10
5
10
60
-50
60
10
*Requirements equal the larger of forecast and customer orders in each week.
Net Inventory before MPS = Inventory from previous week – Current week’s
requirements.
Projected on-hand inventory = Inventory from previous week – Current week’s
requirements + Current week’s MPS.
Note: We need a MPS quantity whenever Net Inventory before MPS < 10 units.
Calculations for projected on-hand inventory:
Week 1:
Net Inventory before MPS = 20 – 82 = -62. Warning: This is below the desired safety
stock of 10 units. We need 72 units to increase projected on-hand inventory to the desired
safety stock of 10 units; however, the MPS is capped at 70. Therefore, we plan a MPS of
70.
-62 + 70 = 8.
Week 2:
Net Inventory before MPS = 8 – 80 = -72. Warning: This is below the desired safety
Chapter 11 - Aggregate Planning and Master Scheduling
11-50
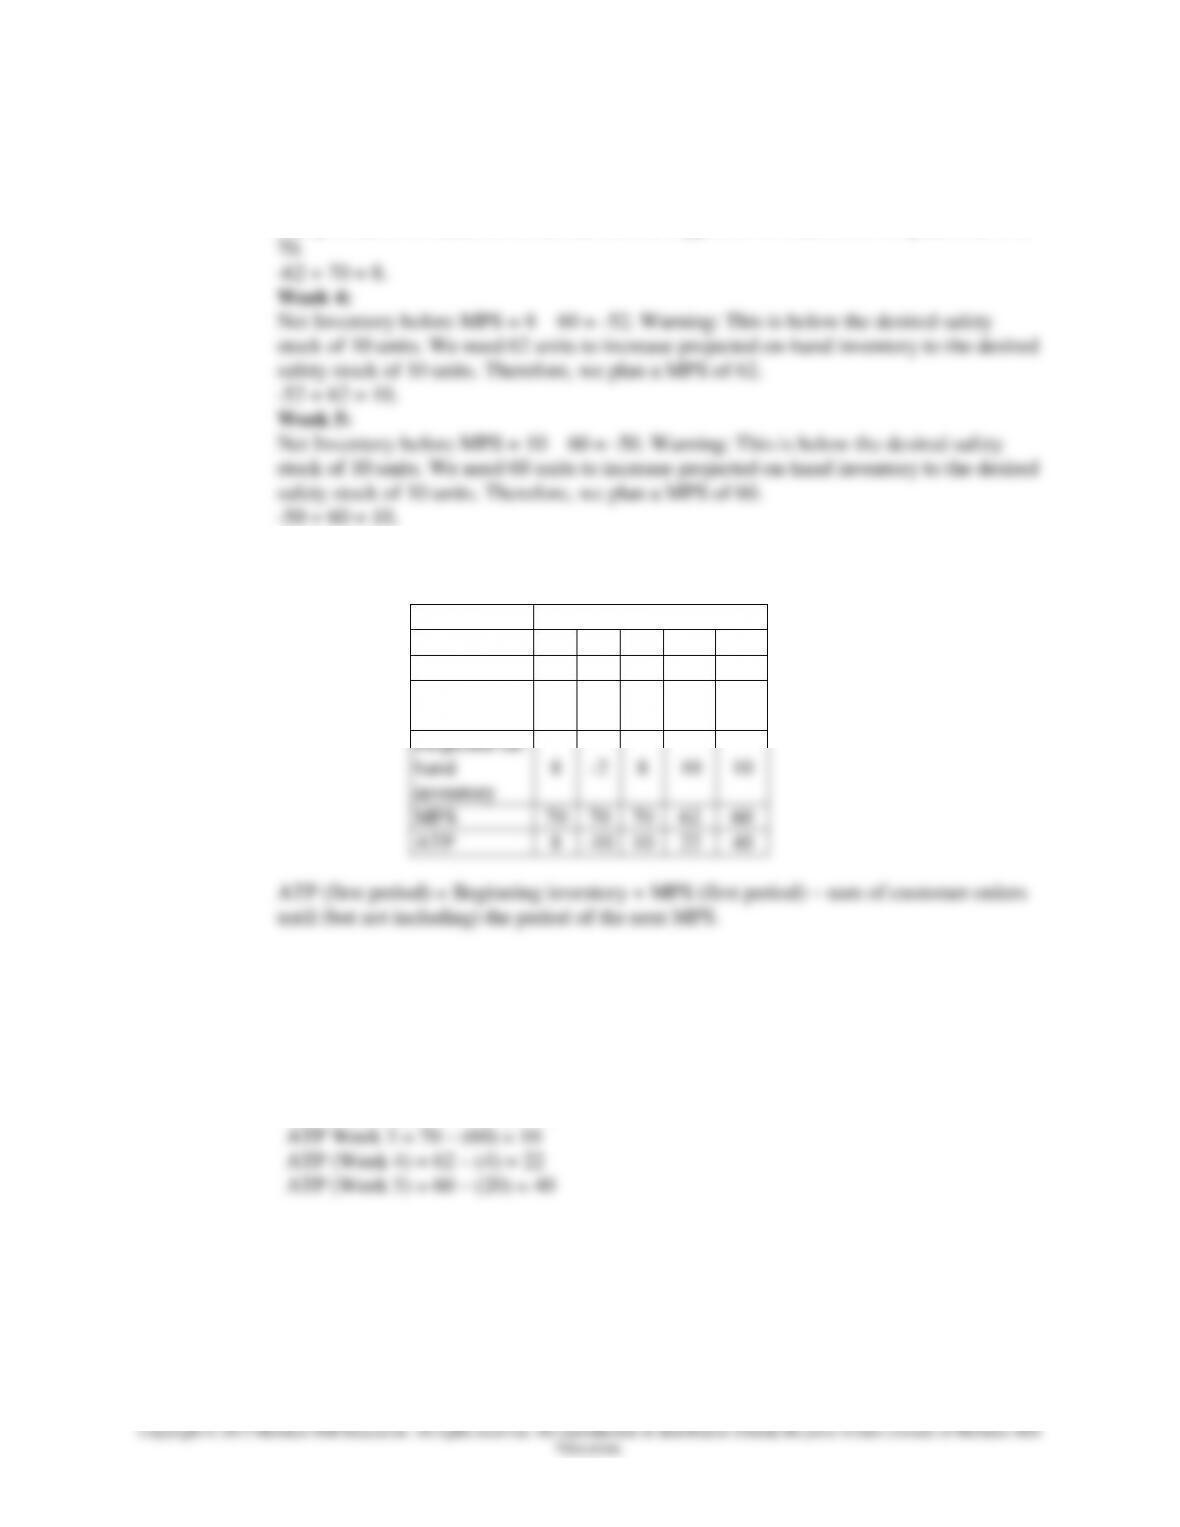
Week 3:
Net Inventory before MPS = -2 – 60 = -62. Warning: This is below the desired safety
stock of 10 units. We need 72 units to increase projected on-hand inventory to the desired
safety stock of 10 units; however, the MPS is capped at 70. Therefore, we plan a MPS of
The final MPS is shown below:
Week
Beg. Inv. = 20
1
2
3
4
5
Forecast
80
80
60
60
60
Customer
Orders
82
80
60
40
20
Projected on-
hand
inventory
8
-2
8
10
10
MPS
70
70
70
62
60
ATP
8
-10
10
22
40
ATP (first period) = Beginning inventory + MPS (first period) – sum of customer orders
until (but not including) the period of the next MPS.
ATP (other periods) = MPS (current period) – sum of customer orders until (but not
including) the period of the next MPS.
*We calculate ATP in the first period and in all other periods with MPS quantities.
ATP (Week 1) = 20 + 70 – (82) = 8
ATP (Week 2) = 70 – (80) = -10
Chapter 11 - Aggregate Planning and Master Scheduling
11-51
Education.
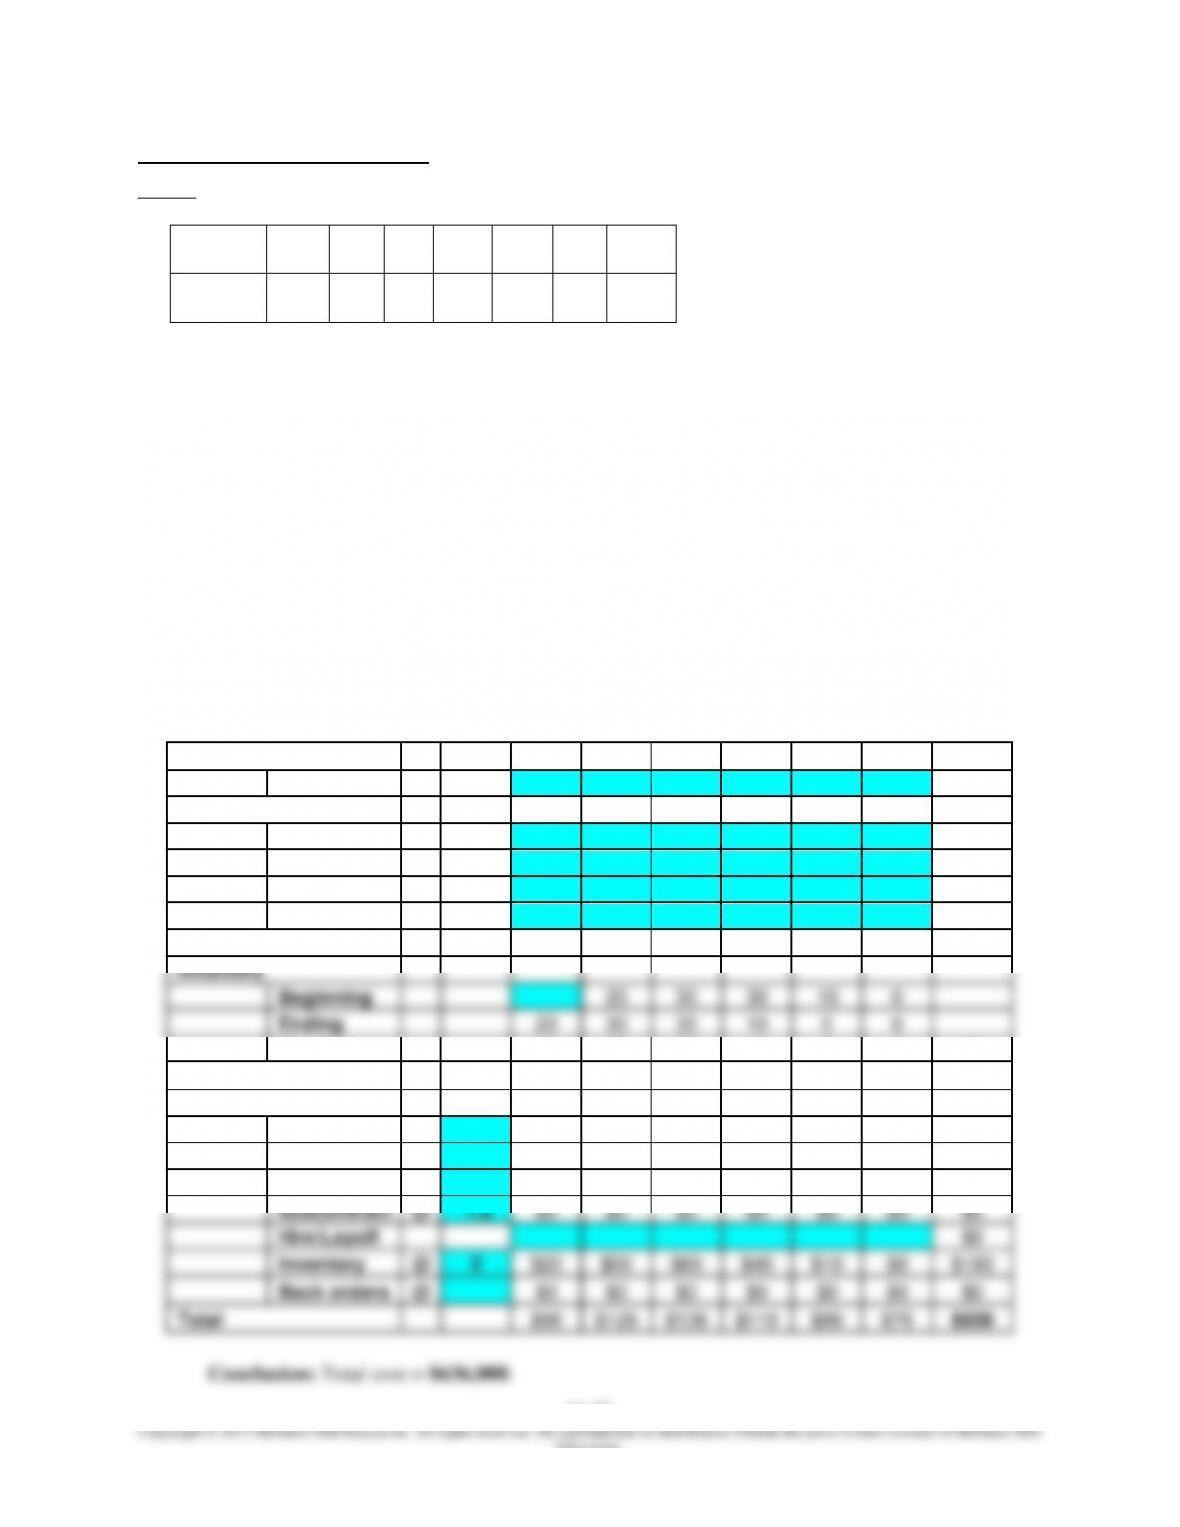
Case: Eight Glasses a Day
Given:
Forecasts:
Month
May
Jun
Jul
Aug
Sept
Oct
Total
Forecast
50
60
70
90
80
70
420
Costs (all costs are in thousands of dollars):
Regular production cost = $1 per tankload
Regular production capacity = 60 tankloads
Overtime production cost = $1.6 per tankload
Subcontracting cost = $1.8 per tankload
Holding cost = $2 per tankload per month
Beginning inventory = 0 tankloads
Backlogs are not allowed.
1. Select the plan that has the lowest costs:
Strategy 1: Level production supplemented by up to 10 tankloads a month from overtime.
Total Demand = 420 units. We have regular time capacity = 60 tankloads per month = 6 months *
6 tankloads/month = 360 tankloads over the 6-month plan. We will need to use overtime for 420
– 360 = 60 tankloads. Given that overtime is limited to 10 tankloads/month, we will plan
overtime of 10 tankloads each month. The plan using overtime is shown below:
Period
May
Jun
Jul
Aug
Sept
Oct
Total
Forecast
50
60
70
90
80
70
420
Output
Regular
60
60
60
60
60
60
360
Part Time
0
Overtime
10
10
10
10
10
10
60
Subcontract
0
Output - Forecast
20
10
0
-20
-10
0
0
Inventory
Beginning
20
30
30
10
0
Ending
20
30
30
10
0
0
Average
10
25
30
20
5
0
90
Backlog
0
0
0
0
0
0
0
Costs:
Regular
@
1
$60
$60
$60
$60
$60
$60
$360
Part Time
@
$0
$0
$0
$0
$0
$0
$0
Overtime
@
1.6
$16
$16
$16
$16
$16
$16
$96
Subcontract
@
1.8
$0
$0
$0
$0
$0
$0
$0
Hire/Layoff
$0
Inventory
@
2
$20
$50
$60
$40
$10
$0
$180
Back orders
@
$0
$0
$0
$0
$0
$0
$0
Total
$96
$126
$136
$116
$86
$76
$636
Conclusion: Total cost = $636,000.
Chapter 11 - Aggregate Planning and Master Scheduling
11-52
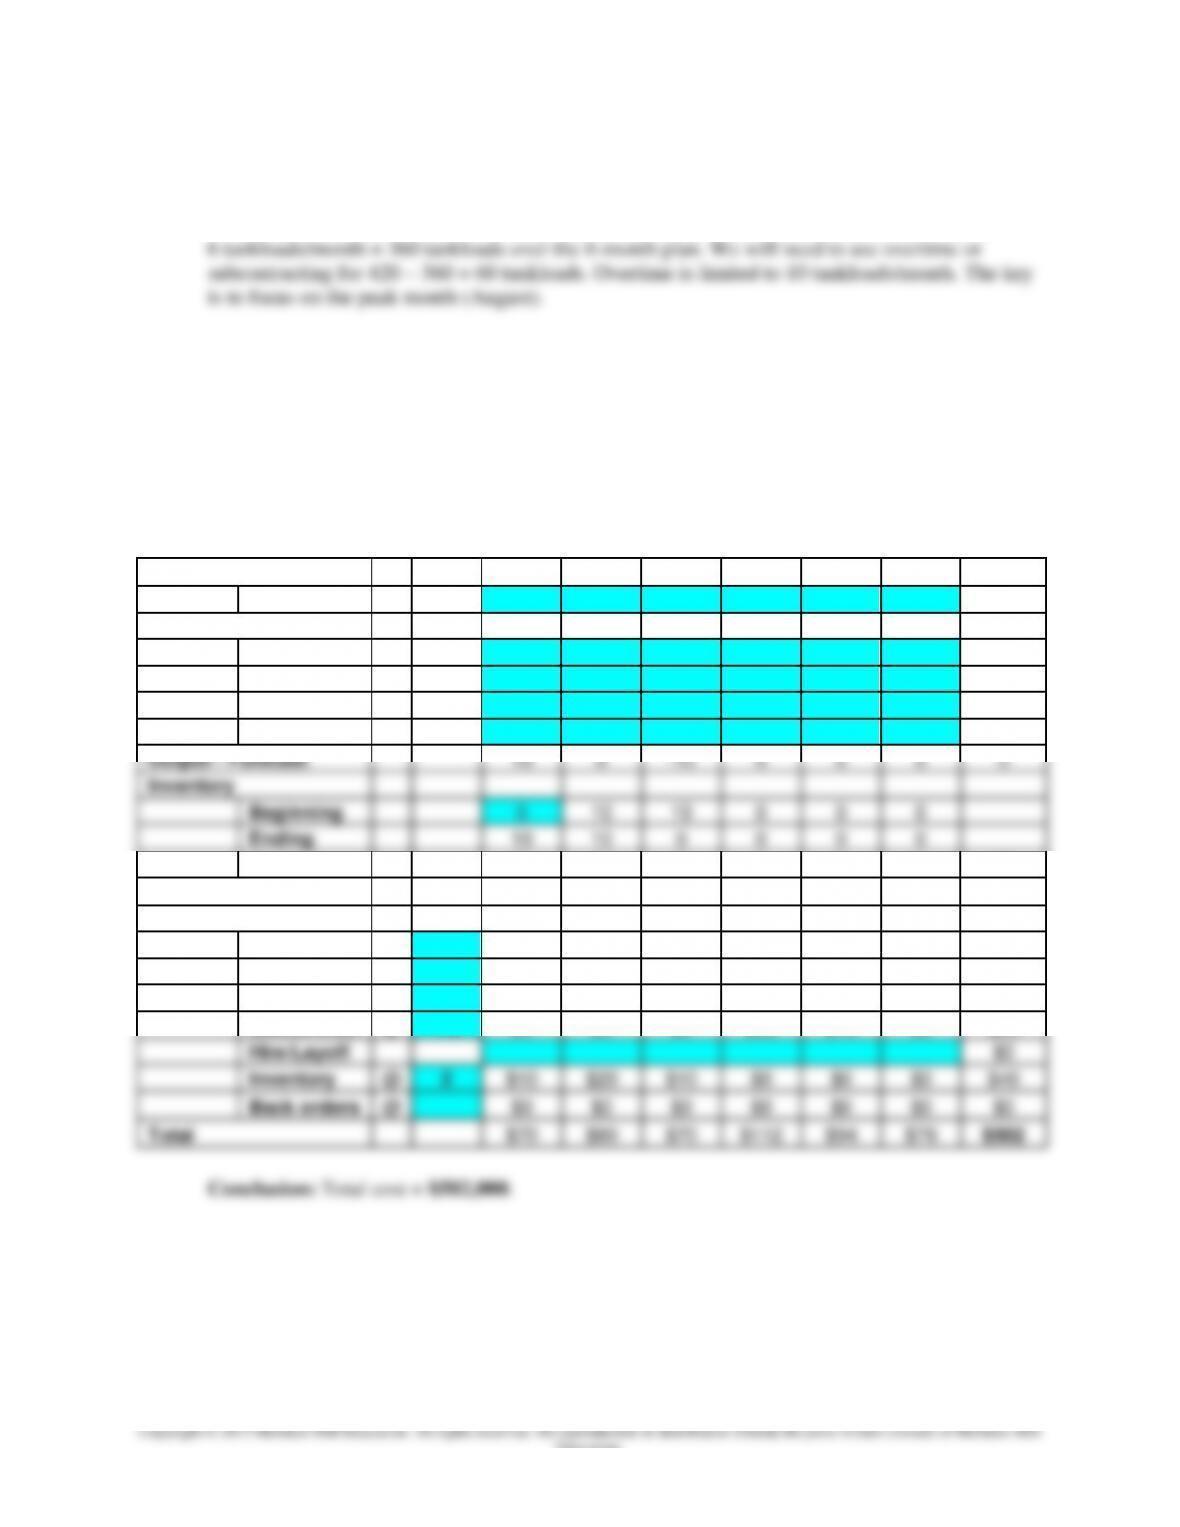
Education.
Strategy 2: Level production with a combination of overtime, inventory, and
subcontracting.
Total Demand = 420 units. We have regular time capacity = 60 tankloads per month = 6 months *
Overtime costs $1.6 per tankload while subcontracting costs $1.8 per tankload. Therefore, in a
given month, we prefer using overtime over subcontracting. When would it make sense to use
subcontracting instead of overtime? If we use overtime 1 month early to meet demand in the
current month, the cost per tankload = $1.6 + $2 = $3.6. Therefore, if the choice is to produce a
tankload 1 month early or to subcontract it in the current month, we prefer to subcontract it in the
current month. This means that if we exhaust overtime in the current month, we would prefer to
subcontract in the current month over using overtime in earlier months to meet the excess demand
in the current month.
Period
May
Jun
Jul
Aug
Sept
Oct
Total
Forecast
50
60
70
90
80
70
420
Output
Regular
60
60
60
60
60
60
360
Part Time
0
Overtime
10
10
10
30
Subcontract
20
10
30
Output - Forecast
10
0
-10
0
0
0
0
Inventory
Beginning
0
10
10
0
0
0
Ending
10
10
0
0
0
0
Average
5
10
5
0
0
0
20
Backlog
0
0
0
0
0
0
0
Costs:
Regular
@
1
$60
$60
$60
$60
$60
$60
$360
Part Time
@
$0
$0
$0
$0
$0
$0
$0
Overtime
@
1.6
$0
$0
$0
$16
$16
$16
$48
Subcontract
@
1.8
$0
$0
$0
$36
$18
$0
$54
Hire/Layoff
$0
Inventory
@
2
$10
$20
$10
$0
$0
$0
$40
Back orders
@
$0
$0
$0
$0
$0
$0
$0
Total
$70
$80
$70
$112
$94
$76
$502
Conclusion: Total cost = $502,000.
Chapter 11 - Aggregate Planning and Master Scheduling
11-53
Education.
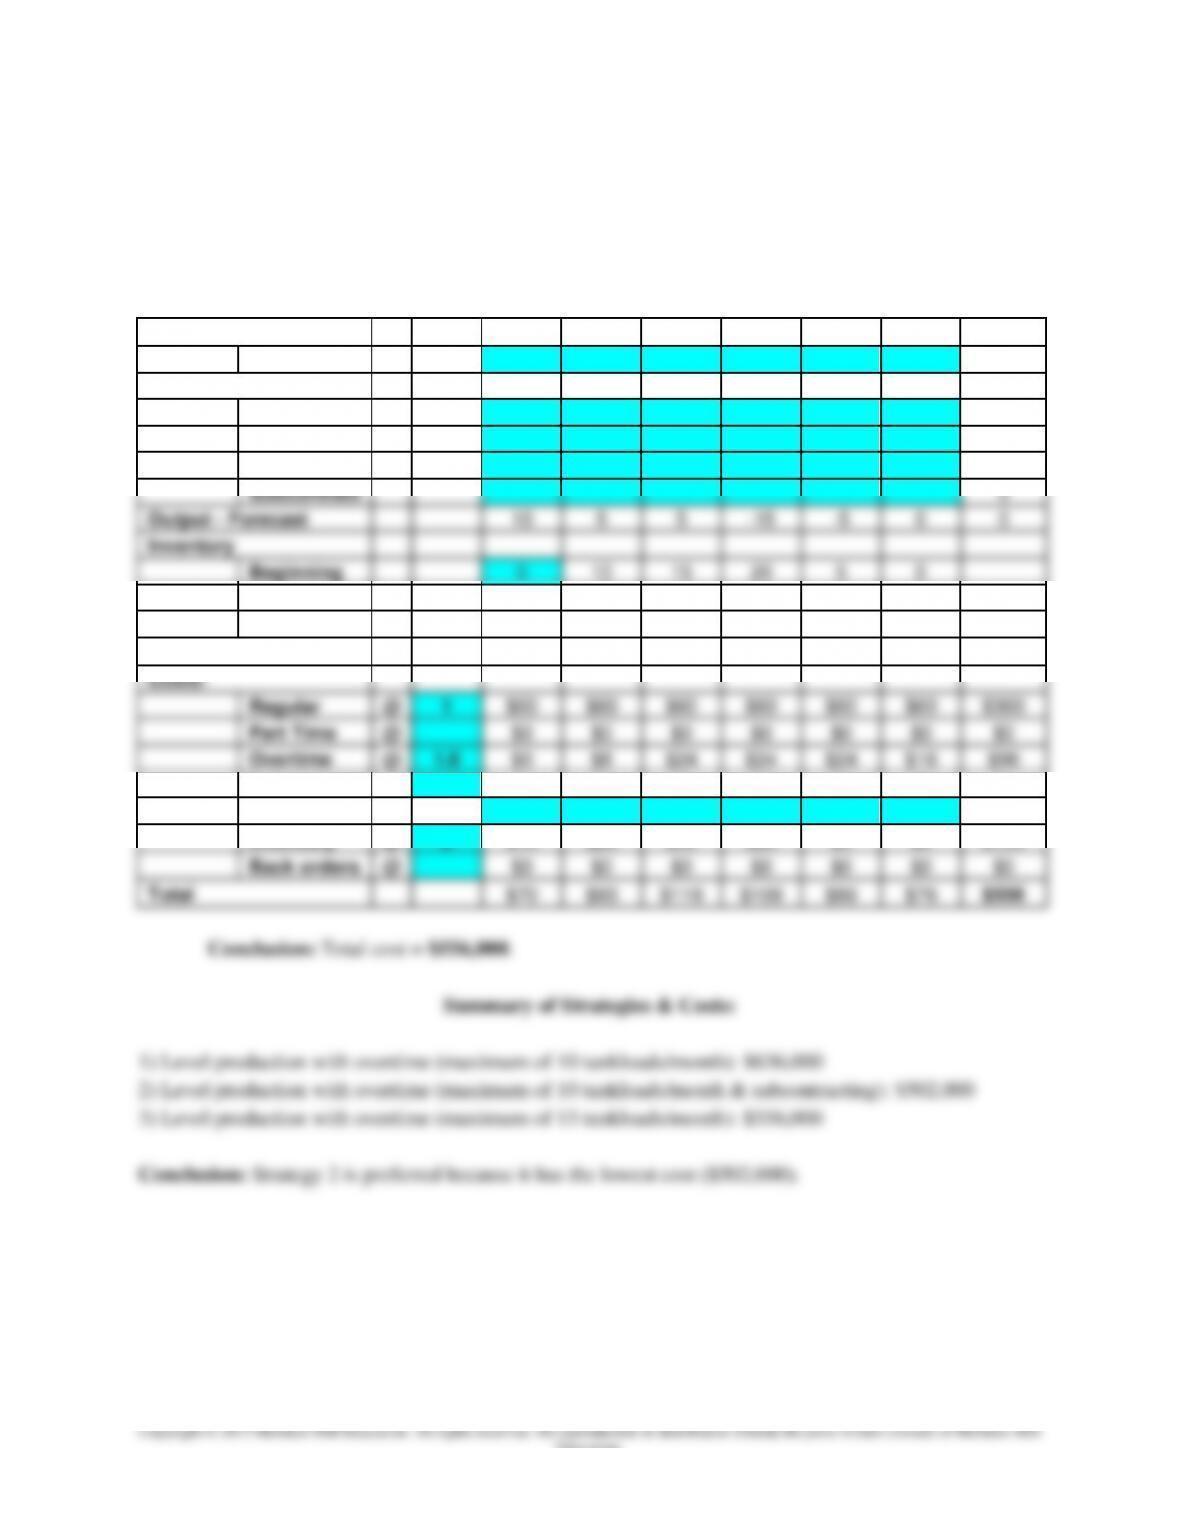
Strategy 3: Level production supplemented by up to 15 tankloads a month from overtime.
Total Demand = 420 units. We have regular time capacity = 60 tankloads per month = 6 months *
6 tankloads/month = 360 tankloads over the 6-month plan. We will need to use overtime for 420
– 360 = 60 tankloads. The key is to focus on the peak month (August). The plan using a
maximum of 15 tankloads of overtime in a period is shown below:
Period
May
Jun
Jul
Aug
Sept
Oct
Total
Forecast
50
60
70
90
80
70
420
Output
Regular
60
60
60
60
60
60
360
Part Time
0
Overtime
5
15
15
15
10
60
Subcontract
0
Output - Forecast
10
5
5
-15
-5
0
0
Inventory
Beginning
0
10
15
20
5
0
Ending
10
15
20
5
0
0
Average
5
13
18
13
3
0
50
Backlog
0
0
0
0
0
0
0
Costs:
Regular
@
1
$60
$60
$60
$60
$60
$60
$360
Part Time
@
$0
$0
$0
$0
$0
$0
$0
Overtime
@
1.6
$0
$8
$24
$24
$24
$16
$96
Subcontract
@
1.8
$0
$0
$0
$0
$0
$0
$0
Hire/Layoff
$0
Inventory
@
2
$10
$25
$35
$25
$5
$0
$100
Back orders
@
$0
$0
$0
$0
$0
$0
$0
Total
$70
$93
$119
$109
$89
$76
$556