Chapter 11 – Aggregate Planning and Master Scheduling
11–11
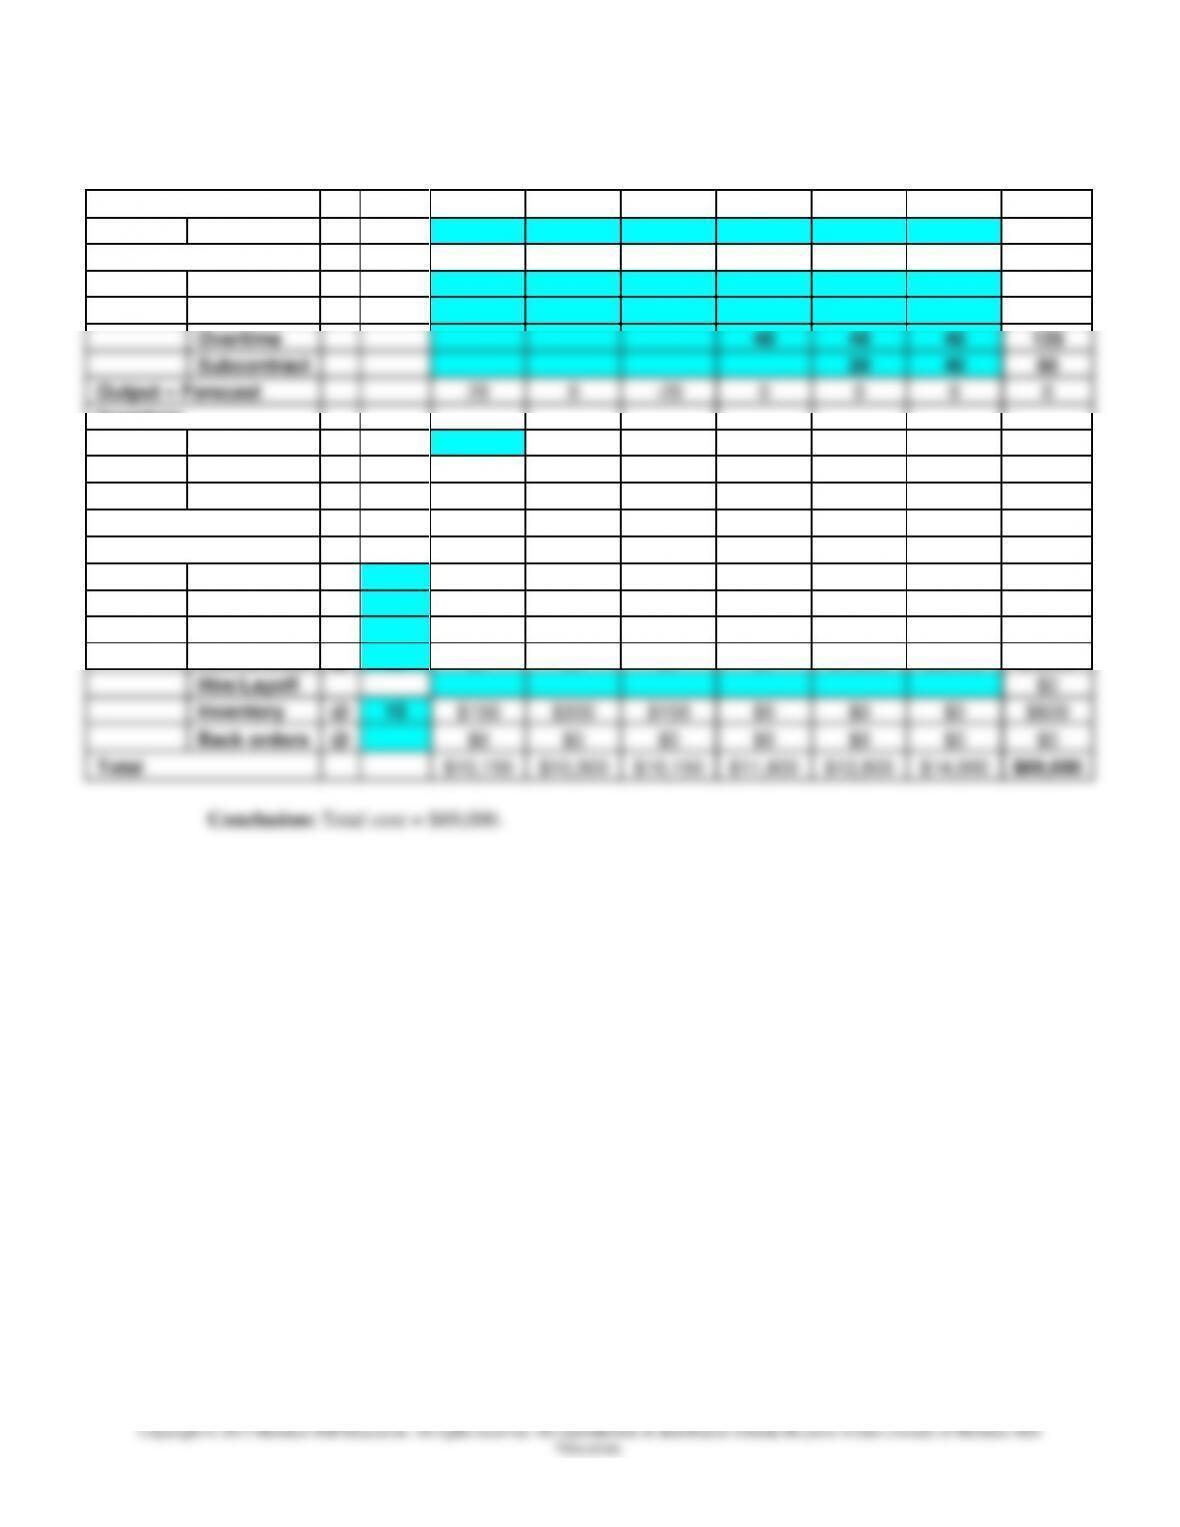
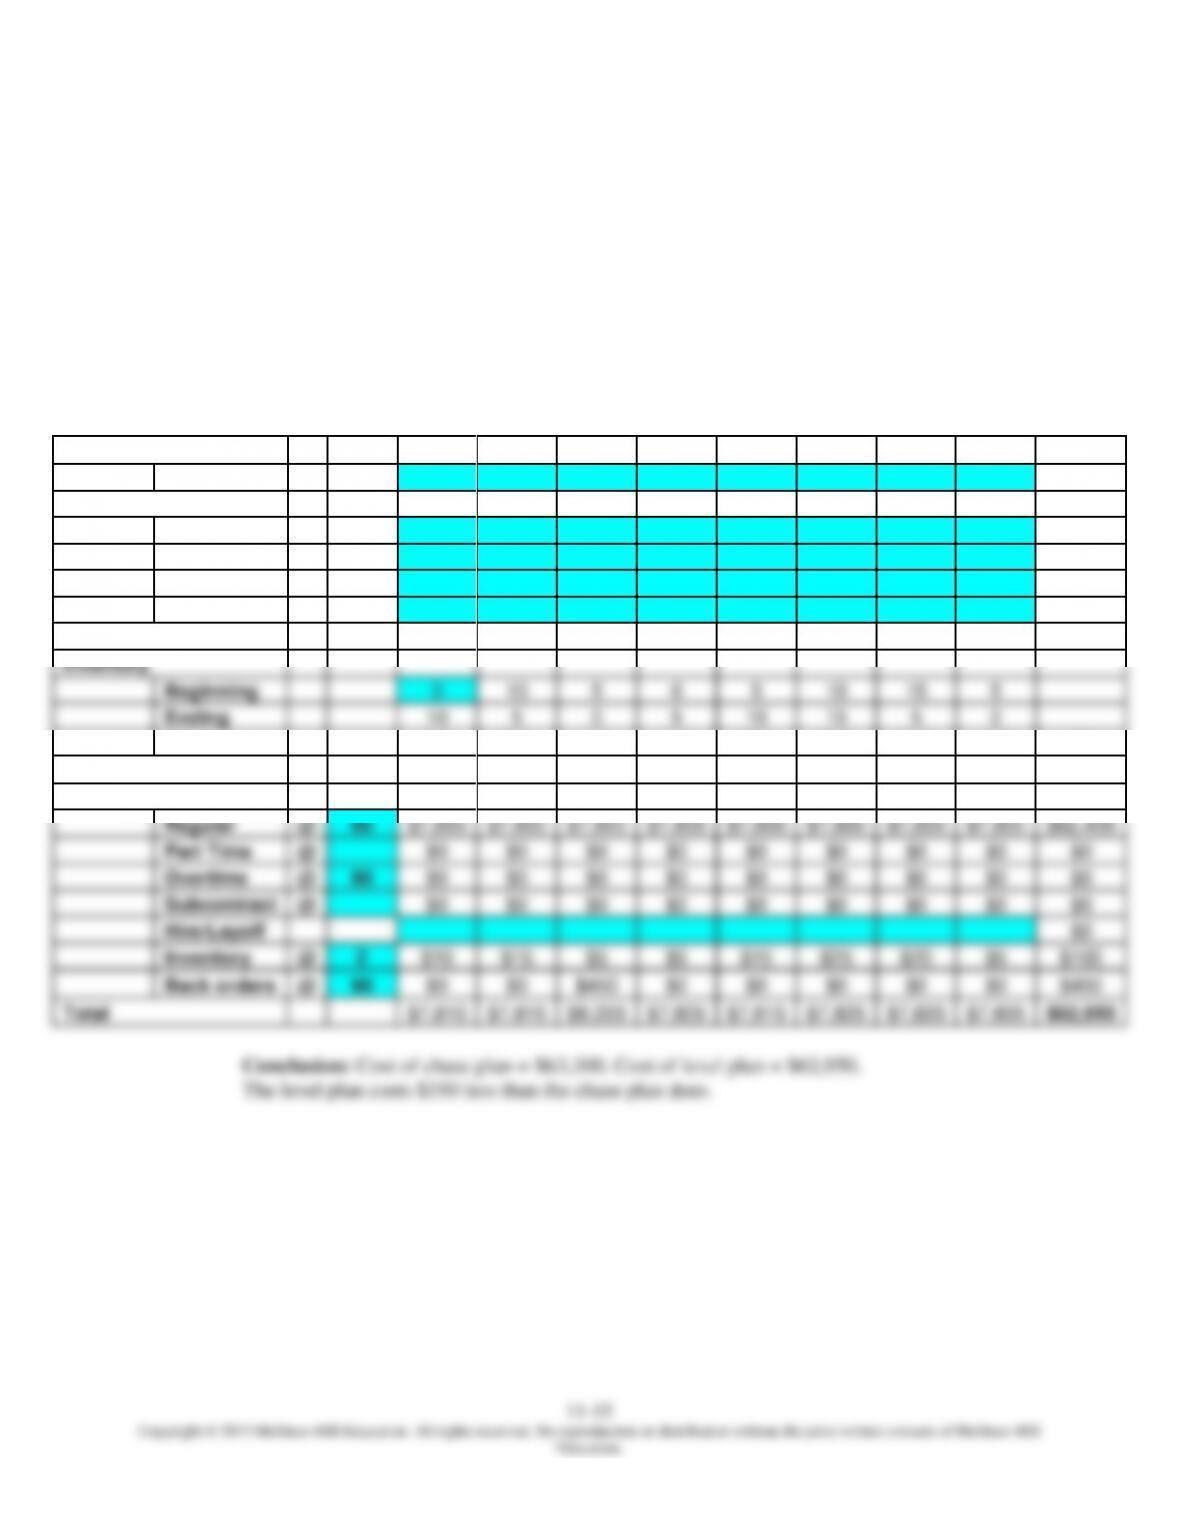
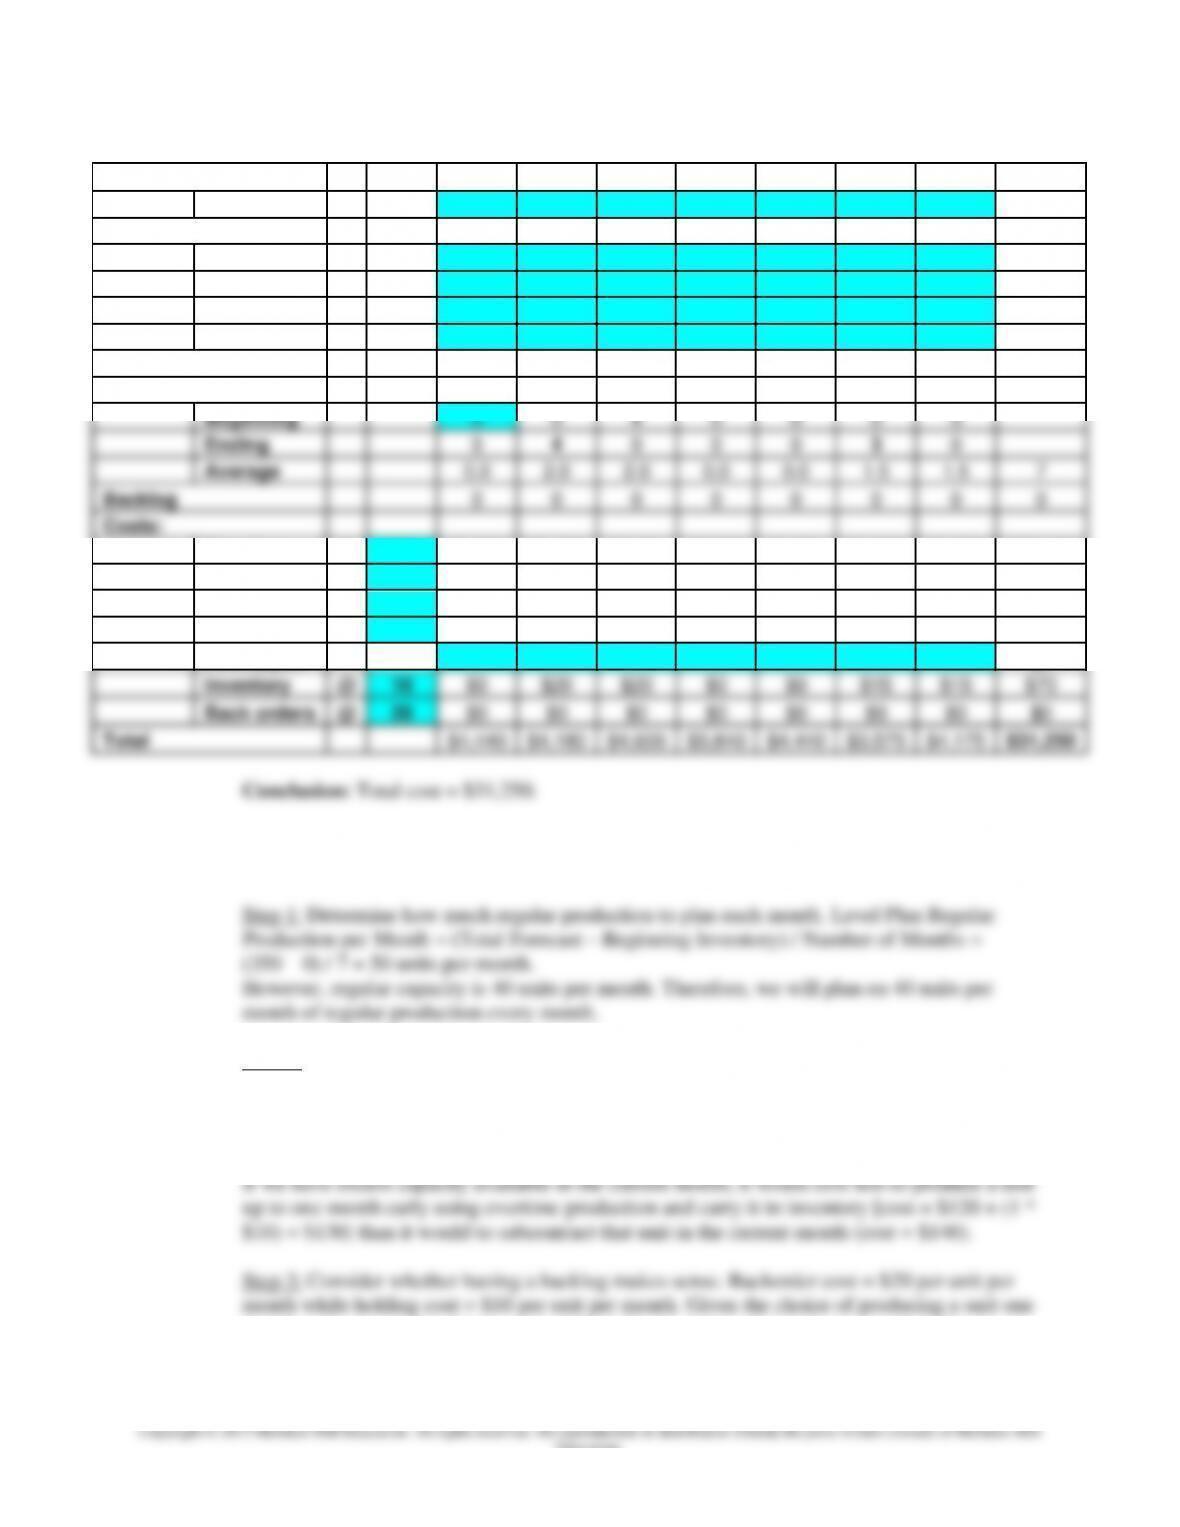
Final Plan: Using Overtime (Maximum of 40 Units per Month) & Subcontracting
Period
1
2
3
4
5
6
Total
Forecast
380
400
420
440
460
480
2,580
Output
Regular
400
400
400
400
400
400
2,400
Part Time
0
Overtime
40
40
40
120
Subcontract
20
40
60
Output – Forecast
20
0
–20
0
0
0
0
Inventory
Beginning
0
20
20
0
0
0
Ending
20
20
0
0
0
0
Average
10
20
10
0
0
0
40
Backlog
0
0
0
0
0
0
0
Costs:
Regular
@
25
$10,000
$10,000
$10,000
$10,000
$10,000
$10,000
$60,000
Part Time
@
$0
$0
$0
$0
$0
$0
$0
Overtime
@
40
$0
$0
$0
$1,600
$1,600
$1,600
$4,800
Subcontract
@
60
$0
$0
$0
$0
$1,200
$2,400
$3,600
Hire/Layoff
$0
Inventory
@
15
$150
$300
$150
$0
$0
$0
$600
Back orders
@
$0
$0
$0
$0
$0
$0
$0
Total
$10,150
$10,300
$10,150
$11,600
$12,800
$14,000
$69,000
Chapter 11 – Aggregate Planning and Master Scheduling
11–12
Education.
4. Given:
Use regular output of 550 units per month. Use a maximum of 40 units of overtime per month
and a maximum of 10 units of subcontracting per month to make up any shortages. Regular cost
per unit = $20. Overtime cost per unit = $30. Subcontracting cost per unit = $25.
Carrying cost per unit per month = $10 and is assessed on average inventory. Backlog
(backorder) cost per unit per month = $18.
Month
1
2
3
4
5
6
Forecast
540
540
570
590
600
580
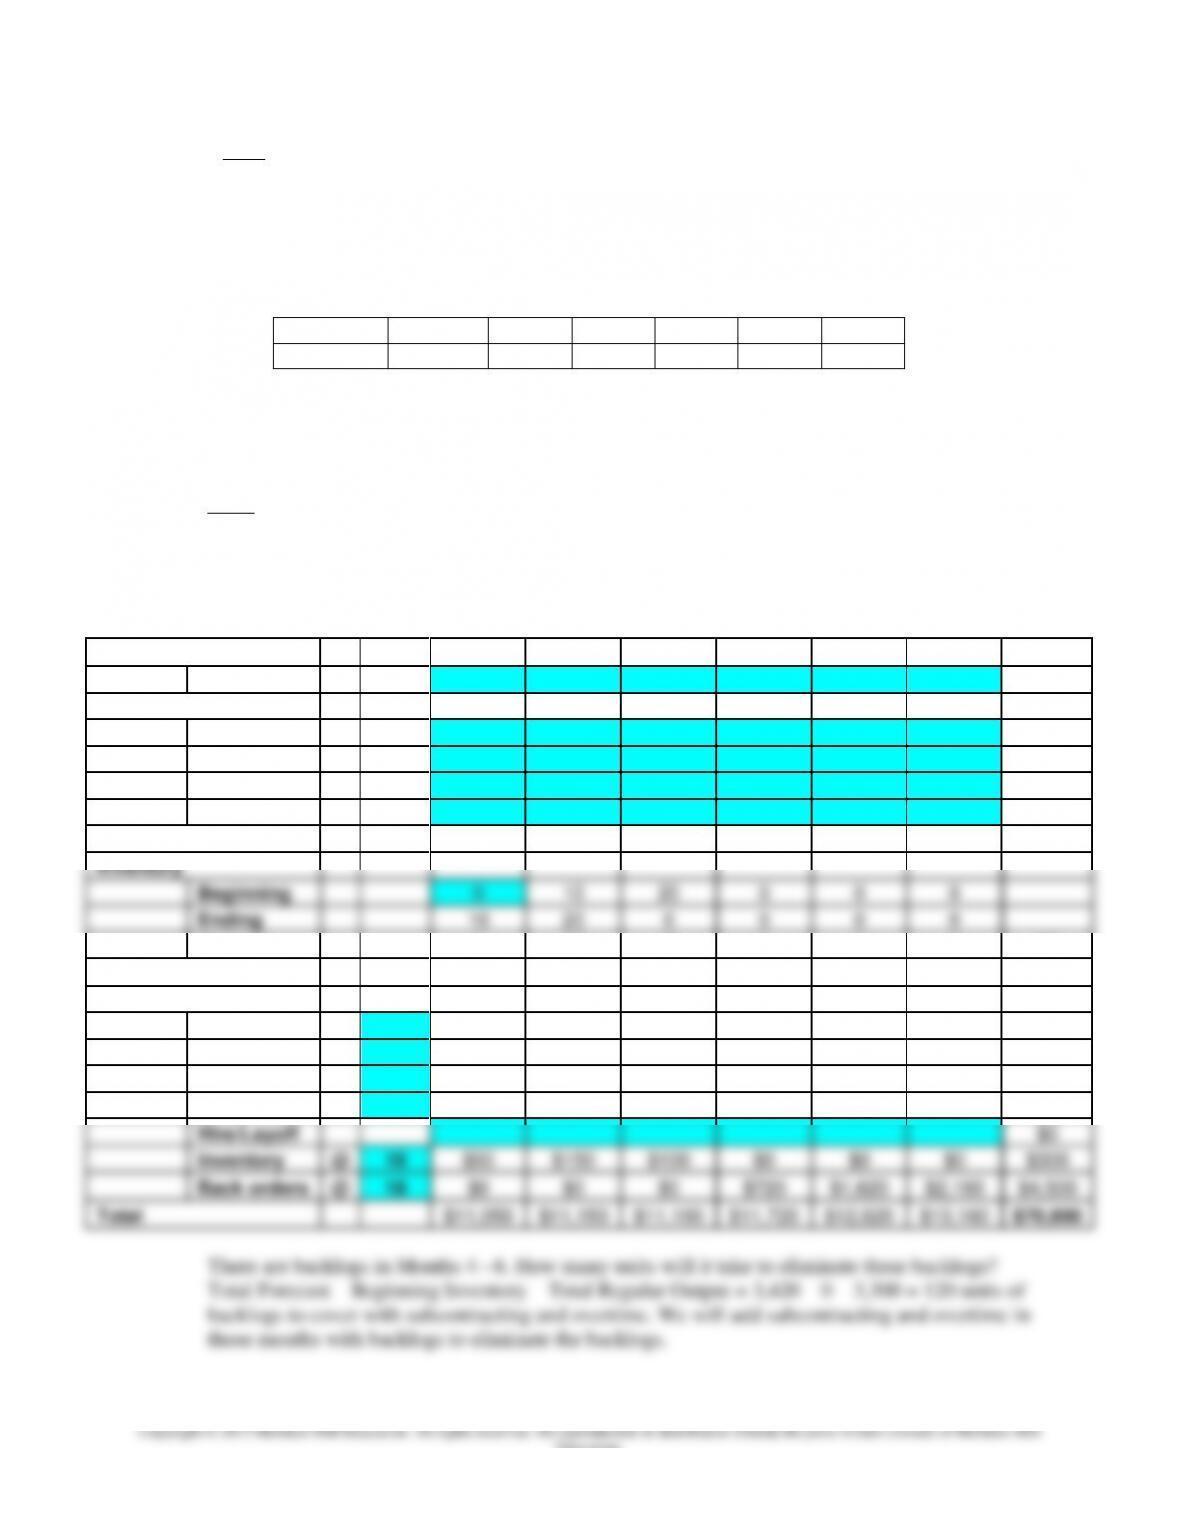
Determine the cost of the aggregate plan given the limits on overtime and subcontracting:
Initial Plan: No Overtime & No Subcontracting
Note: Observe the months with backlog. Those are the months in which we must consider
overtime and subcontracting. Our first option will be subcontracting ($25 per unit) because it
costs less than overtime does ($30 per unit). We can determine the total amount that we will need
to cover using subcontracting and overtime as follows:
Total Forecast – Beginning Inventory – Total Regular Output
Period
1
2
3
4
5
6
Total
Forecast
540
540
570
590
600
580
3,420
Output
Regular
550
550
550
550
550
550
3,300
Part Time
0
Overtime
0
Subcontract
0
Output – Forecast
10
10
–20
–40
–50
–30
–120
Inventory
Beginning
0
10
20
0
0
0
Ending
10
20
0
0
0
0
Average
5
15
10
0
0
0
30
Backlog
0
0
0
40
90
120
250
Costs:
Regular
@
20
$11,000
$11,000
$11,000
$11,000
$11,000
$11,000
$66,000
Part Time
@
$0
$0
$0
$0
$0
$0
$0
Overtime
@
30
$0
$0
$0
$0
$0
$0
$0
Subcontract
@
25
$0
$0
$0
$0
$0
$0
$0
Hire/Layoff
$0
Inventory
@
10
$50
$150
$100
$0
$0
$0
$300
Back orders
@
18
$0
$0
$0
$720
$1,620
$2,160
$4,500
Total
$11,050
$11,150
$11,100
$11,720
$12,620
$13,160
$70,800
Chapter 11 – Aggregate Planning and Master Scheduling
Education.
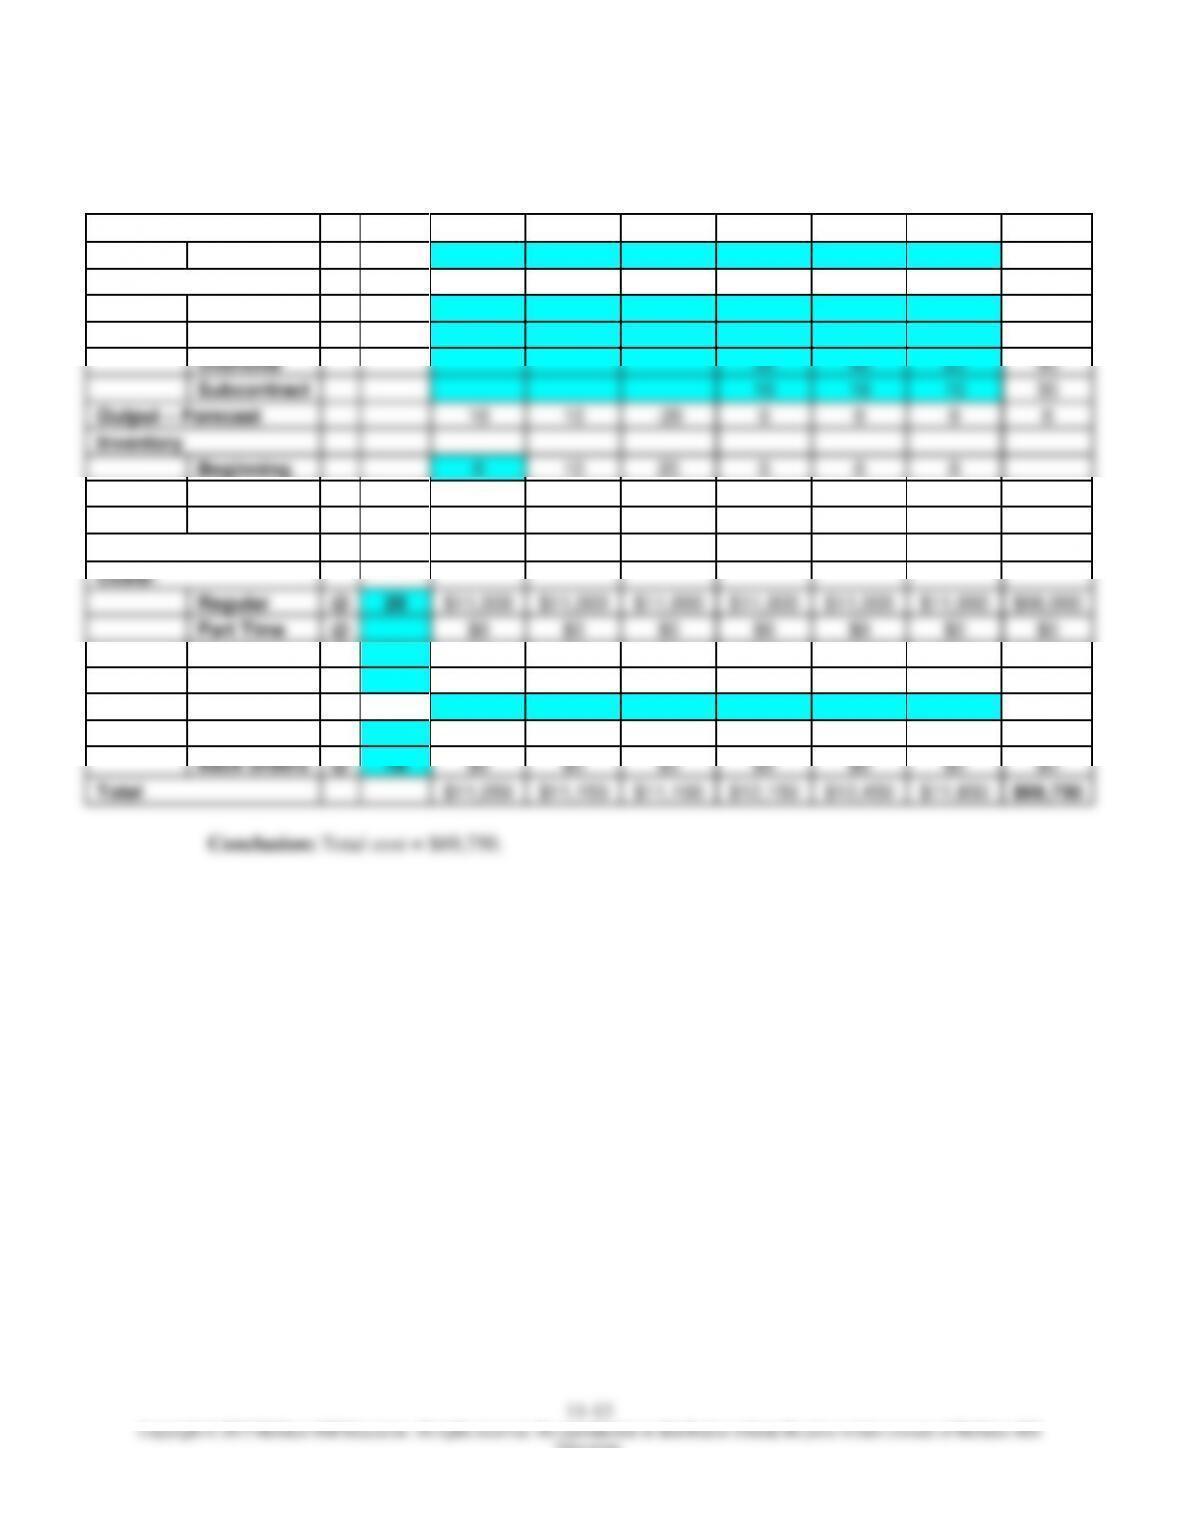
Final Plan: Using Subcontracting (Maximum of 10 Units per Month) &
Overtime (Maximum of 40 Units per Month)
Period
1
2
3
4
5
6
Total
Forecast
540
540
570
590
600
580
3,420
Output
Regular
550
550
550
550
550
550
3,300
Part Time
0
Overtime
30
40
20
90
Subcontract
10
10
10
30
Output – Forecast
10
10
–20
0
0
0
0
Inventory
Beginning
0
10
20
0
0
0
Ending
10
20
0
0
0
0
Average
5
15
10
0
0
0
30
Backlog
0
0
0
0
0
0
0
Costs:
Regular
@
20
$11,000
$11,000
$11,000
$11,000
$11,000
$11,000
$66,000
Part Time
@
$0
$0
$0
$0
$0
$0
$0
Overtime
@
30
$0
$0
$0
$900
$1,200
$600
$2,700
Subcontract
@
25
$0
$0
$0
$250
$250
$250
$750
Hire/Layoff
$0
Inventory
@
10
$50
$150
$100
$0
$0
$0
$300
Back orders
@
18
$0
$0
$0
$0
$0
$0
$0
Total
$11,050
$11,150
$11,100
$12,150
$12,450
$11,850
$69,750
Chapter 11 – Aggregate Planning and Master Scheduling
Education.
5. Given:
Regular output capacity is 130 units per month. Regular cost per unit = $60. Overtime cost per
unit = $90. Beginning inventory is 0 units. We have the forecast of engine demand shown below:
Month
1
2
3
4
5
6
7
8
Total
Forecast
120
135
140
120
125
125
140
135
1,040
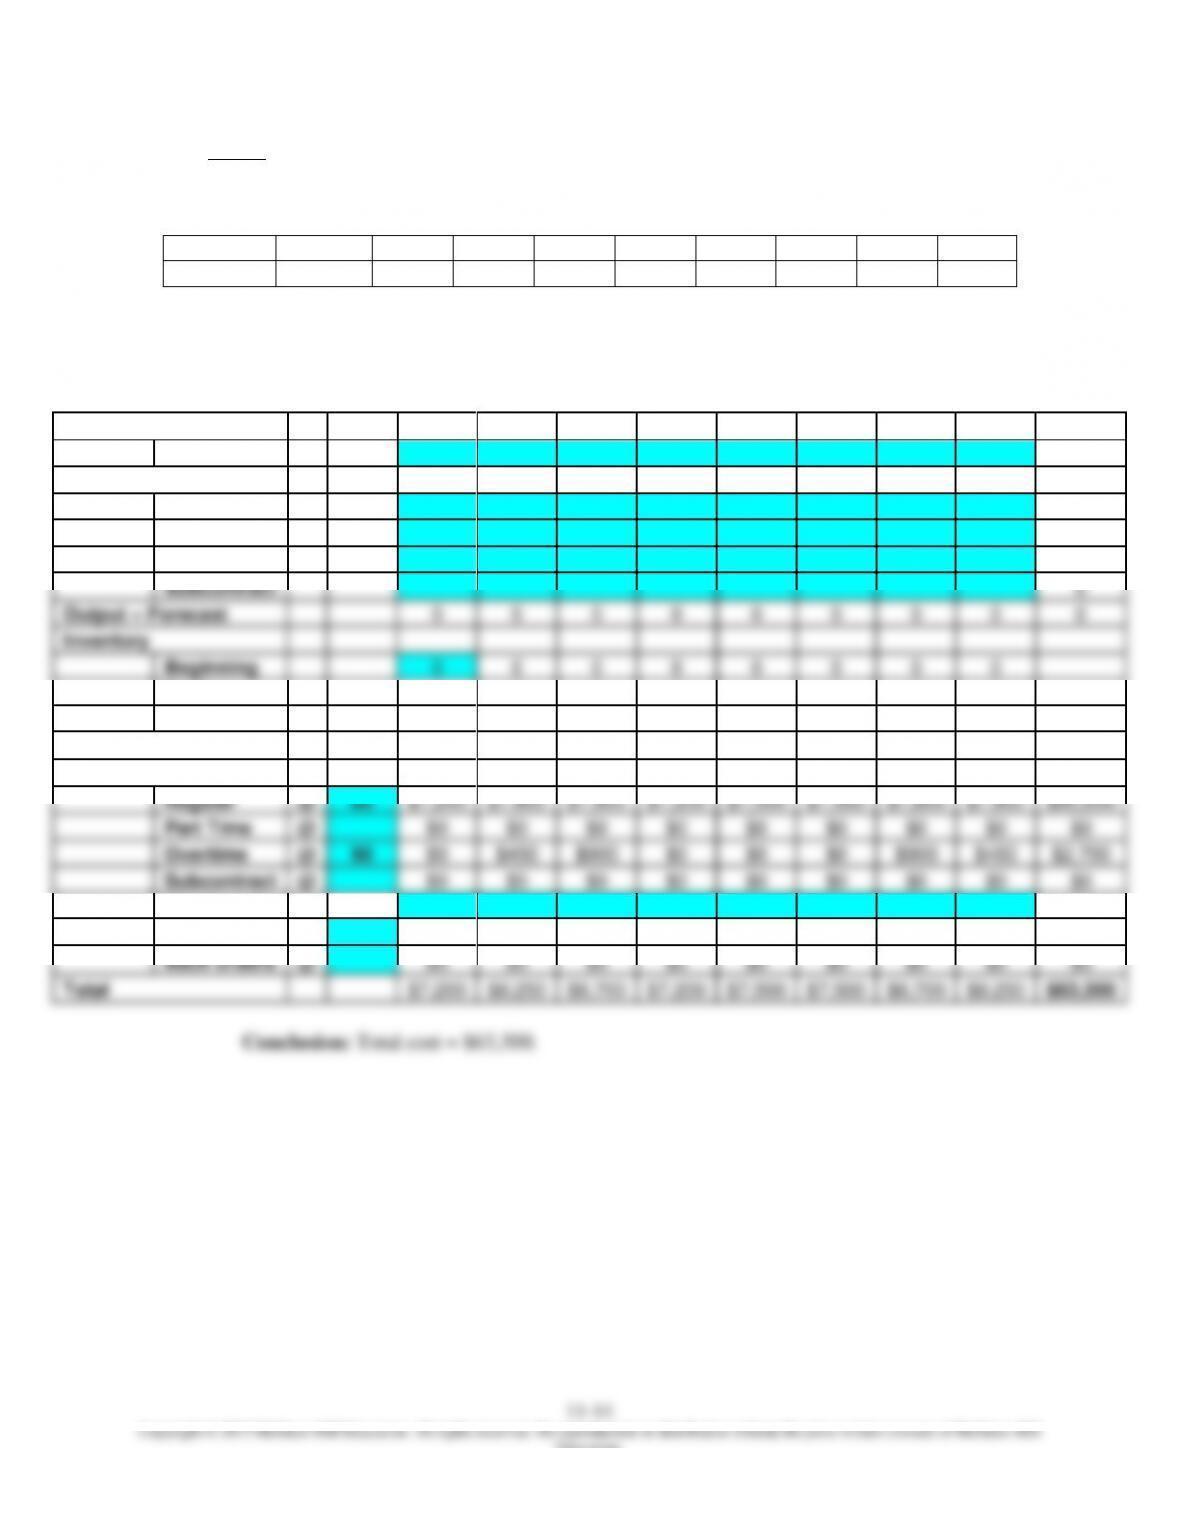
a. Develop a chase plan that matches the forecast. Calculate the cost of the plan.
Adjust regular time and overtime production to meet demand each period:
Period
1
2
3
4
5
6
7
8
Total
Forecast
120
135
140
120
125
125
140
135
1,040
Output
Regular
120
130
130
120
125
125
130
130
1,010
Part Time
0
Overtime
5
10
10
5
30
Subcontract
0
Output – Forecast
0
0
0
0
0
0
0
0
0
Inventory
Beginning
0
0
0
0
0
0
0
0
Ending
0
0
0
0
0
0
0
0
Average
0
0
0
0
0
0
0
0
0
Backlog
0
0
0
0
0
0
0
0
0
Costs:
Regular
@
60
$7,200
$7,800
$7,800
$7,200
$7,500
$7,500
$7,800
$7,800
$60,600
Part Time
@
$0
$0
$0
$0
$0
$0
$0
$0
$0
Overtime
@
90
$0
$450
$900
$0
$0
$0
$900
$450
$2,700
Subcontract
@
$0
$0
$0
$0
$0
$0
$0
$0
$0
Hire/Layoff
$0
Inventory
@
$0
$0
$0
$0
$0
$0
$0
$0
$0
Back orders
@
$0
$0
$0
$0
$0
$0
$0
$0
$0
Total
$7,200
$8,250
$8,700
$7,200
$7,500
$7,500
$8,700
$8,250
$63,300
Chapter 11 – Aggregate Planning and Master Scheduling
b. Develop a level plan that uses inventory to absorb fluctuations. Compare the costs of the
level plan to the costs of the chase plan from Part a. Inventory carrying cost per unit per
month = $2. Backlog cost per unit per month = $90. There should be no backlog in the final
month.
Level Plan Regular Production per Month = (Total Forecast – Beginning Inventory) /
Number of Months.
Level Plan Regular Production per Month = (1,040 – 0) / 8 = 130 units per month.
Is this number of units per month feasible? Yes, the regular time capacity is 130 units per
month; therefore, this is the amount that we plan for regular production each month.
Period
1
2
3
4
5
6
7
8
Total
Forecast
120
135
140
120
125
125
140
135
1,040
Output
Regular
130
130
130
130
130
130
130
130
1,040
Part Time
0
Overtime
0
Subcontract
0
Output – Forecast
10
-5
–10
10
5
5
–10
-5
0
Inventory
Beginning
0
10
5
0
5
10
15
5
Ending
10
5
0
5
10
15
5
0
Average
5.0
7.5
2.5
2.5
7.5
12.5
10.0
2.5
50
Backlog
0
0
5
0
0
0
0
0
5
Costs:
Regular
@
60
$7,800
$7,800
$7,800
$7,800
$7,800
$7,800
$7,800
$7,800
$62,400
Part Time
@
$0
$0
$0
$0
$0
$0
$0
$0
$0
Overtime
@
90
$0
$0
$0
$0
$0
$0
$0
$0
$0
Subcontract
@
$0
$0
$0
$0
$0
$0
$0
$0
$0
Hire/Layoff
$0
Inventory
@
2
$10
$15
$5
$5
$15
$25
$20
$5
$100
Back orders
@
90
$0
$0
$450
$0
$0
$0
$0
$0
$450
Total
$7,810
$7,815
$8,255
$7,805
$7,815
$7,825
$7,820
$7,805
$62,950
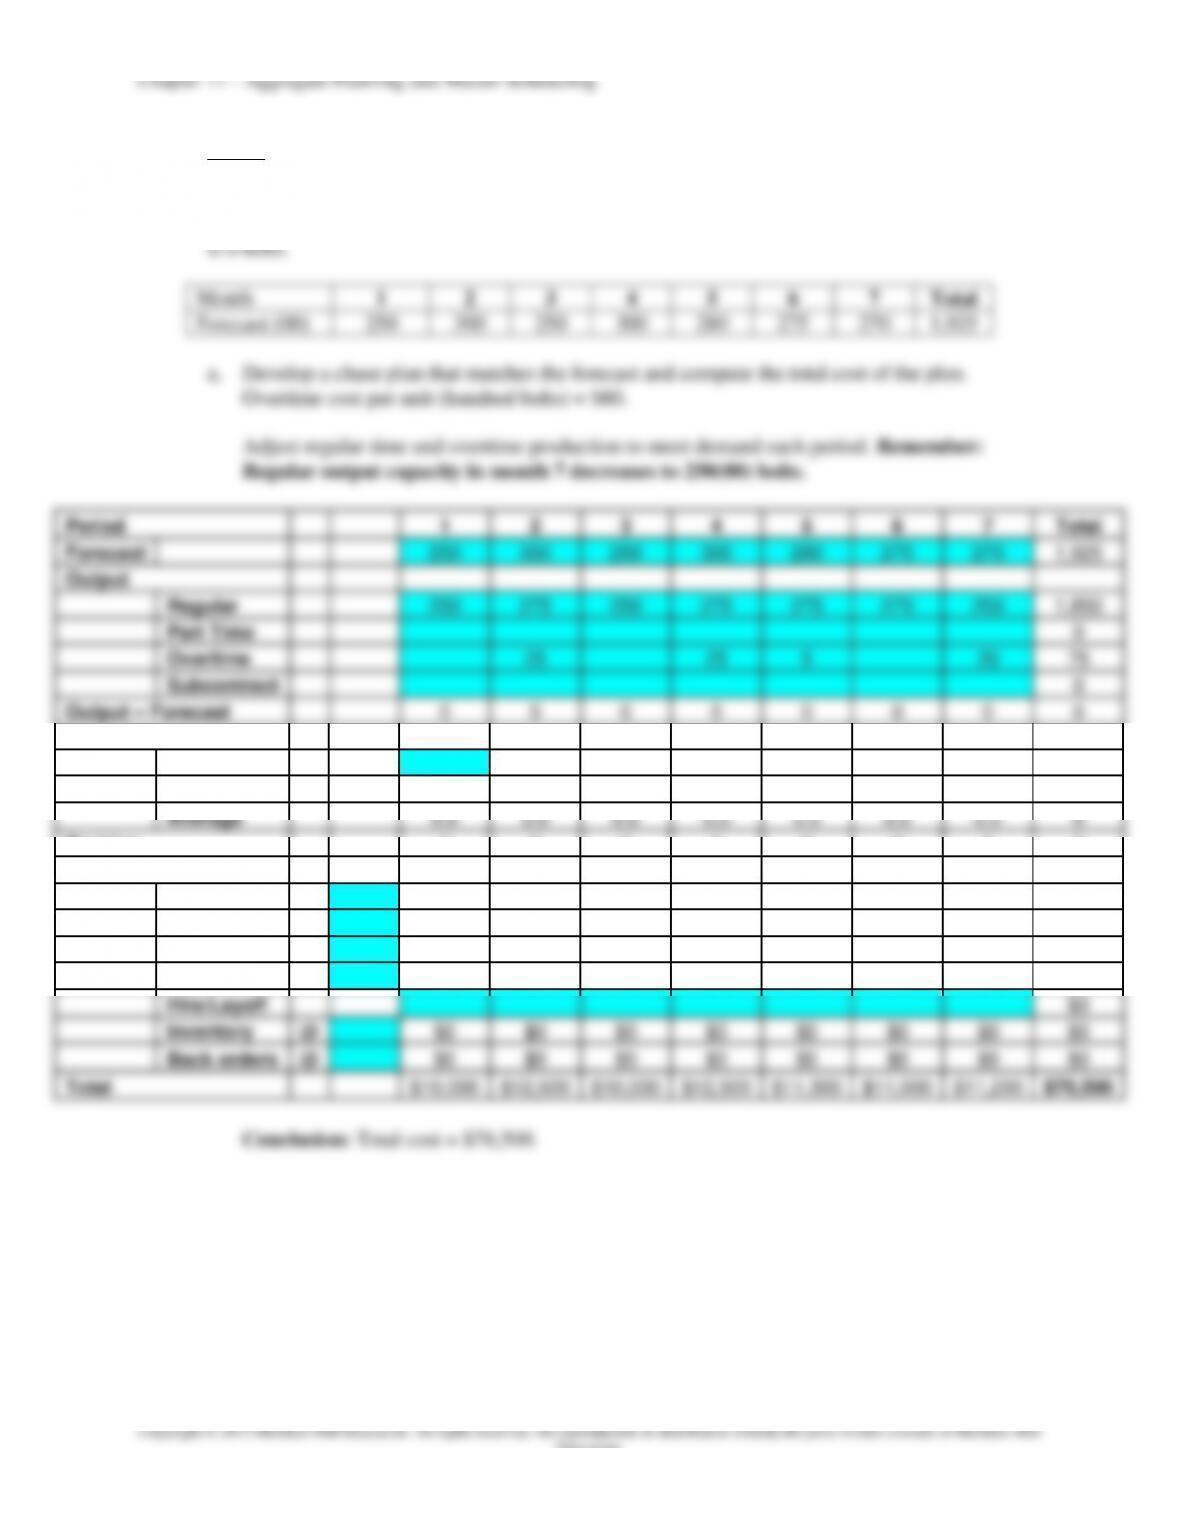
6. Given:
The forecasts for bolts of cloth are shown in the table below. The figures are in hundreds of bolts.
Regular output capacity is 275(00) bolts per month, except for Month 7 when regular output
capacity will be 250(00) bolts. Regular cost per unit (hundred bolts) = $40. Beginning inventory
Chapter 11 – Aggregate Planning and Master Scheduling
Education.
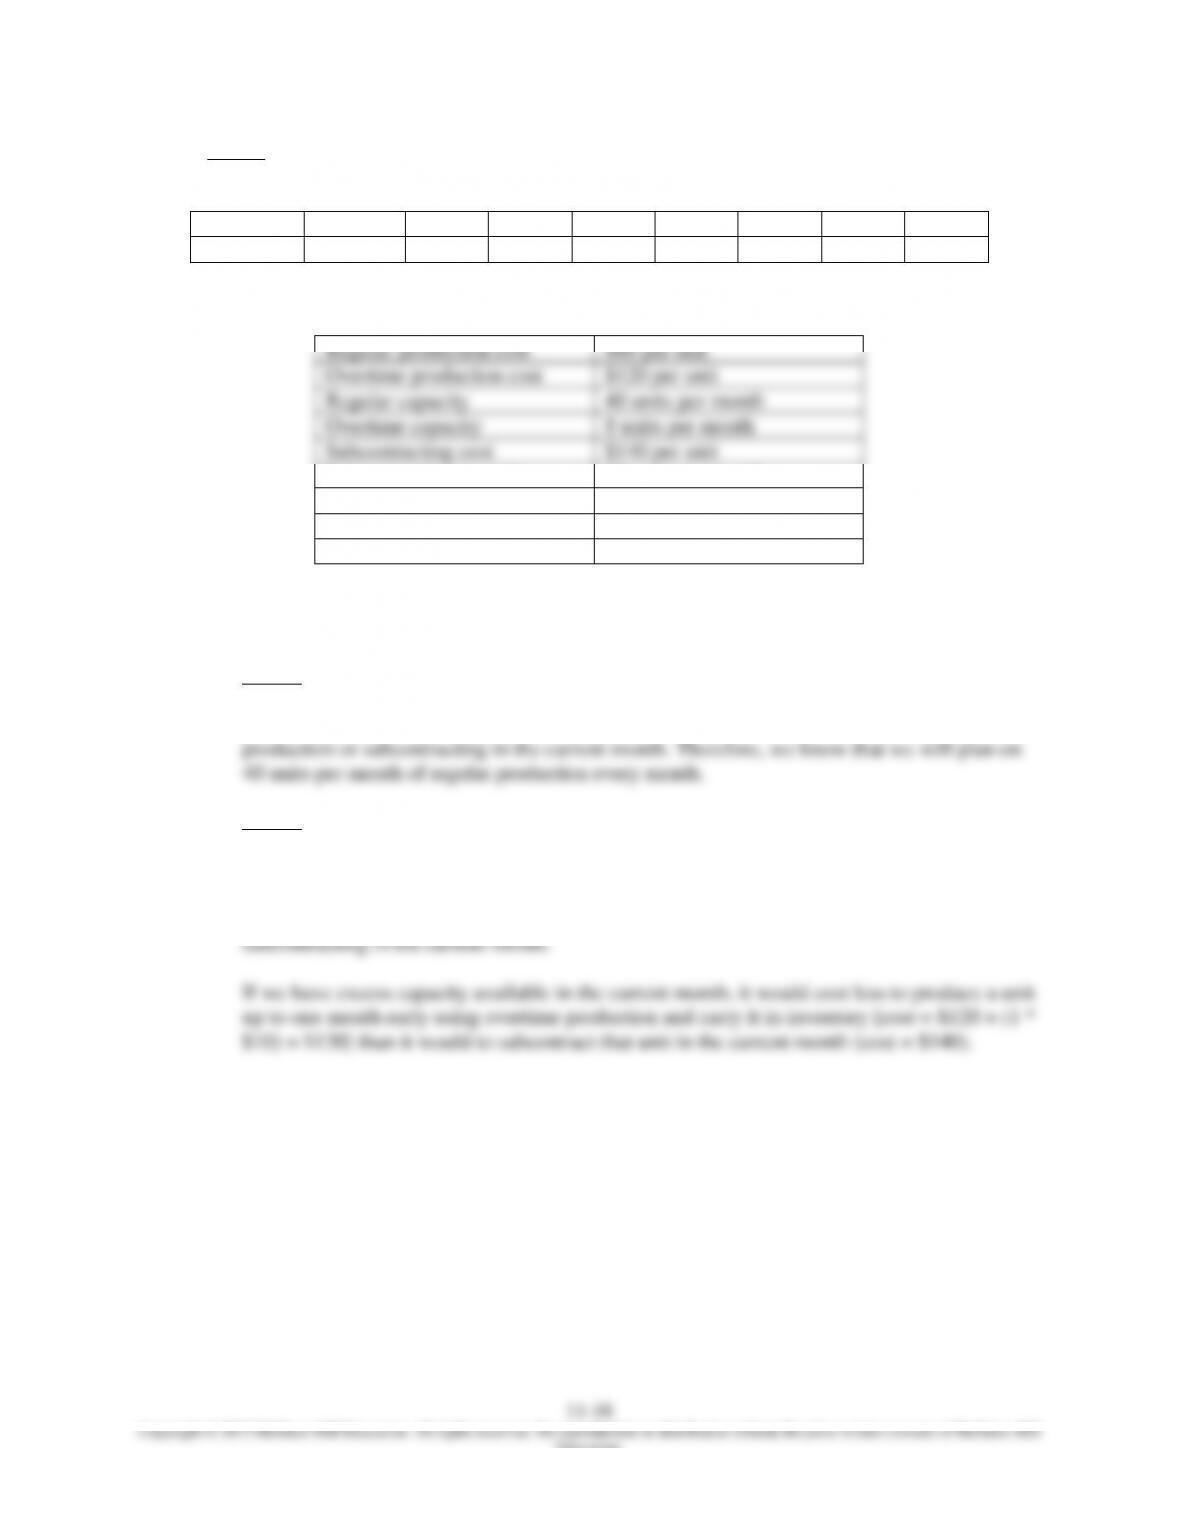
7. Given:
We have the aggregate forecasts shown below:
Month
Mar
Apr
May
Jun
Jul
Aug
Sep
Total
Forecast
50
44
55
60
50
40
51
350
We have the following additional information:
Regular production cost
$80 per unit
Overtime production cost
$120 per unit
Regular capacity
40 units per month
Overtime capacity
8 units per month
Subcontracting cost
$140 per unit
Subcontracting capacity
12 units per month
Holding cost
$10 per unit per month
Backorder cost
$20 per unit
Beginning inventory
0 units
a. Use regular production. Supplement using inventory, overtime, and subcontracting as
needed. No backlogs allowed.
Step 1: Determine how much regular production to plan each month. Regular capacity is 40
units per month, and each month’s forecast is at least 40 units. Furthermore, we know that
producing a unit using regular production costs less than producing that unit using overtime
Step 2: Compare the costs of overtime production to subcontracting:
Overtime production cost per unit = $120.
Subcontracting cost per unit = $140.
Therefore, using overtime production in the current month always is preferred to
Chapter 11 – Aggregate Planning and Master Scheduling
11–19
Education.
Period
Mar
Apr
May
Jun
Jul
Aug
Sep
Total
Forecast
50
44
55
60
50
40
51
350
Output
Regular
40
40
40
40
40
40
40
280
Part Time
0
Overtime
8
8
8
8
8
3
8
51
Subcontract
2
0
3
12
2
19
Output – Forecast
0
4
-4
0
0
3
-3
0
Inventory
Beginning
0
0
4
0
0
0
3
Ending
0
4
0
0
0
3
0
Average
0.0
2.0
2.0
0.0
0.0
1.5
1.5
7
Backlog
0
0
0
0
0
0
0
0
Costs:
Regular
@
80
$3,200
$3,200
$3,200
$3,200
$3,200
$3,200
$3,200
$22,400
Part Time
@
$0
$0
$0
$0
$0
$0
$0
$0
Overtime
@
120
$960
$960
$960
$960
$960
$360
$960
$6,120
Subcontract
@
140
$280
$0
$420
$1,680
$280
$0
$0
$2,660
Hire/Layoff
$0
Inventory
@
10
$0
$20
$20
$0
$0
$15
$15
$70
Back orders
@
20
$0
$0
$0
$0
$0
$0
$0
$0
Total
$4,440
$4,180
$4,600
$5,840
$4,440
$3,575
$4,175
$31,250
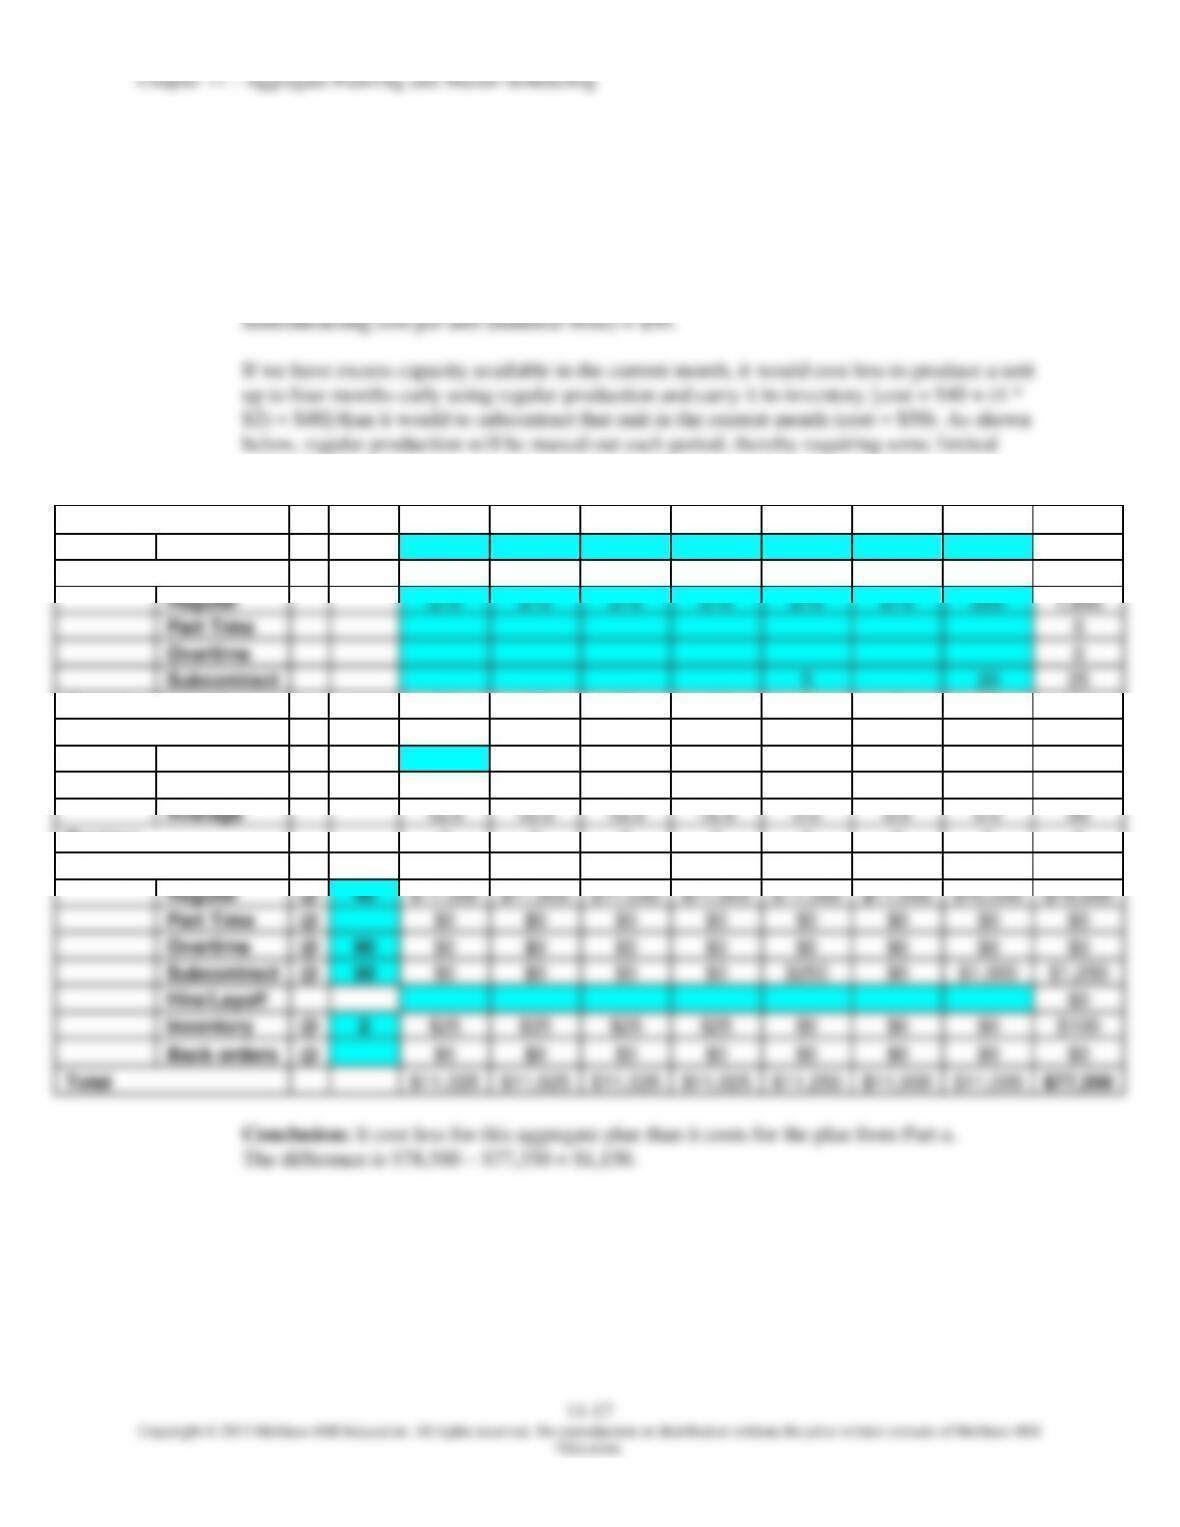
b. Use a level strategy. Use a combination of backlogs, subcontracting, and inventory to
handle variations in demand. There should be no backlog in the final month.
Step 2: Compare the costs of overtime production to subcontracting:
Overtime production cost per unit = $120.
Subcontracting cost per unit = $140.
Therefore, using overtime production in the current month always is preferred to
subcontracting in the current month.
month early or one month late, we would prefer to produce that unit one month early.
Chapter 11 – Aggregate Planning and Master Scheduling
Education.
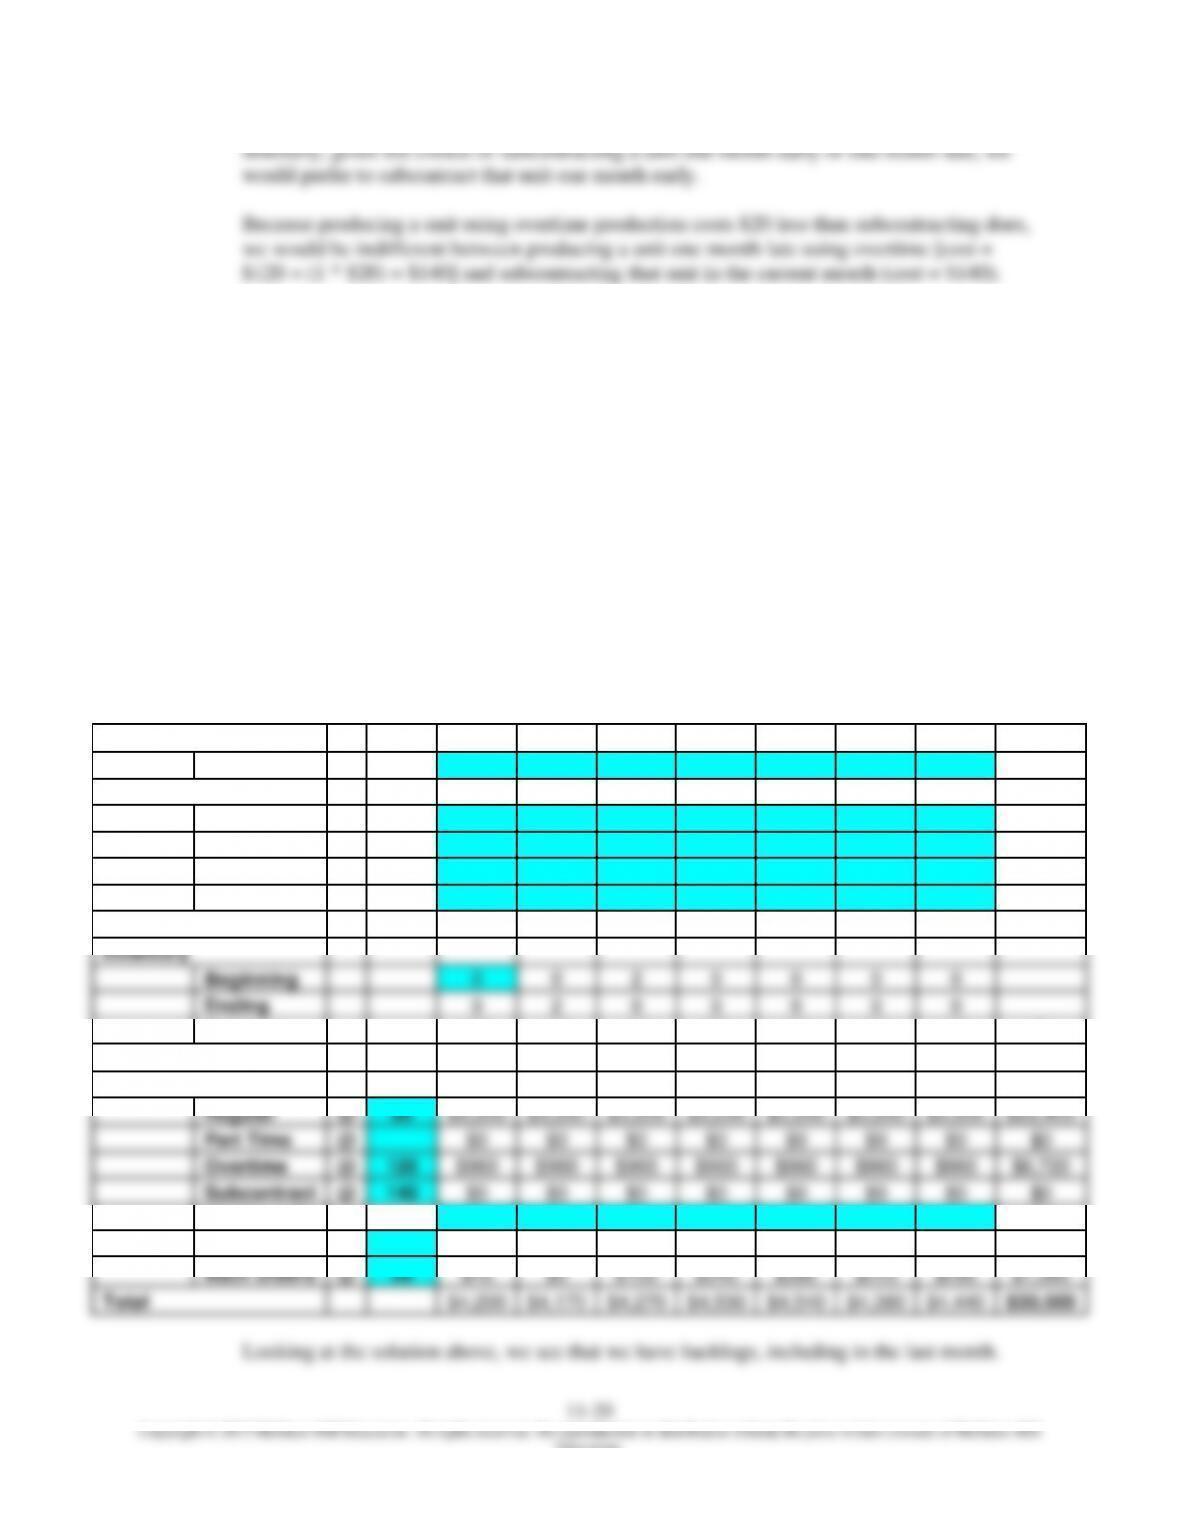
Summary of Rules for This Problem
1. We always prefer using overtime production in the current month over subcontracting in
the current month.
2. If we have excess capacity available in the current month, it would cost less to produce a
unit up to one month early using overtime production and carry it in inventory than it
would to subcontract that unit in the current month.
3. We prefer using overtime one month early over one month late.
4. We prefer using subcontracting one month early over one month late.
5. We are indifferent between producing a unit one month late using overtime and
subcontracting that unit in the current month.
As we apply the rules listed above, we will see that we will maximize overtime production
each month as shown below:
Initial Solution – Using Regular Time & Overtime (No Subcontracting)
Period
1
2
3
4
5
6
7
Total
Forecast
50
44
55
60
50
40
51
350
Output
Regular
40
40
40
40
40
40
40
280
Part Time
0
Overtime
8
8
8
8
8
8
8
56
Subcontract
0
Output – Forecast
-2
4
-7
–12
-2
8
-3
–14
Inventory
Beginning
0
0
2
0
0
0
0
Ending
0
2
0
0
0
0
0
Average
0.0
1.0
1.0
0.0
0.0
0.0
0.0
2
Backlog
2
0
5
17
19
11
14
68
Costs:
Regular
@
80
$3,200
$3,200
$3,200
$3,200
$3,200
$3,200
$3,200
$22,400
Part Time
@
$0
$0
$0
$0
$0
$0
$0
$0
Overtime
@
120
$960
$960
$960
$960
$960
$960
$960
$6,720
Subcontract
@
140
$0
$0
$0
$0
$0
$0
$0
$0
Hire/Layoff
$0
Inventory
@
10
$0
$10
$10
$0
$0
$0
$0
$20
Back orders
@
20
$40
$0
$100
$340
$380
$220
$280
$1,360
Total
$4,200
$4,170
$4,270
$4,500
$4,540
$4,380
$4,440
$30,500