Chapter 10 – Quality Control
Education.
Median Test:
Observed number of runs = 13
Expected number of runs (N = total number of observations = 20):
(round to one decimal)
Standard deviation:
Up/Down Test:
(round to two decimals)
Chapter 10 – Quality Control
20. Given:
A teller had the following service times for 20 randomly selected customers:
SAMPLE
1
2
3
4
4.5
4.6
4.5
4.7
4.2
4.5
4.6
4.6
4.2
4.4
4.4
4.8
4.3
4.7
4.4
4.5
4.3
4.3
4.6
4.9
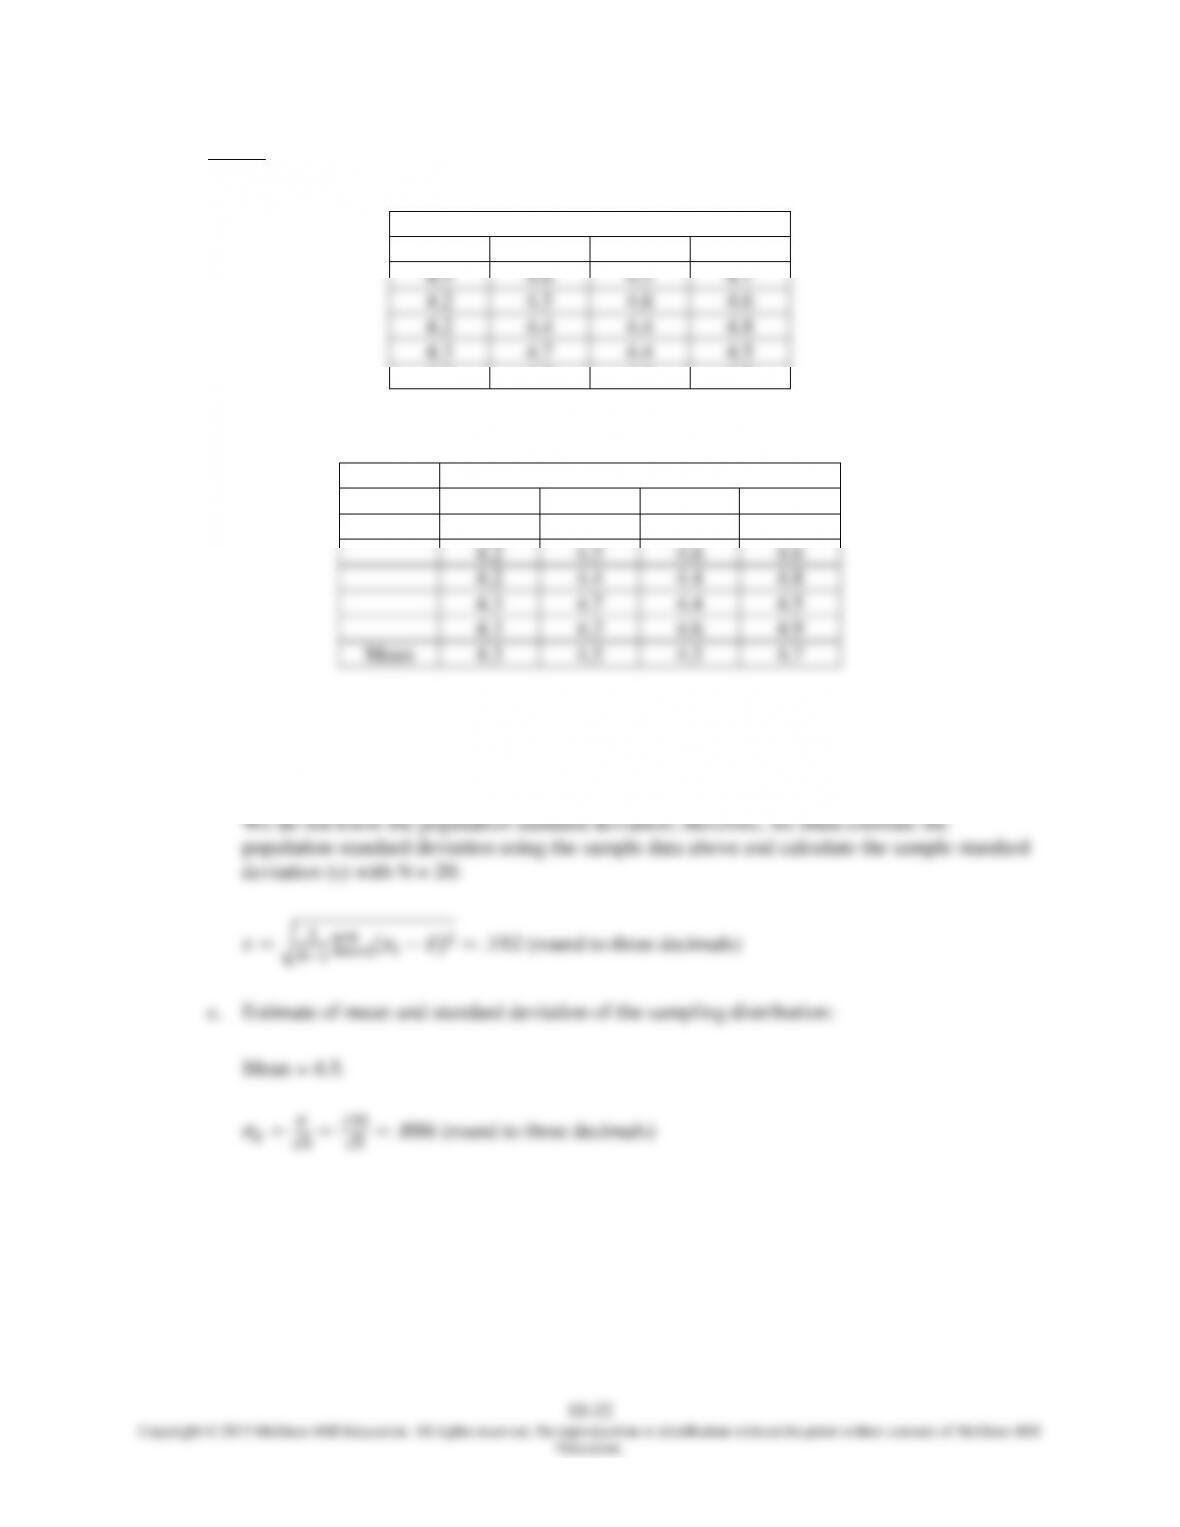
a. Determine the mean of each sample. Round to a maximum of three decimals.
SAMPLE
1
2
3
4
4.5
4.6
4.5
4.7
4.2
4.5
4.6
4.6
4.2
4.4
4.4
4.8
4.3
4.7
4.4
4.5
4.3
4.3
4.6
4.9
Mean
4.3
4.5
4.5
4.7
b. Estimate the mean and standard deviation of the process:
=
x = (4.3 + 4.5 + 4.5 + 4.7)/4 = 4.5
Chapter 10 – Quality Control
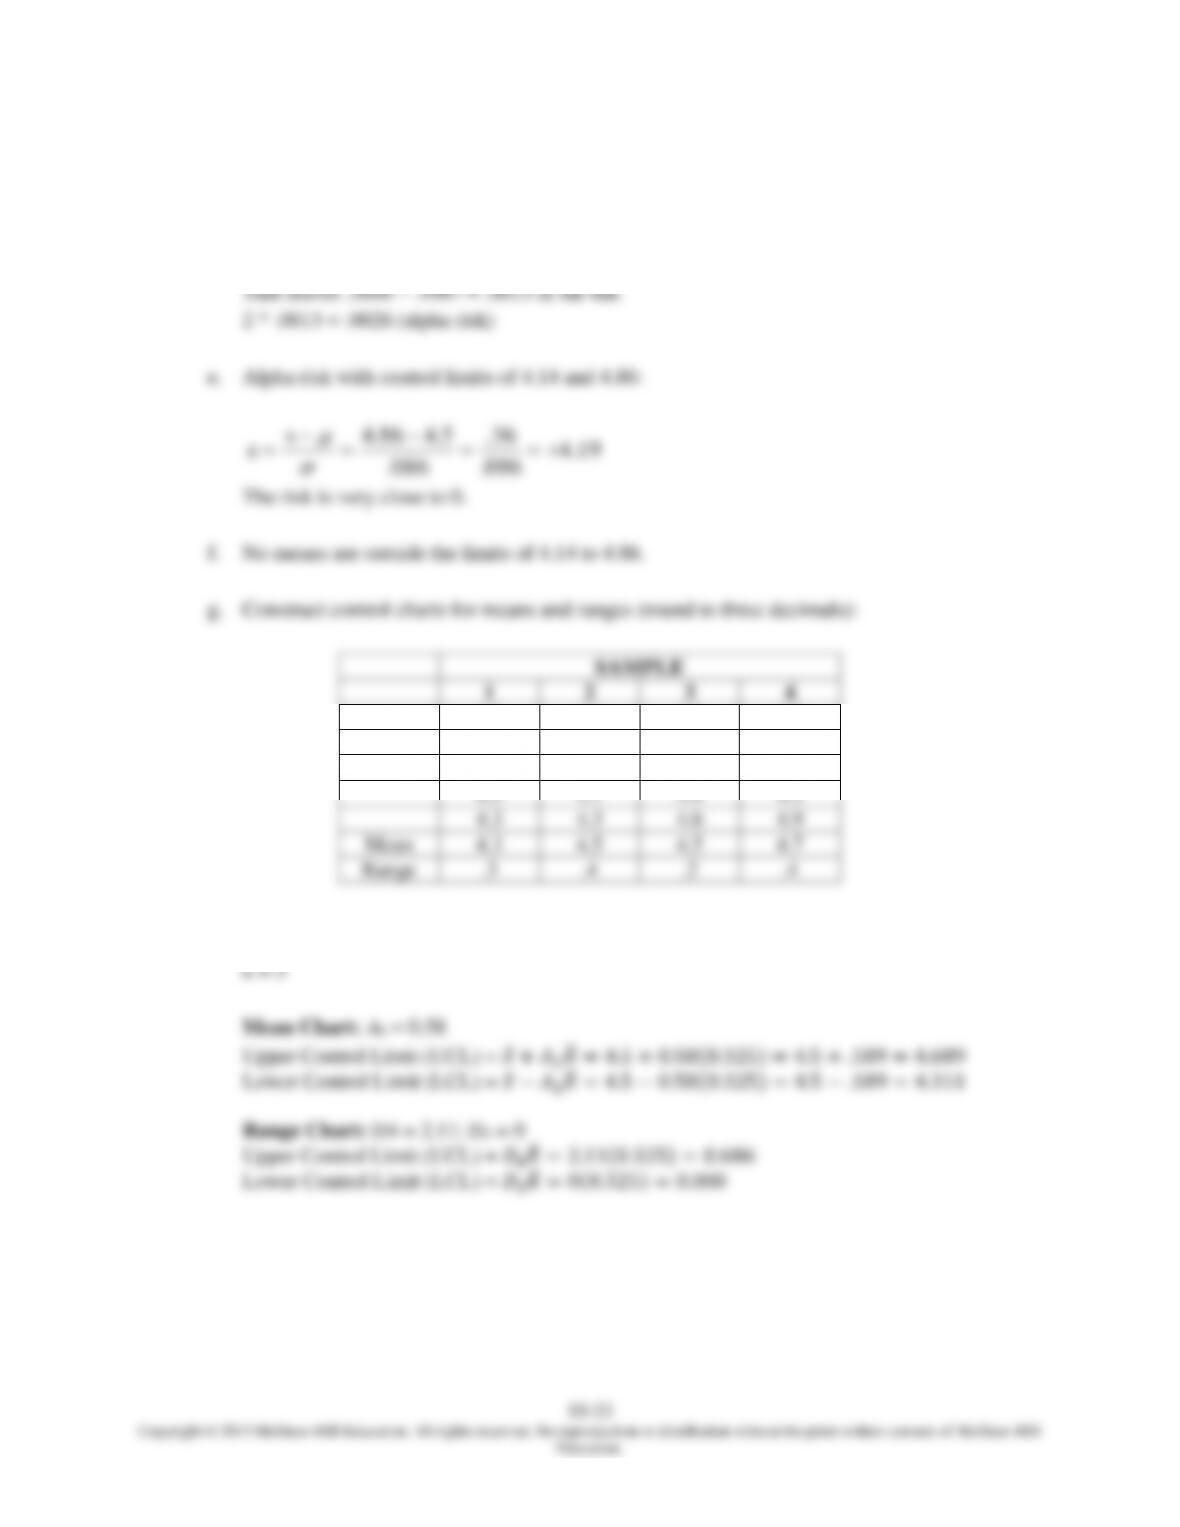
d. Three-sigma control limits (round to three decimals):
4.5 ± 3.00(.086) = 4.5 ± .258
UCL = 4.5 + .258 = 4.758
LCL = 4.5 – .258 = 4.242
Using Appendix B, Table A, z = + 3.00 corresponds to .4987 under the curve.
Chapter 10 – Quality Control
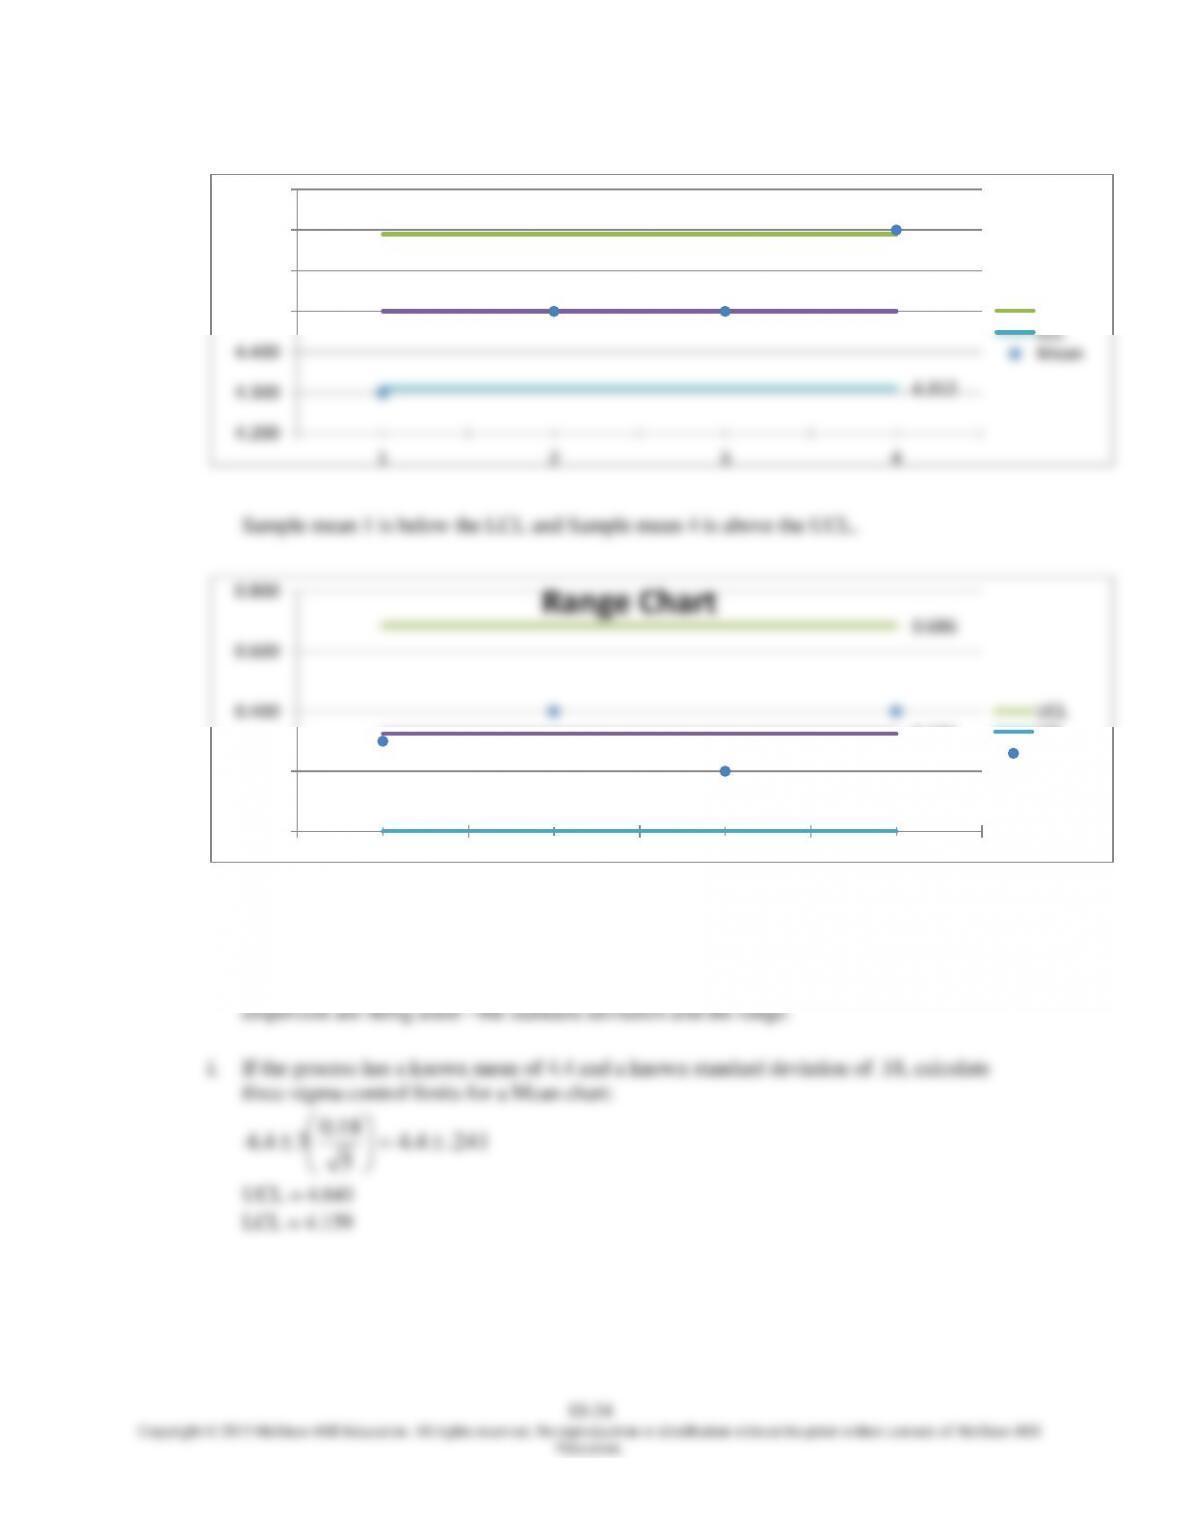
All sample ranges are within the limits.
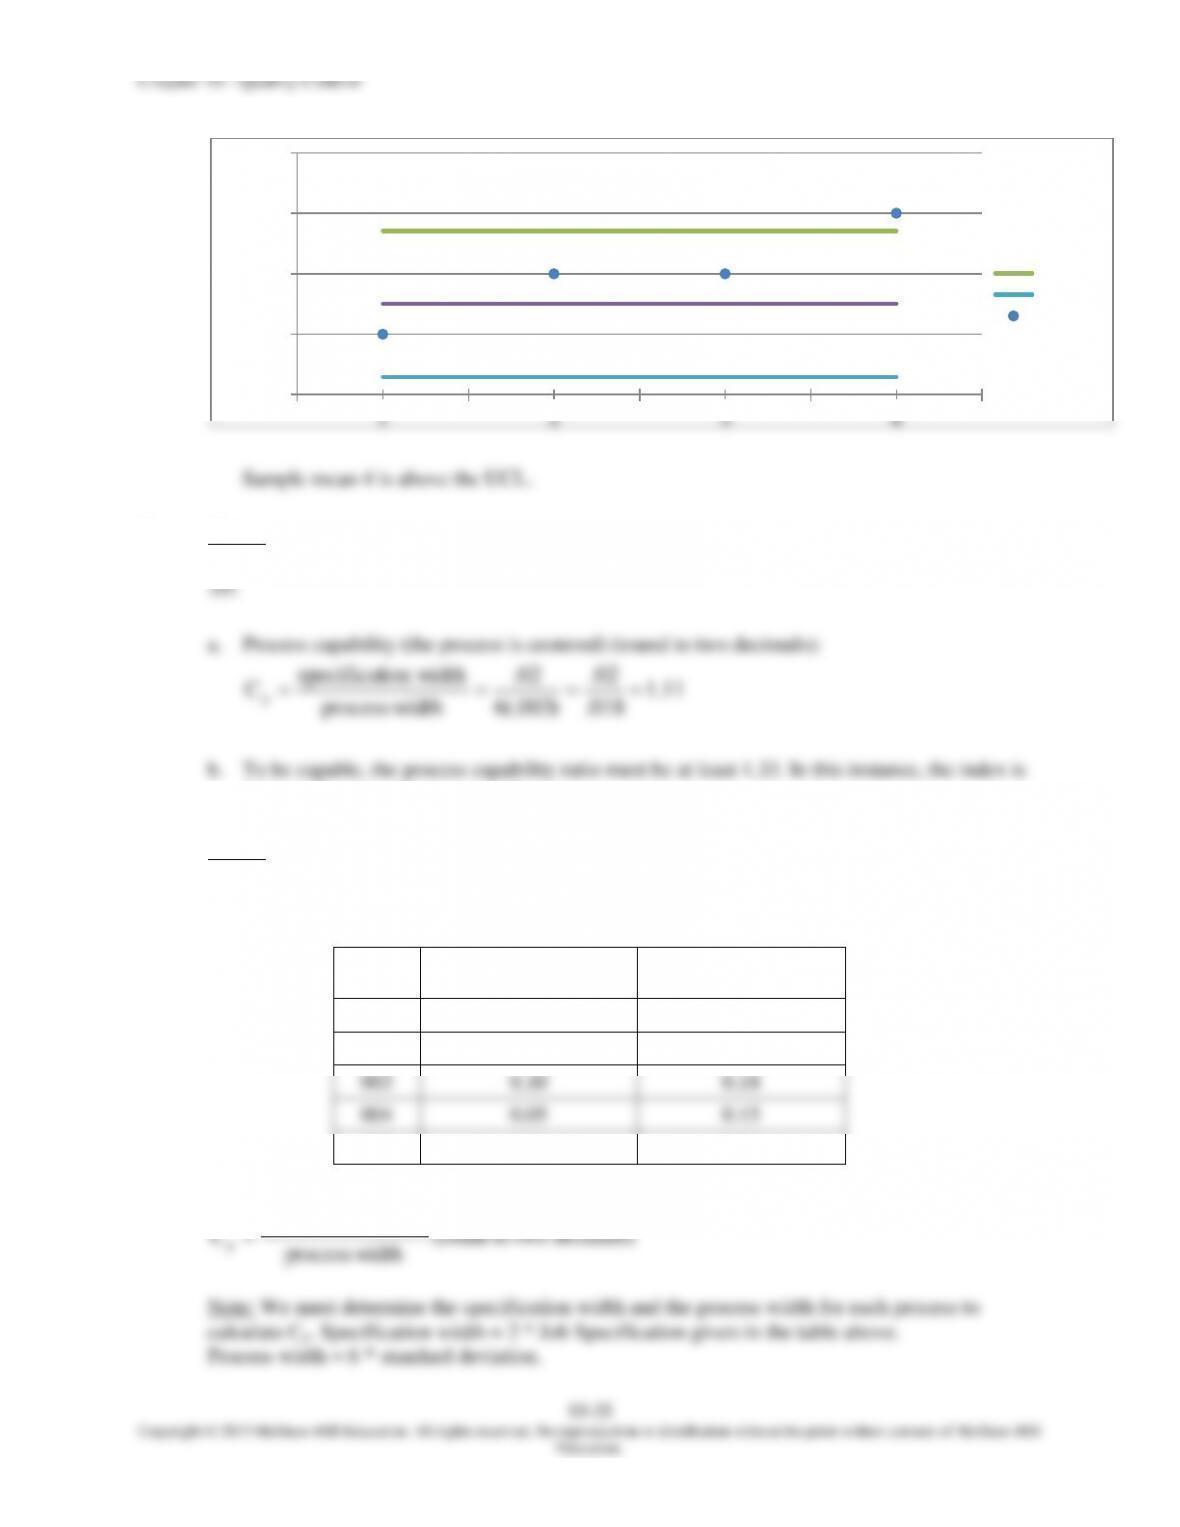
h. The control limits are different for means in parts d and g because two different measures of
4.500
4.312
4.689
4.200
4.300
4.400
4.500
4.600
4.700
4.800
Mean Chart
UCL
LCL
Mean
0.686
0.325
0.000
0.000
0.200
0.400
0.600
0.800
1 2 3 4
Range Chart
UCL
LCL
Range
10–35
Copyright © 2015 McGraw-Hill Education. All rights reserved. No reproduction or distribution without the prior written consent of McGraw-Hill
Education.
21. Given:
Process has a mean of .04 and a standard deviation of .003. The allowable variation is from .03 to
1.11, so the process is not capable.
22. Given:
We have the standard deviation for each of five processes and the specifications for a job on that
machine:
Process
Standard Deviation
(in.)
Job Specification
(in.)
001
0.02
0.05
002
0.04
0.07
003
0.10
0.18
004
0.05
0.15
005
0.01
0.04
Assuming that the process mean is centered for each process, we calculate Cp for each process:
widthprocess
widthionspecificat
p
C
(round to two decimals)
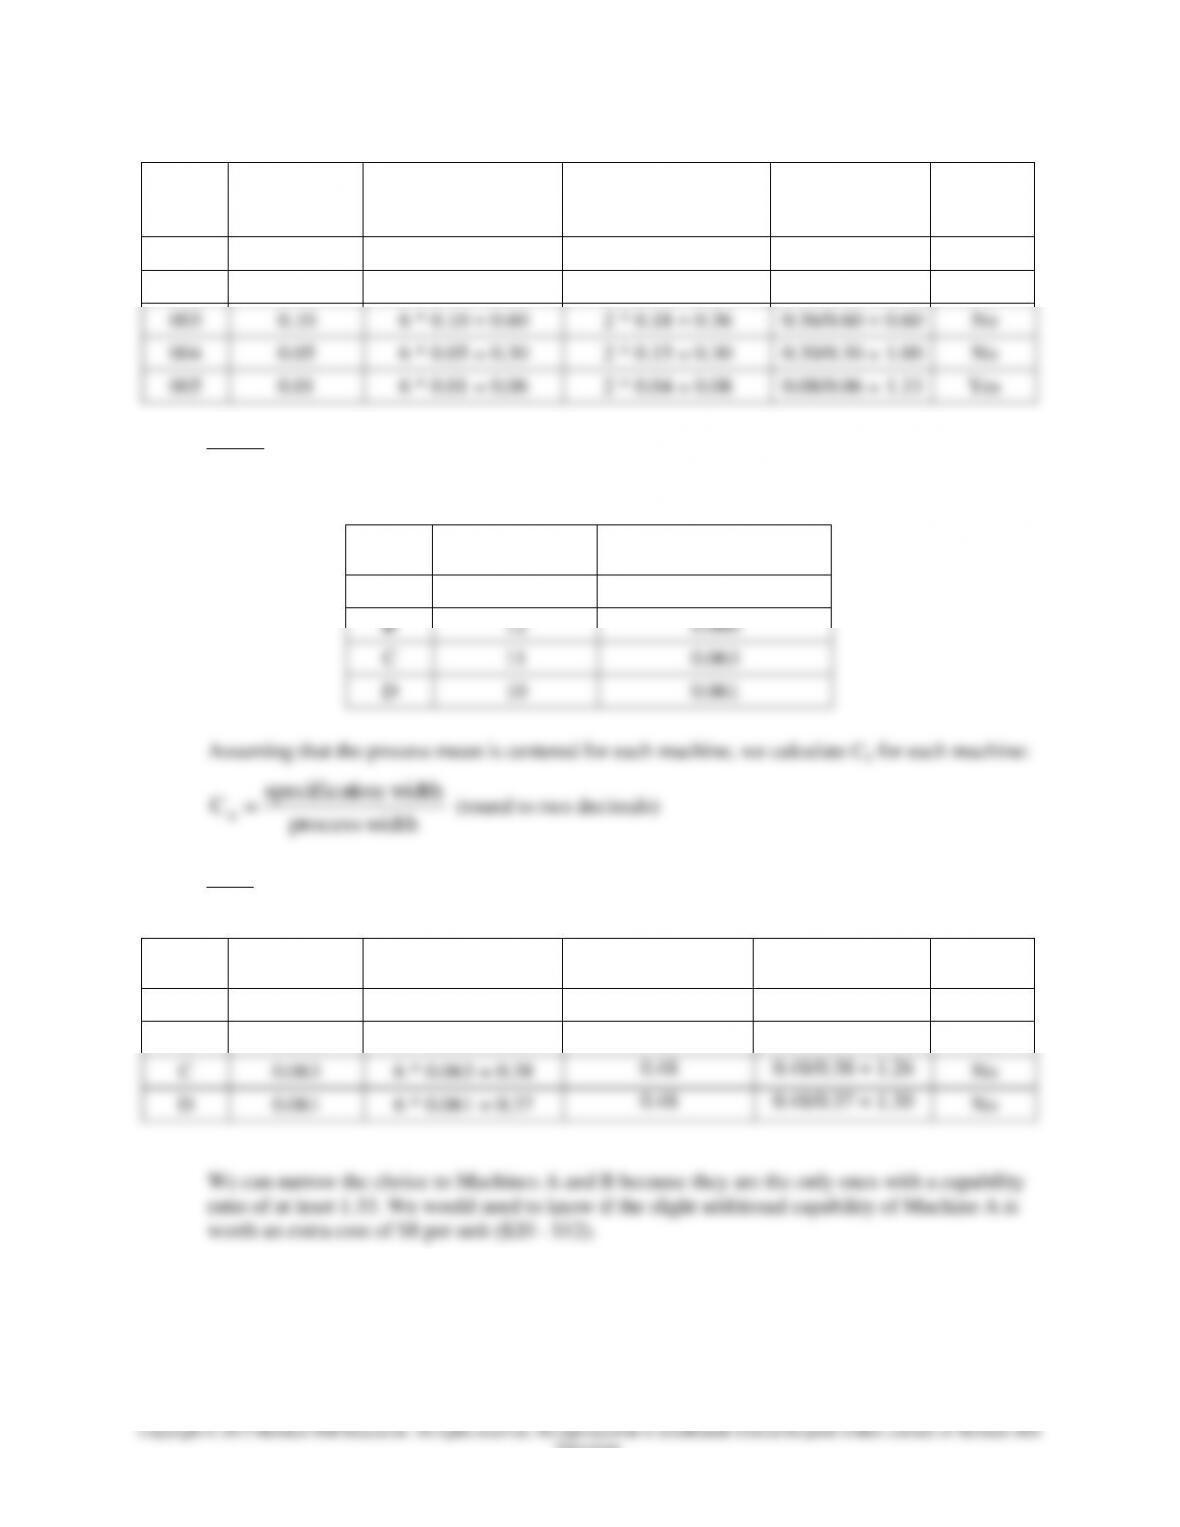
Note: We must determine the specification width and the process width for each process to
calculate Cp. Specification width = 2 * Job Specification given in the table above.
Process width = 6 * standard deviation.
Chapter 10 – Quality Control
10–36
Education.
Process
Standard
Deviation
(in.)
Process Width
Specification Width
Cp
Capable?
001
0.02
6 * 0.02 = 0.12
2 * 0.05 = 0.10
0.10/0.12 = 0.83
No
002
0.04
6 * 0.04 = 0.24
2 * 0.07 = 0.14
0.14/0.24 = 0.58
No
003
0.10
6 * 0.10 = 0.60
2 * 0.18 = 0.36
0.36/0.60 = 0.60
No
004
0.05
6 * 0.05 = 0.30
2 * 0.15 = 0.30
0.30/0.30 = 1.00
No
005
0.01
6 * 0.01 = 0.06
2 * 0.04 = 0.08
0.08/0.06 = 1.33
Yes
23. Given:
We have the information of four machines below. The specification width is .48 mm. What other
piece of information do we need to make a recommendation?
Machine
Cost per unit ($)
Standard Deviation
(mm.)
A
20
0.059
B
12
0.060
C
11
0.063
D
10
0.061
Assuming that the process mean is centered for each machine, we calculate Cp for each machine:
widthprocess
widthionspecificat
p
C
(round to two decimals)
Note: We must determine the process width for each machine to calculate Cp. Specification width
is given already. Process width = 6 * standard deviation.
Machine
Standard
Deviation
Process Width
Specification Width
Cp
Capable?
A
0.059
6 * 0.059 = 0.35
0.48
0.48/0.35 = 1.37
Yes
B
0.060
6 * 0.060 = 0.36
0.48
0.48/0.36 = 1.33
Yes
C
0.063
6 * 0.063 = 0.38
0.48
0.48/0.38 = 1.26
No
D
0.061
6 * 0.061 = 0.37
0.48
0.48/0.37 = 1.30
No
We can narrow the choice to Machines A and B because they are the only ones with a capability
ratio of at least 1.33. We would need to know if the slight additional capability of Machine A is
worth an extra cost of $8 per unit ($20 – $12).
Chapter 10 – Quality Control
10–37
Education.
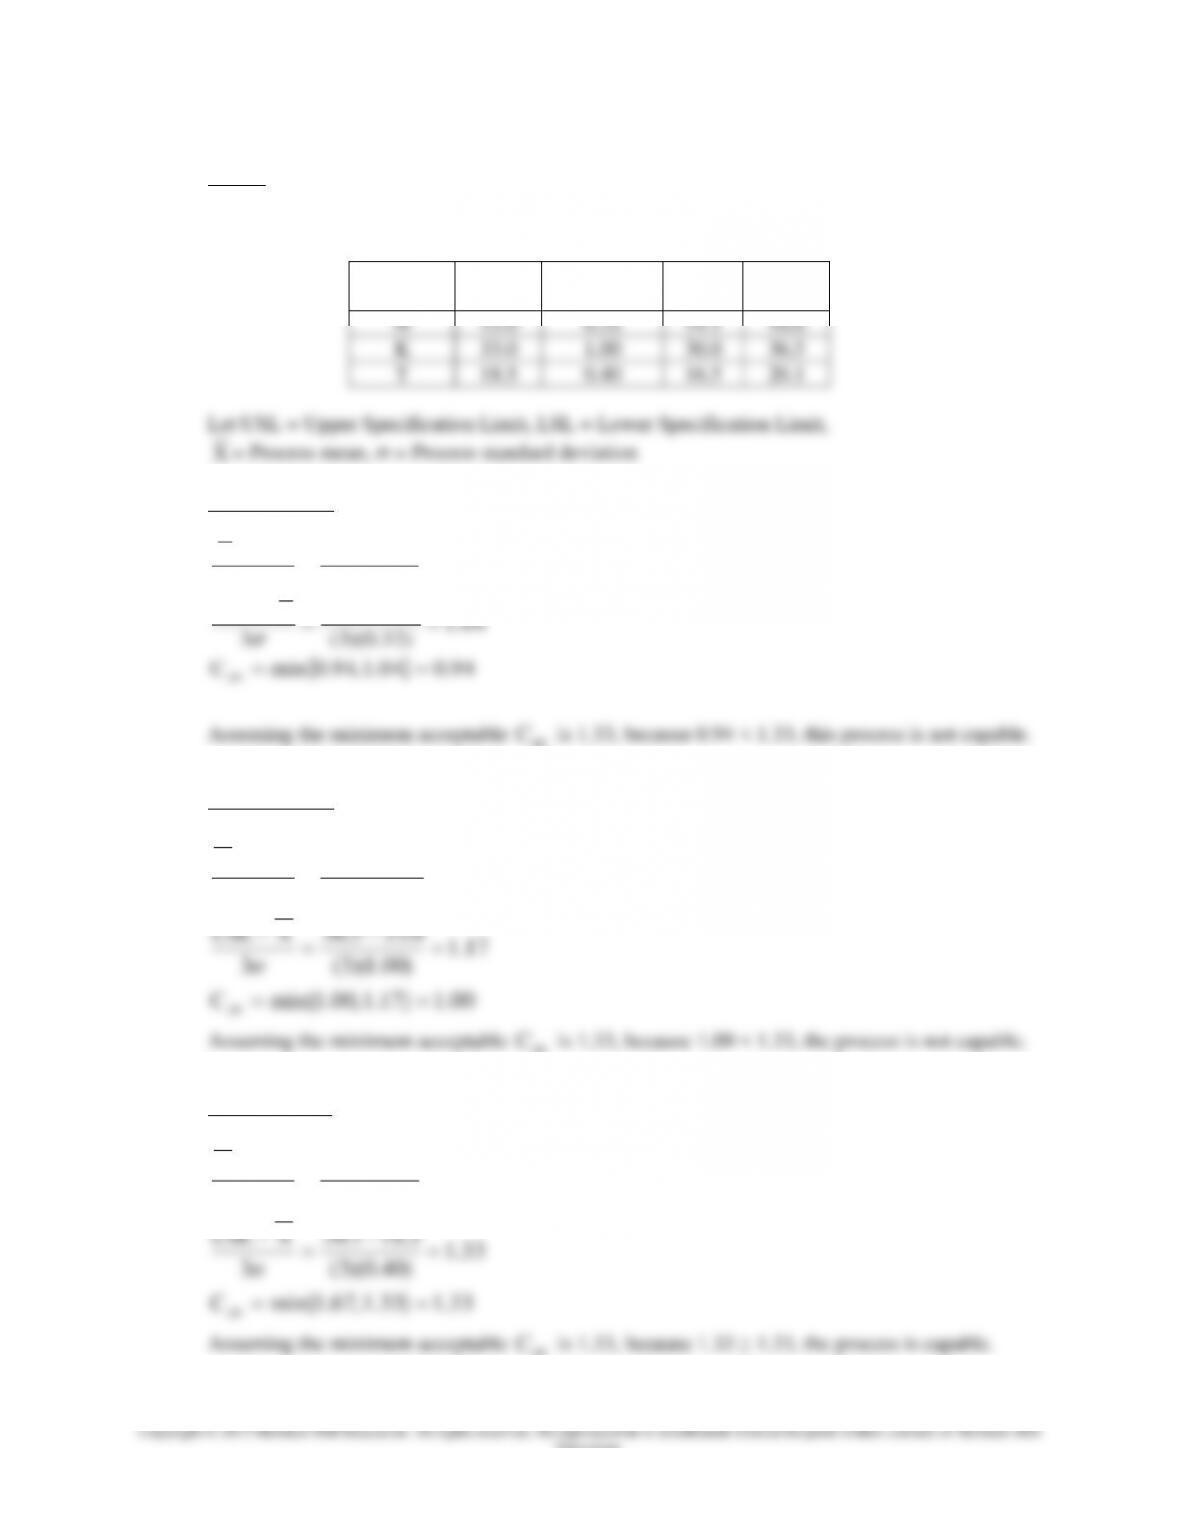
24. Given:
We have the mean, standard deviation, lower spec, and upper spec for three processes shown
below. Each of the processes means is not centered.
Process
Mean
Standard
Deviation
Lower
Spec
Upper
Spec
H
15.0
0.32
14.1
16.0
K
33.0
1.00
30.0
36.5
T
18.5
0.40
16.5
20.1
Let USL = Upper Specification Limit, LSL = Lower Specification Limit,
X
= Process mean, = Process standard deviation
For Process H:
94.004.1 ,94.0min
04.1
)32.0)(3(
0.150.16
3
94.0
)32.0)(3(
1.140.15
3
pk
C
XUSL
LSLX
pk
For Process K:
0.335.36
00.1
)00.1)(3(
0.300.33
3
XUSL
LSLX
pk
For Process T:
5.181.20
67.1
)40.0)(3(
5.165.18
3
XUSL
LSLX
pk
Chapter 10 – Quality Control
10–38
Education.
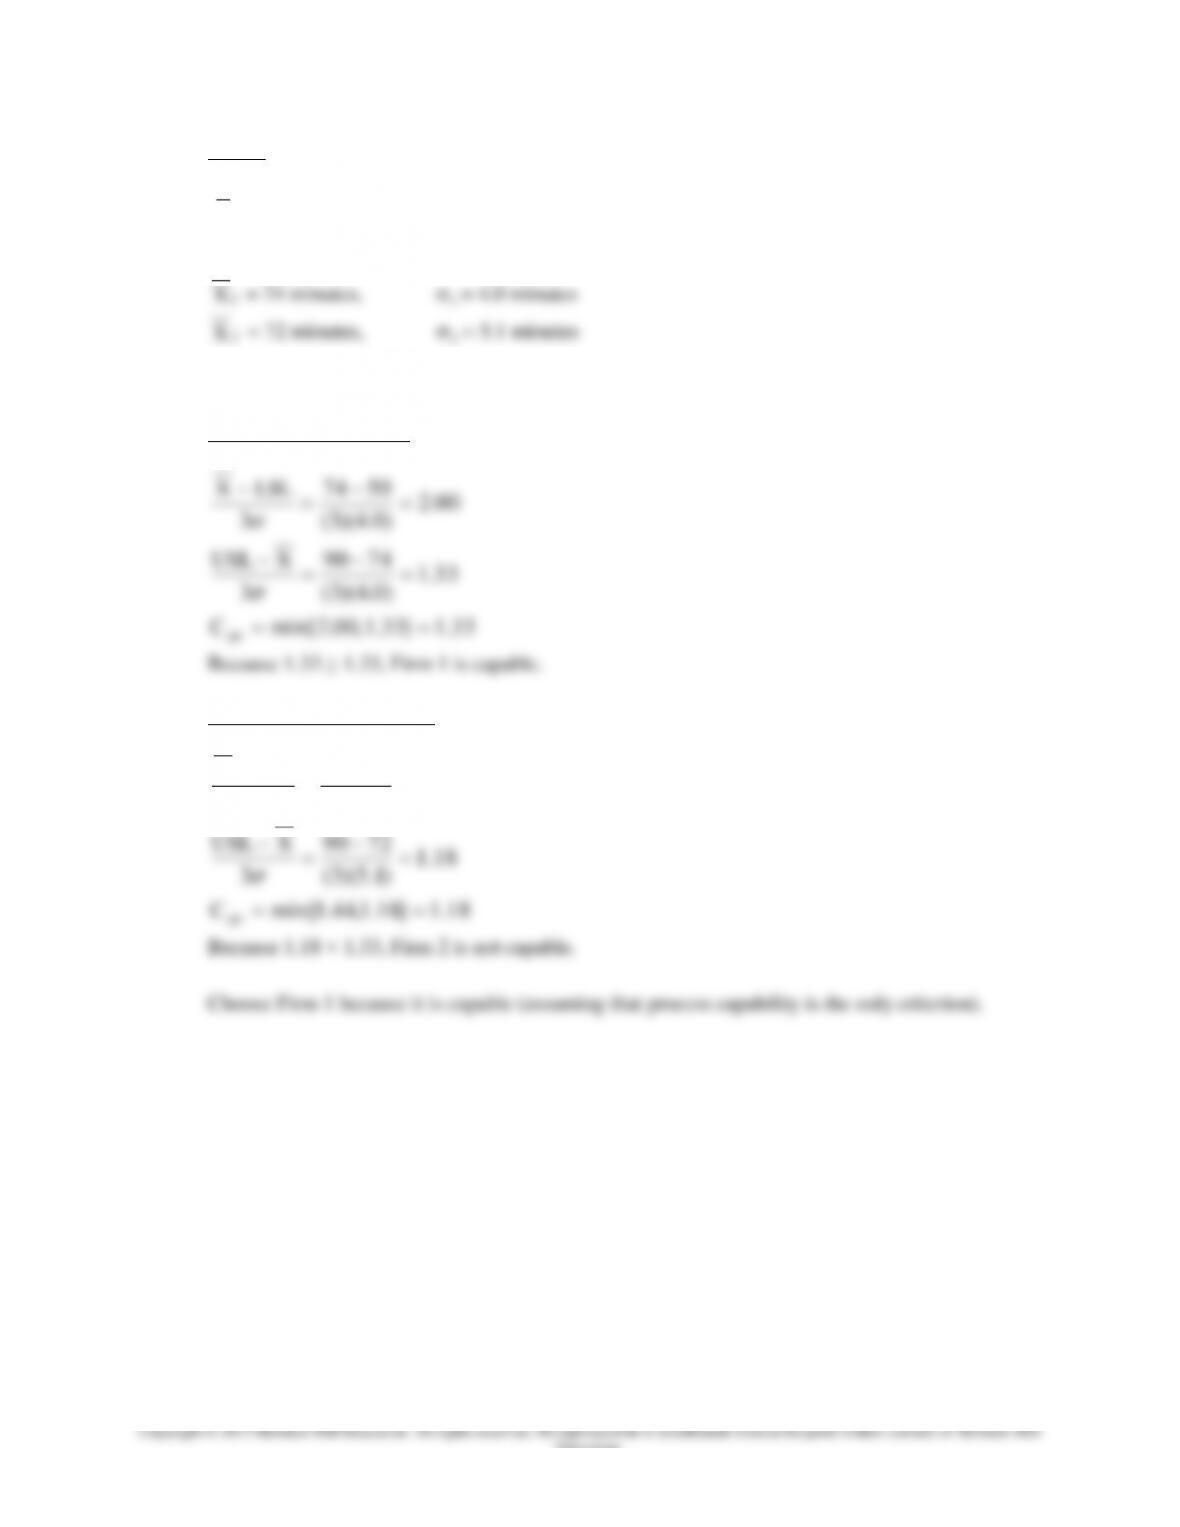
25. Given:
Let USL = Upper Specification Limit, LSL = Lower Specification Limit,
X
= Process mean, = Process standard deviation.
USL = 90 minutes, LSL = 50 minutes,
1
X
= 74 minutes,
1
= 4.0 minutes
2
X
= 72 minutes,
2
= 5.1 minutes
Neither firm’s mean repair time is centered so we must use Cpk.
For the first repair firm:
33.1}33.1 ,00.2min{
33.1
)0.4)(3(
7490
3
00.2
)0.4)(3(
5074
3
pk
C
XUSL
LSLX
Because 1.33 ≥ 1.33, Firm 1 is capable.
For the second repair firm:
7290
44.1
)1.5)(3(
5072
3
XUSL
LSLX