Chapter 10 – Quality Control
10-1
Education.
CHAPTER 10
QUALITY CONTROL
Teaching Notes
As a result of increased global competition, a rapidly growing number of companies of all sizes are
paying much more attention to issues involving quality and productivity. Many statistical techniques are
available to assist organizations in improving the quality of their products and services. It is important for
companies to use these techniques in the context of an overall quality system (Total Quality
Management), which requires quality awareness and careful planning and commitment to quality at all
levels of the organization. Many companies are not only utilizing these statistical techniques themselves,
but also are requiring their suppliers to meet certain standards of quality based on various statistical
measures. This chapter covers the statistical applications of quality control. Control charts are given the
primary emphasis, but other quality control topics such as process capability and inspection are discussed
also.
When covering the material in this chapter, we need to stress that through the use of control charts, the
nonrandom (special) causes of variation must be controlled before random (common) causes of variation
and process capability can be analyzed.
Reading: In the Chips at Jays
1. Jays cares about the following quality issues:
a. Appearance: Chips must be intact (not crushed into flinders), chips must not be burned or
2. Jays is not overdoing it with its concern for quality because they are in the “fun food
business.” Consumers buy potato chips as a treat—not as an everyday staple. Therefore, Jays
must ensure the high quality of the chips (i.e., appearance, weight, volume, freshness, and taste).
Reading: Bar Codes Might Cut Drug Errors in Hospitals
1. Bar codes are being used in hospitals to prevent drug errors (incorrect timing of dose, incorrect
2. The workaround problem can be solved through three policies: (a) nurses are not permitted to
make copies of patients’ bar codes, (b) nurses are not allowed to obtain drugs for more than one
patient at a time, and (c) violation of the first two policies could lead to disciplinary action, up to
and including termination.
Chapter 10 – Quality Control
Answers to Discussion and Review Questions
1. The elements in the control process are:
a. Define: define what is to be controlled
2. Control charts are based on the premise that a process that is stable will reflect randomness:
statistics of samples taken from the process (e.g., means, number of defects, etc.) will conform to
3. Control charts are used to distinguish between random variability and nonrandom variability of a
process, i.e., to monitor process output to determine if output is random.
4. Order of observation of process output is important if patterns (e.g., trends or cycles) in the output
are to be detected.
5. a.
x
Chart—A control chart used to monitor process variables by focusing on the central
6. A run is a sequence of observations with a certain characteristic, followed by one or more
7. All points can be within control limits, but there may be nonrandom patterns in the data, which
8. It is usually desirable to use both an up/down and a median run test on a given set of data because
9. No, there is always the possibility of a Type II (beta) error, which is concluding that the process is
10. Specifications are limits on the range of variation of output that are set by design (engineering and
customers). Control limits are statistical bounds on a sampling distribution. They indicate the
extent to which summary values such as sample means or sample ranges will tend to vary solely
10-3
Copyright © 2015 McGraw-Hill Education. All rights reserved. No reproduction or distribution without the prior written consent of McGraw-Hill
Education.
11. The problem is that even when the machine is functioning as well as it can, unacceptable output
will result. Among the possible options that should be considered are:
a. Use 100 percent inspection to screen out defectives. If destructive testing is required, this
may not be feasible.
12. a. This “problem” often goes undetected because there are no complaints from customers about
output falling outside specifications. However, it is quite possible to realize decreased costs
or more profits due to having fewer defective parts. In addition, less inspection might be
13. a. An optimal level of inspection is one where the cost and effort of inspection equals the
benefits derived from inspection, or the point (number of units inspected) at which the
marginal cost of inspection equals the marginal benefit from inspection (the point at which
the sum of inspection cost and the cost of passing defectives is minimized).
14. Two basic assumptions that must be satisfied to use a process capability index are:
a. The process is stable (non-random causes of variation have been identified and eliminated).
10-4
15. It is very important for managers to maintain and promote ethical behavior in dealing with quality
16. a. Type I error: concluding that the person is not innocent (i.e., guilty) when the person is
innocent
b. Type II error: failing to detect that the person is not innocent (i.e., guilty) when the person is
not innocent
Taking Stock
1. a. In deciding whether to use 2-sigma or 3-sigma limits, the quality control people should be
involved as well as the accounting/recordkeeping personnel because it will be critical to
determine the cost of stopping the process unnecessarily vs. the cost of not correcting a
special cause of variation. In addition, we may want to involve the customers’ quality control
lost product) vs. the benefits (fewer interruptions to the process and greater accuracy of
sample statistics).
Smaller samples are more likely to reveal a change in the process than larger samples are
because a change is more likely to take place within the large sample, but between small
samples. The downside of taking small samples is the increased frequency to take samples, to
plot data, to interpret data, and to take corrective action if necessary. The tradeoff here
involves cost (inspecting items, plotting values, interpreting charts, and taking corrective
action) vs. the benefits (the usefulness of the data for making decisions on whether the
process is in control).
2. In setting the quality standards, customers definitely should be involved because they will be
3. Technology has had a profound impact on quality. Improvement in measurement systems has
improved the measurement of quality significantly. Computer technology has enabled many
Chapter 10 – Quality Control
10-5
Education.
companies to perform on-line, real-time statistical process control, which has enabled companies
to respond to quality problems faster. Due to technological improvements in computerized
design, products are designed better, and thus have significantly fewer quality problems. In
addition, artificial intelligence systems forewarn potential problems before they occur. Processes
using computerized technology are able to meet tighter specifications also.
Critical Thinking Exercises
1. If the analysis of the output of a process suggests that there is an unusual occurrence, but the
result of the investigation cannot pinpoint or determine the assignable causes, the limits may be
2. A single standard would be easier to work with, and everyone would know what the standard is.
Multiple standards might be used if the cost of errors differed significantly across products or
3. Student answers will vary. Some possible answers follow:
Inspection: Cutting back on inspection to decrease costs would violate the Utilitarian Principle
due to the risk of increased failure costs. If a manager forced an inspector to alter inspection data,
4. Even though a repetitive operation can check and reject parts automatically, the rejecting of parts
reveals little information other than the number of parts rejected. Control charts still are needed to
detect nonrandom patterns in the process data.
Additional Experiential Learning Exercises
Sampling Demonstrations. Bowls of colored beads (e.g., 1,000 beads, 40% white, 30% green,
20% red, 5% black, 3% yellow, etc.) are available with paddles that have indentations to
facilitate obtaining samples of various sizes quickly. Use this exercise to demonstrate sampling
variability: take repeated small samples (or have a student do it) to demonstrate that different
percentages of a color appear in different samples. Then, increase the sample size, focusing on a
specific color, and have students recognize that there is less sampling variability as the sample
size increases. Afterward, explain why in process sampling, small samples are used even though
large samples are more “accurate.” One issue is the cost, time, and disruption caused by taking
large samples. Even more important is the ability to capture process changes that might occur
between small samples (e.g., taking 6 samples of n = 10 over time could reveal a trend, whereas
taking 1 sample of n = 60 would not).
Process Control Demonstrations. Obtain 30 clear plastic “zipper” bags and an ample supply
Chapter 10 – Quality Control
10-6
Education.
of colored beads or jelly beans.
a.
b.
c.
Place 10-20 beads/beans in each of 10 bags, focusing, for example, on red beads/beans.
Number the bags 1 to 10. Put 0, 1, or 2 red beads/beans in each bag, along with other
colors of beads/beans. Pass the bags out to the class and ask them what kind of control
chart would be appropriate (p–chart or c-chart). Then, assume that the red beads/beans
are defects so we will construct a c–chart. Ask students to report (in the order in which
they took the samples) the number of defects that they have counted. Next, have the
students calculate 2s control limits and then observe that all sample data are within the
control limits.
In a second set of bags numbered 11-21, arrange it so that bag #14 has too many red
beads/beans, making it “out of control.” Pass out those bags and have the students report
the numbers of red that they find. When the student with bag #14 reports a large number
of reds, tell the class that the process would be halted while efforts were made to find
and correct the problem. Then, resume “sampling” with the process now back in
control.
Arrange the third set so that a trend begins to appear at about the fifth bag, but with all
results still within the limits. Point out that the process does not appear to be random;
therefore, it would be halted at the ninth or tenth sample to find and correct the problem.
Solutions
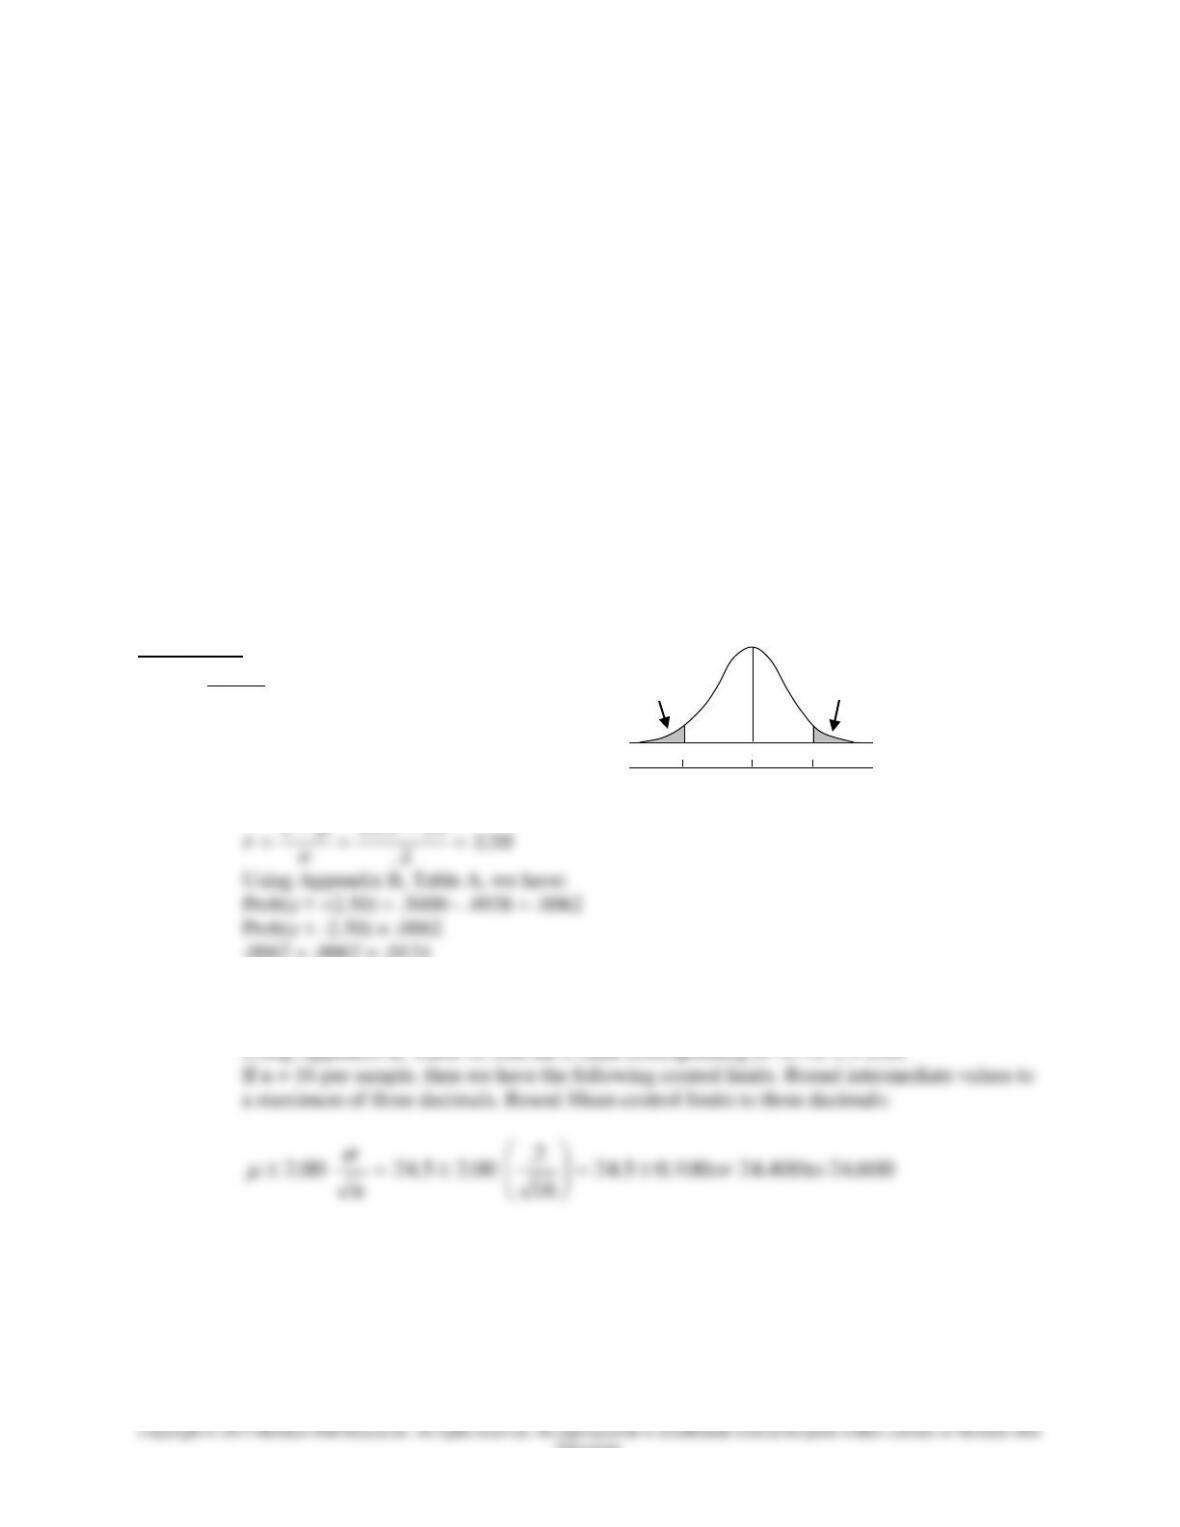
1. Given:
Specs: 24 oz. to 25 oz.
= 24.5 oz. [assume = =
x ]
= .2 oz.
a. [refers to population]
.0062 + .0062 = .0124
b. [refers to sample]
95.44% = 47.72% on each side of the mean.
Using Appendix B, Table A, find the z value corresponding to .4772: z = 2.00.
.0062
.0062
24 24.5 25 16
-2.5 0 +2.5 z-scale
Chapter 10 – Quality Control
10-7
Education.
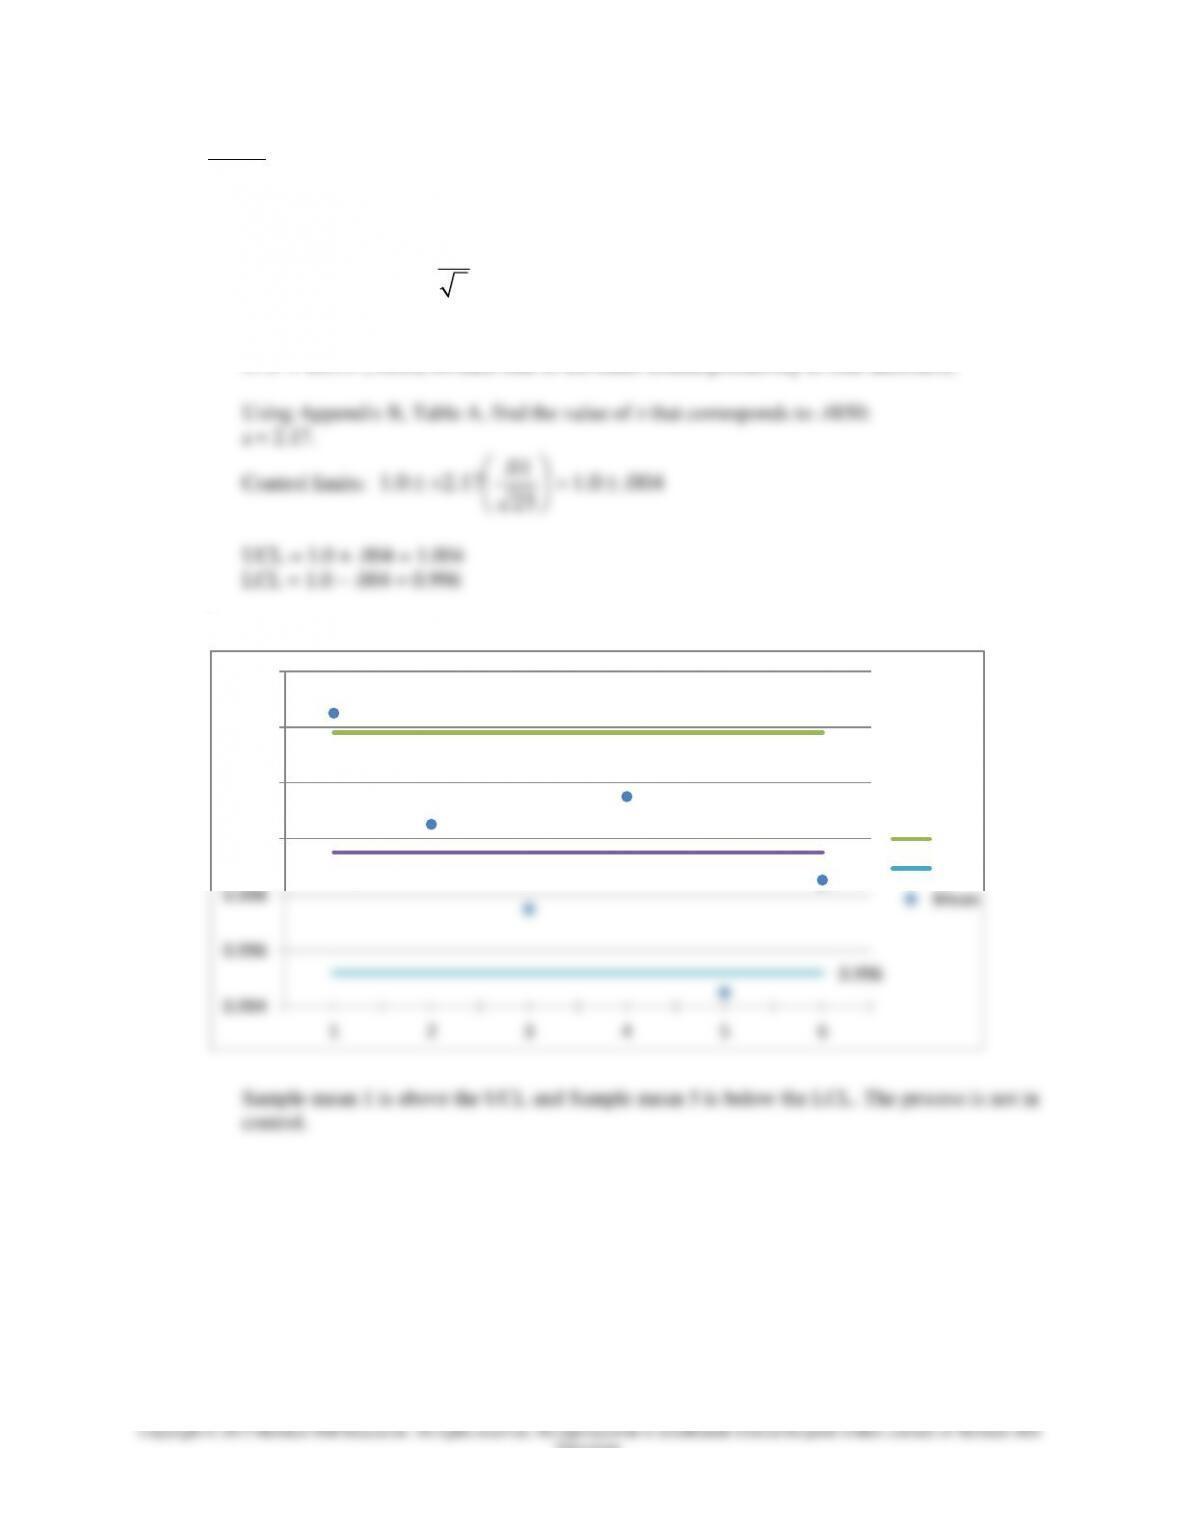
2. Given:
= 1.0 liter
= .01 liter
n = 25
a.
Control limits: zn
Round Mean control limits to three decimals.
97% = 48.5% (.4850) on each side of the mean (round probability to four decimals).
b.
1.004
1.000
0.996
0.994
0.996
0.998
1.001
1.003
1.005
1.007
1 2 3 4 5 6
Mean Chart
UCL
LCL
Mean
Chapter 10 – Quality Control
10-8
Education.
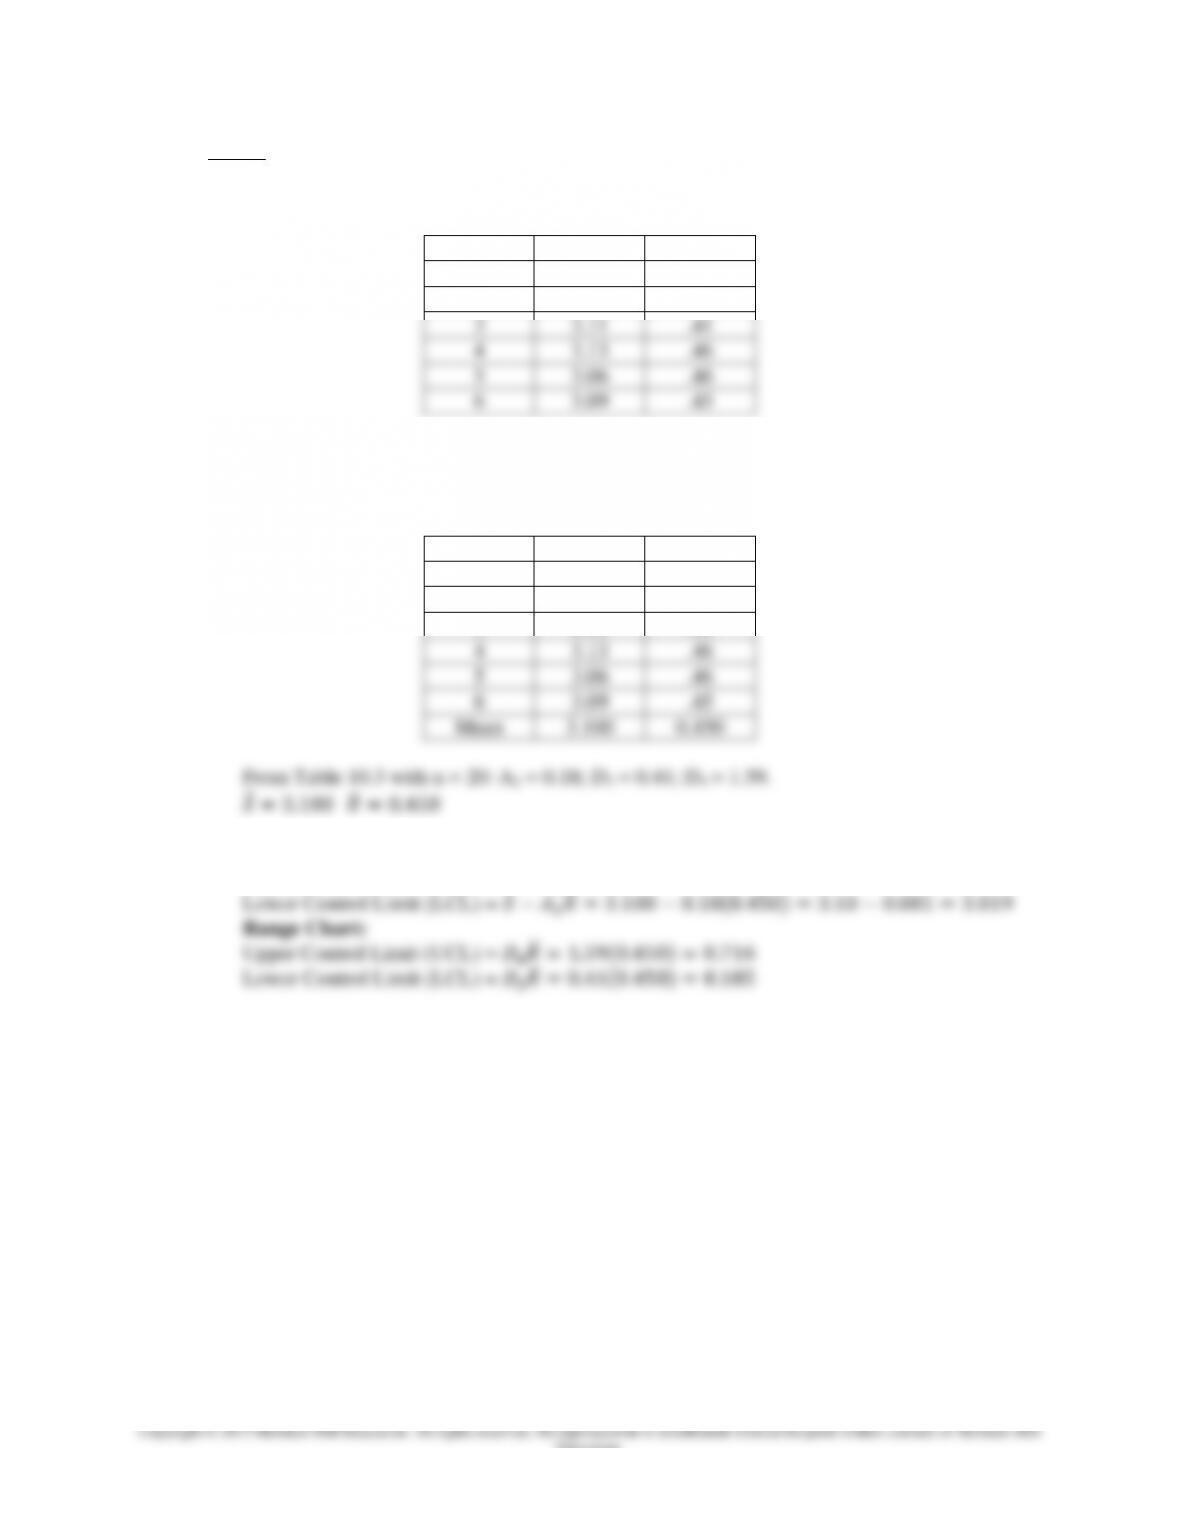
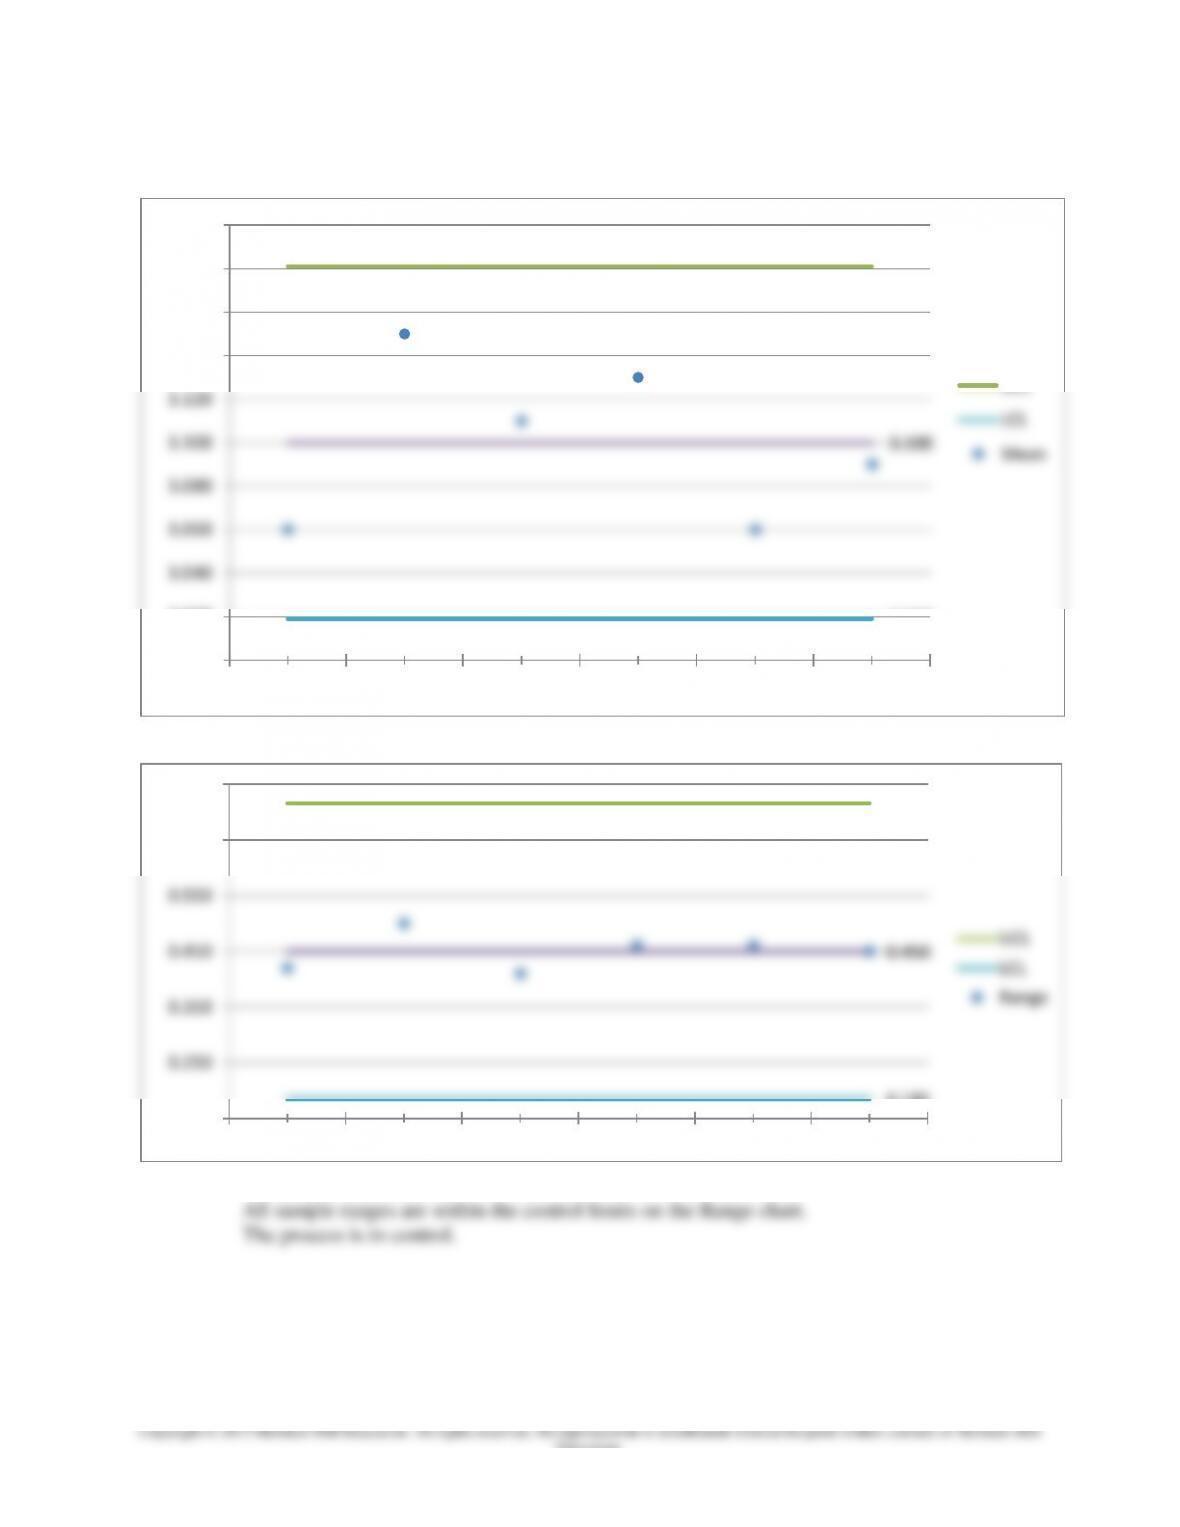
3. Given:
Six samples of n = 20 observations were obtained. The sample means and ranges are shown
below:
Sample
Mean
Range
1
3.06
.42
2
3.15
.50
3
3.11
.41
4
3.13
.46
5
3.06
.46
6
3.09
.45
a. Using the factors in Table 10.3, determine upper and lower limits for Mean and Range charts.
Round all intermediate values for Mean and Range charts to a maximum of three decimals.
Round Mean and Range chart control limits to three decimals.
Sample
Mean
Range
1
3.06
.42
2
3.15
.50
3
3.11
.41
4
3.13
.46
5
3.06
.46
6
3.09
.45
Mean
3.100
0.450
From Table 10.3 with n = 20: A2 = 0.18; D3 = 0.41; D4 = 1.59.
Mean Chart:
Upper Control Limit (UCL) =
Chapter 10 – Quality Control
10-9
Education.
b.
All sample means are within the control limits on the Mean chart.
3.181
3.100
3.019
3.000
3.020
3.040
3.060
3.080
3.100
3.120
3.140
3.160
3.180
3.200
1 2 3 4 5 6
Mean Chart
UCL
LCL
Mean
0.716
0.45
0.185
0.450
0.150
0.250
0.350
0.450
0.550
0.650
0.750
1 2 3 4 5 6
Range Chart
UCL
LCL
Range
Chapter 10 – Quality Control
10–10
Education.
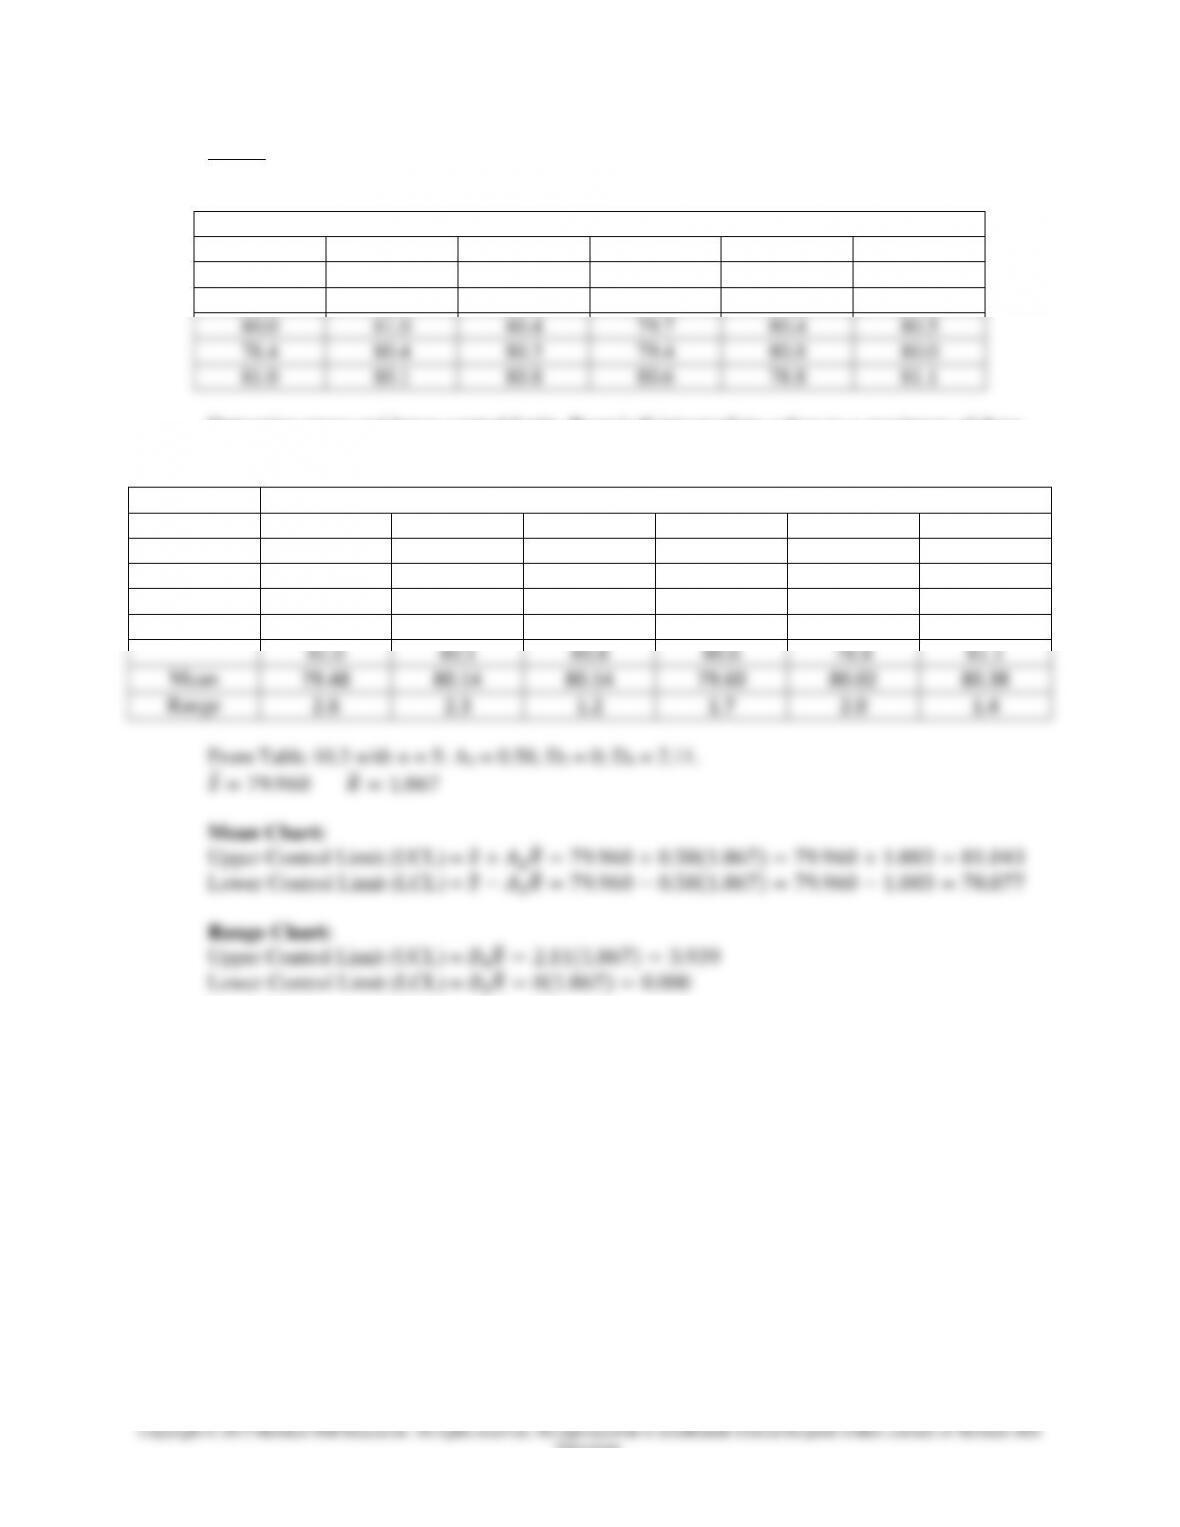
4. Given:
Samples of five observations have been taken and are shown below:
Sample
1
2
3
4
5
6
79.2
80.5
79.6
78.9
80.5
79.7
78.8
78.7
79.6
79.4
79.6
80.6
80.0
81.0
80.4
79.7
80.4
80.5
78.4
80.4
80.3
79.4
80.8
80.0
81.0
80.1
80.8
80.6
78.8
81.1
decimals. Round Mean and Range chart control limits to three decimals.
Samples
1
2
3
4
5
6
79.2
80.5
79.6
78.9
80.5
79.7
78.8
78.7
79.6
79.4
79.6
80.6
80.0
81.0
80.4
79.7
80.4
80.5
78.4
80.4
80.3
79.4
80.8
80.0
81.0
80.1
80.8
80.6
78.8
81.1
Mean
79.48
80.14
80.14
79.60
80.02
80.38
Range
2.6
2.3
1.2
1.7
2.0
1.4
From Table 10.3 with n = 5: A2 = 0.58; D3 = 0; D4 = 2.11.
Mean Chart:
Upper Control Limit (UCL) =
Lower Control Limit (LCL) =
Range Chart:
Upper Control Limit (UCL) =
Lower Control Limit (LCL) =
.000