Chapter 14 – Developing and Pricing Goods And Services
14-61
PPT 14-47
Bringing New Products to the Market
• Concept Testing — Takes a product idea to
consumers to test reactions.
BRINGING NEW PRODUCTS
to the MARKET
14-47
LO 14-5
• Commercialization —
Promoting the product to
distributors and retailers
and developing the
promotional campaign.
PPT 14-48
Making the Right Cut
MAKING the RIGHT CUT
14-48
• ModCloth sells the work of
over 600 independent
designers.
• Their customer engagement
programs help them retain
customer loyalty.
• Users can submit their own
designs, vote on pieces to
sell, and seek out style help
24/7.
PPT 14-49
Same Products, Merrier Feel
SAME PRODUCTS,
MERRIER FEEL
14-49
Source: Bloomberg Businessweek, www.businessweek.com, accessed November 2014.
LO 14-5
• Starbucks – Holiday lattes, like
gingerbread and eggnog launch in October.
• Clif Bar – Your winter hike can include
snacks like pecan pie and pumpkin pie.
• Kraft – The famous mac and cheese gets
the snowman treatment during the
holidays.
• Pringles – Pop a can of cinnamon and
sugar chips by the fire.
PhotoCredit:JoelKramer

Chapter 14 – Developing and Pricing Goods And Services
14-62
PPT 14-50
The Four Stages of a Product Life Cycle
The FOUR STAGES of a
PRODUCT LIFE CYCLE
14-50
LO 14-6
• Product Life Cycle — A theoretical model of what
happens to sales and profits for a product over time.
• Product Life Cycle Stages:
1. Introduction
2. Growth
3. Maturity
4. Decline
PPT 14-51
Sales and Profits during the Product Life
Cycle
SALES and PROFITS DURING
the PRODUCT LIFE CYCLE
14-51
LO 14-6
PPT 14-52
Profits Beyond the Grave
PROFITS BEYOND the GRAVE
Top Earning Deceased Celebrities in 2014
Source: Forbes, www.forbes.com, accessed November 2014. 14-52
Celebrity Earnings Year of Death
Michael Jackson $140 million 2009
Elvis Presley $55 million 1977
Charles Shultz $40 million 2000
Elizabeth Taylor $25 million 2011
Bob Marley $20 million 1981
Marilyn Monroe $17 million 1962
John Lennon $12 million 1980
Albert Einstein $11.5 million 1955
Bettie Page $9 million 2008
LO 14-6
1. This slide explores the top earnings of deceased ce-
lebrities.
2. Ask students: Albert Einstein is associated with all
things “brainy.” His earnings weren’t generated by
sales of any products he invented, so how did his
estate bring in $10 million in 2012? (Einstein’s
name appears on such things as Baby Einstein
products, Chrysler’s Ram brand truck ads, and a
collection of A.J. Morgan “geek chic glasses. A
new brain videogame for Nintendo DS retails for
about $50.
3. Ask students: What do you think the future earn-
ings of Michael Jackson will be?
Chapter 14 – Developing and Pricing Goods And Services
14-63
PPT 14-53
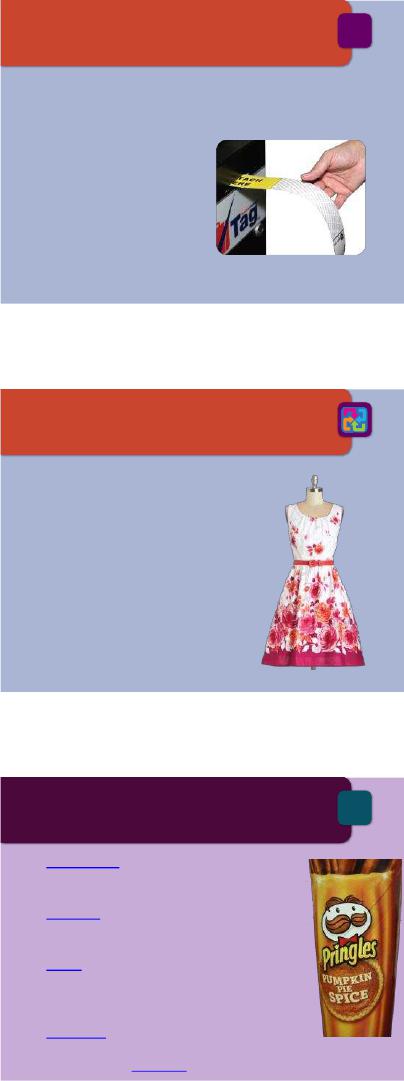
The Product Life Cycle and the Market-
ing Mix
The PRODUCT LIFE CYCLE and
the MARKETING MIX
14-53
LO 14-6
PPT 14-54
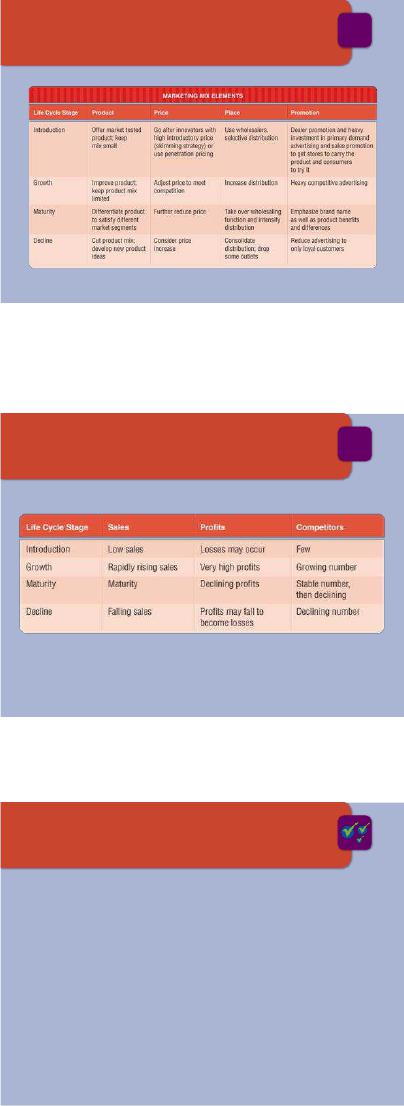
Product Life Cycle Stages & Sales, Prof-
it, and Competion
PRODUCT LIFE CYCLE STAGES &
SALES, PROFIT, and COMPETITION
14-54
LO 14-6
PPT 14-55
Progress Assessment
TEST PREP
14-55
• What are the six steps in the new-product
development process?
• What’s the difference between product screening
and product analysis?
• What are the two steps in commercialization?
• What’s the theory of the product life cycle?
1. The six steps in the new-product development pro-
cess include: Idea generation, development, product
screenings, testing, product analysis, and commerciali-
zation.
2. During the product screening process the number of
new-product ideas a firm is working on is reduced, so
that it may focus on the most promising ideas. Product
analysis occurs after screening and involves making
cost estimates and sales forecasts to get a feeling for the
profitability of new-product ideas.
3. The two steps in commercialization involve pro-
moting the product to distributors and retailers, and the
development of strong advertising and sales campaigns.
4. The product life cycle is a theoretical model which
explains what happens to sales and profit for a product
over a particular period of time. This model has four
stages: introduction, growth, maturity, and decline.

Chapter 14 – Developing and Pricing Goods And Services
14-64
PPT 14-56
Pricing Objectives
PRICING OBJECTIVES
14-56
LO 14-7
1) Achieving a target return on
investment or profit
2) Building traffic
3) Achieving greater market
share
4) Creating an image
5) Furthering social objectives
both short-run and long-run
One strategy many students have experienced but might not
fully understand is the loss leader strategy. This strategy is
often used around the Thanksgiving holiday when grocery
stores offer to sell customers turkeys for much less than
their actual cost in an effort to attract consumers into the
store. This leads to more traffic and sales of more products.
PPT 14-57
Pricing Strategies
PRICING STRATEGIES
14-57
LO 14-7
• Cost-based pricing measures cost of producing a
product including materials, labor, and overhead.
• Target Costing – Designing a product that satisfies
customers and meets the firm
’
s targeted profit
margins.
• Competition-Based Pricing — A strategy based
on what the competition is charging for its products.
PPT 14-58
Using Break-Even Analysis
USING BREAK-EVEN ANALYSIS
14-58
LO 14-7
• Break-Even Analysis — The process used to
determine profitability at various levels of sales. The
break-even point is where revenues equals cost.
• Total Fixed Costs — All costs that remain the same
no matter how much is produced or sold.
• Variable Costs — Costs that change according to
the level of production.

Chapter 14 – Developing and Pricing Goods And Services
14-65
PPT 14-59
How to Find the Break-Even Point
HOW to FIND the
BREAK-EVEN POINT
14-59
LO 14-7
• The break-even point equals the total fixed costs (FC)
divided by the price of one unit (P) minus the variable
cost of one unit (VC).
BEP = FC/P – VC
• If you have a fixed cost of $200,000, a variable cost of
$2 per item, and you sell your product for $4 each,
what would be your BEP?
Answer: 100,000 items.
PPT 14-60
Pricing Alternatives
PRICING ALTERNATIVES
14-60
LO 14-7
• Skimming Price Strategy — Pricing new products
high to recover costs and make high profits while
competition is limited.
• Penetration Price Strategy — Pricing products low
with the hope of attracting more buyers and
discouraging other companies from competing in the
market.
• Everyday Low Pricing (EDLP) — Setting prices
lower than competitors with no special sales.
When Apple introduced the iPhone, they used a skimming
price strategy. Walmart has effectively used everyday low
pricing or EDLP to dominate the retail sector.
PPT 14-61
Pricing Strategies of Retailers
PRICING STRATEGIES
of RETAILERS
14-61
LO 14-7
• High-Low Pricing — Using
regular prices that are higher
than EDLP stores except
during special sales when they
are lower.
• Psychological Pricing —
Pricing products at price points
that make a product seem less
expensive than it is.

Chapter 14 – Developing and Pricing Goods And Services
14-66
PPT 14–62
Progress Assessment
TEST PREP
14-62
• List two short-term and two long-term pricing
objectives. Can the two be compatible?
• What are the limitations of a cost-based pricing
strategy?
• What is psychological pricing?
1. Short-term pricing objectives include loss leaders
and are designed to build traffic as well as achiev-
ing greater market share. Long-term pricing objec-
tives include achieving a target return on invest-
ment and creating a certain image. It is important
that marketing managers set pricing objectives in
context of other marketing decisions, since the
pricing objectives may differ greatly.
2. The limit of a cost-based pricing system is that in
the long run it is not the producer that establishes
price but rather the marketplace. To effectively es-
tablish price, the producer must take into account
competitor prices, marketing objectives, actual
cost, and the expected cost of product updates.
3. Psychological pricing involves setting the price of
goods or services at price points that make the
product appear less expensive. For example, a TV
may be priced at $999, since it sounds less expen-
sive than $1,000.
Chapter 14 – Developing and Pricing Goods And Services
14-67
lecture
enhancers
“People want economy and they will pay any price to get it.”
Lee Iacocca
“It’s impossible to make things foolproof because fools are so ingenious.”
Murphy’s Law #8
“The aim of marketing is to know and understand the customer so well the product
or service fits him and sells itself.”
Peter F. Drucker
“Good design can’t fix broken business models.”
Jeffrey Veen
lecture enhancer 14-1
THERE IS NO SUCH THING AS A “BETTER” PRODUCT
It may seem outrageous at first to see think that “There is no such thing as a ‘better’ product,” but
hear me out. Often it is best to understand a concept by looking at some examples. So, here goes. Which
school offers the better product: Harvard, Berkeley, or this school? To answer that question, one has to
ask, “What do you mean by ‘better product’?” If you mean, “Which product is perceived as better by the
most people,” that’s one thing. If you mean, “Which is the most affordable?” that’s something else.
Doesn’t it make sense that the best product is the one that best meets your needs? If that is true,
then there is no such thing as a better product for everyone. Some students may prefer Harvard, others
Berkeley, and others this school. Each may have his or her own reasons. But, the bottom line is that there
is no such thing as a better school for students. The school that best meets an individual student’s needs is
the best school for him or her. Those needs include the need for accessibility (Is the school close?), af-
fordability, completability (Can I graduate?), and more.
One mistake people make is to think that better means better quality. That often happens in engi-
neering schools, but it can happen anywhere. If you cannot afford a Cadillac and Cadillac improves the
quality of the car, is the car now a better car for you? Of course not. You couldn’t afford one without in-
creased quality. It is not likely you could afford one that cost more because of increased quality. Do you
always buy the best-quality goods? Why not? Because they are not the best product for you. Are you get-
ting the idea that the notion of a good product includes a lot more than just quality? It may include a good
price, a good style, a good location, and more—much more. What’s important to you may not be im-
portant to me. What’s a better product for you, therefore, may not be a better product for me.
So, how does one determine what a better product is? One way is to see what people actually buy.
To them, that was the better product—for them. This is a very hard notion to comprehend, but a very im-
portant one for marketers to understand. There is no one standard for better. Not quality, not price, not
any one thing. You may think something is better because it has a better reputation or it is stronger or fast-
er or whatever, but that doesn’t make it better from a marketing perspective. A better product, from a
marketing perspective is the one that people will buy. When designing a product, therefore, it is important
to ask people what they want. When you give people what they want, you then create a better product,
even if it is inferior in quality.
Chapter 14 – Developing and Pricing Goods And Services
14-68
For example, a BMW is not a better product than a Ford just because it costs more or has more
prestige. In fact, a Ford may be a better product for a lot more people because it is more affordable. Can
you see that a product you can’t afford is not better, at least not for you? But it’s clear that there are many
products that are perceived as better. For example, a BMW is usually perceived as better than a Ford. On
the other hand, I may not like the way BMW cars look or the price or the snob appeal. My perception may
be that Ford is better because it is American-made, more stylish, and so on. No one’s perception is wrong;
it is just their perception.
In the marketplace, perceptions are critical. One way to make a product better, then, is to change
perceptions. If I tell you that my product is “new and improved” and you believe me, I’ve now made my
product better. Of course, if you don’t believe me, the product is not better. Similarly, if I improve a
product’s quality dramatically, and you don’t know I’ve done that, then the product is not really better
yet. In marketing, therefore, perception is often more important than reality.
One way to make a product better in marketing is to improve your advertising or to improve your
marketing communications in general. By creating a better impression of your product, you make it more
attractive to consumers; that is, you make it better in their minds. If there is some benefit to your product
that people don’t know about and you tell them about it in your ad, you then make your product better
even though you’ve made no changes in the physical good itself. On the other hand, if a competitor con-
vinces people that your product is not better, then it’s not better, even though by most objective measures
it may be. To make a product better, it is a good idea to find out what people want and make sure your
product has what they want. But your product won’t truly be better to them until they hear about it; that
is, until they change their perception. Think about it. What are some more examples?
lecture enhancer 14-2
PINTEREST SENDS SHOPPERS TO STORES
For the last year or so, many of the articles about retail featured in this newsletter mentioned the
perceived scourge of showrooming. This thoroughly modern phenomenon occurs when shoppers visit a
brick-and-mortar business solely to browse before they ultimately buy a product for cheaper online. Fear
over showrooming has gripped much of the retail world, leading at least one company to start charging
people to look around their stores.
According to a recent Harvard study, however, the threat of showrooming may not be as serious
as originally suspected. Out of a pool of 3,000 social media users, only 26 percent admitted to showroom-
ing regularly. Most interestingly, though, 41 percent said they did the exact opposite, meaning they
bought items in stores that they had previously discovered online. Many of these “reverse–showroomers”
are active on Pinterest, a social network that allows users to “pin” certain products or images they enjoy
onto a personalized online “board.” 36 percent of surveyed Pinterest users under 35 said they bought an
item after pinning, repinning or liking it.
By studying these consumers closely, retailers stand to learn a lot about the complementary rela-
tionship many people have developed between online and physical retailers. For instance, one prototypi-
cal consumer cited by the study is generalized as the “deal–seeker.” This person followed a link from a
retailer’s email to another social media site where she discovered a cute, affordable sweater. She pinned
the item on her Pinterest board and later followed through with a shopping trip. Others, known as “non–
seekers,” simply stumble into deals by receiving offers for products they have pinned. One non-seeker
who had pinned a picture of a mirror received a message from Pinterest telling her about an in-store sale
of the item, which led her to buy it that week. If more of these people indeed exist in the real world, then
the rise of the Internet may not signal the end of brick-and-mortar retailers after all. In fact, as long as
companies are not afraid to engage with their customers through social media, they could end up increas-
ing their foot traffic.i
Chapter 14 – Developing and Pricing Goods And Services
14-69
lecture enhancer 14-3
THE GROWING MARKET FOR GUILT-FREE SNACKS
As Americans become more health conscious, food companies have had to come up with increas-
ingly creative ways to keep people snacking. In fact, just last month we featured an article in the newslet-
ter about how smaller packaging can lead people to eat more than they normally would. But for a growing
number of consumers, fatty snacks like candy and potato chips are to be avoided no matter how they’re
packaged. That’s why a number of niche brands have popped up offering seemingly healthy alternatives
to the standard snack aisle.
Foods like kale chips and seaweed sheets provide consumers with what marketers are calling
“permissible indulgence.” While chocolate and Cheetos are seen as forbidden items, snacks made from
vegetables don’t elicit the same feelings of guilt in many consumers. That’s why food companies rolled
out 16 new seaweed-containing snacks in the first half of 2013, up from just three last year. Snacks featur-
ing beans and legumes are on the rise as well, with 51 new brands hitting the shelves already this year.
Looking at the industry as a whole, a recent study found that more than 71 percent of all snack foods on
the market made at least one health claim on their packaging.
But just because these snacks claim to be good for you doesn’t mean that’s precisely the case.
Like many packaged foods, reduced serving sizes on many “permissible” snacks skew the nutrition facts
to make these items appear healthier. For instance, a serving of Annie Chun’s Roasted Seaweed Snacks
clocks in at 30 calories but amounts to only 10 thin sheets of the stuff. Meanwhile, a one-ounce serving of
Beanitos Nacho Cheese chips has 140 calories, seven grams of fat and 140 milligrams of sodium. That
doesn’t make the black bean-based chip much healthier than a standard nacho cheese tortilla chip, which
boasts 146 calories, seven grams of fat and 174 million grams of sodium. So while these niche veggie
brands may be slightly better for the human body than other mass-produced foods, like all other snacks
they are to be enjoyed in moderation.ii
lecture enhancer 14-4
SMALLER PACKAGING LEADS TO BIGGER PROFITS
Though it might not seem like it to the casual snacker, packaging plays a big part in the way we
eat. Food companies spend a fortune studying the psychology behind our eating habits in order to discov-
er the most effective pathways into America’s stomachs. Surprisingly, they’ve found out that perhaps the
best way to keep customers snacking is through resealable packages rather than individually wrapped
ones. For example, research conducted by Hershey showed that individual wrappers on items like candy
or granola bars prevented people from eating them in certain situations, such as in the car.
In response the company unveiled Reese’s Minis, a small version of the brand’s signature peanut
butter cup in a resealable plastic bag. Placing unwrapped pieces of candy in this context encourages what
industry executives have dubbed “hand–to–mouth” eating. In this sense, consumers can simply unzip the
bag and grab a few treats, then close it back up until they get peckish again later. While this ultimately
causes the consumer to eat less in one particular moment, over time they actually tend to eat more of the
item. Part of this goes hand in hand with Americans’ near inability to judge portions. Since Reese’s Minis
are less caloric than their larger forbearers, people who would fret over eating an entire candy bar in one
sitting can sate their craving with just a few small pieces instead. All those isolated incidents add up,
however, and soon that same seemingly health conscious person is eating more candy than ever.

Chapter 14 – Developing and Pricing Goods And Services
14-70
This consistent consumption creates a relationship between the eater and the item, often leading
them to purchase the small-portioned snacks along with their other groceries. Since many candy bars are
purchased as impulse buys, the regular patronage brought on by savvier packaging is undoubtedly appeal-
ing to food companies. That’s why Hershey recently rolled out mini versions of Kit Kat, Rolo, Twizzlers,
and even its chocolate bar. The trend isn’t limited to candy, though. Small “grab-and-go” packages of
hummus made by the Sabra Dipping Company may have contributed to an overall increase in consump-
tion of the Mediterranean staple.iii
lecture enhancer 14-5
THE NEW BARCODES
The Universal Product Code (UPC) found on all consumer products has undergone a makeover in
the U.S. market. While the rest of the world has long used a 13-digit barcode, U.S. companies resisted
changing from their 12-digit system. In 2004, the Uniform Code Council, the nonprofit industry group
that oversees barcode standards in North America, adopted the global standard in 2004, and gave retail
stores just months to update their systems to accept the new codes. For retailers, the changeover did not
affect cash-register scanning. These machines could already read the longer codes. Retailer conversion
problems involved the back-end software systems that retailers use for inventory control and automated
reordering.
The new codes have four groups of numbers, each encoded with a specific type of information. In
a code such as 12 34567 89012 8, the individual digit groups reveal the following:
• The first group (12) is the country code. Numbers 00 through 13 indicate companies based in
the United States or Canada. Codes 54 and 76 would signify Belgium and Switzerland, re-
spectively.
• The five-digit group that follows (34567) is the company code, identifying each manufacturer
in the world.
• The second group of five digits (89012) is the article code, assigned to individual products by
manufacturers and registered in centralized databases through regional authorities like the
Uniform Code Council.
• The final digit (8) is a check digit. The 12 previous digits are run through a mathematical al-
gorithm that produces a single digit. This number is used to verify that a barcode is scanned
correctly.
Contrary to popular opinion, the UPC code does not include the product’s price. When the bar-
code is scanned, the digits in the UPC code are fed into the retailer’s central computer where the code is
matched with current price listing.iv
12 34567 89012 8

Chapter 14 – Developing and Pricing Goods And Services
14-71
lecture enhancer 14-6
DATES ON FOOD LABELS CAUSE CONFUSION
The information that appears on food packaging is under more scrutiny than ever as many people
carefully count their calories and regulators research companies’ health claims. However, there’s one line
on nearly every item of food that bamboozles both consumers and producers alike: the “sell by” date. Or
should we say the “use by” date? Whatever name it goes by on a particular package of food, misunder-
standing of its meaning causes Americans to toss out more than 40 percent of their food prematurely.
According to a report from the Natural Resources Defense Council (NRDC) and Harvard Univer-
sity, millions of consumers mistakenly believe that sell-by dates indicate when an item will spoil. In fact,
the dates refer solely to the food’s freshness, marking the time when it will be at its peak. Use of the dates
came to prominence in the 1970s as consumers began to prepare fewer foods at home but still demanded
information about production. Since the dates’ implementation was not an issue of public health, no na-
tional regulation arose that standardized their use. Instead the burden fell on states to define them, leading
to a variety of clashing standards. “Sometimes a product needs a date, sometimes it doesn’t,” says study
co-author Dana Gunders. “Sometimes a product cannot be sold after a different date. Or there is no re-
quirement at all.”
Although the authors of this report do not want the dates to be eliminated, they do recommend a
number of changes regarding their implementation. First of all, understanding the differences between
“use by” and “sell by” could eliminate a good deal of confusion right off the bat. While “use by” is print-
ed for the consumer to judge an item’s freshness, “sell by” dates are intended solely for manufacturers
and retailers for inventory purposes. The researchers also recommend national legislation to clarify the
dates’ meaning, which may already be in the works after the NRDC/Harvard report made a splash with a
few legislators in Washington.v
lecture enhancer 14-7
BABY PRODUCTS STAY STRONG AS PRICES RISE
Thanks to rising commodities costs, the product discounts that people enjoyed during the reces-
sion are on the decline. With prices on brand-name items spiking across the board, consumers once again
are flocking to generic equivalents to lessen the impact on their wallets. But at least one retail sector is
enjoying stable sales at the premium level. Sales of name-brand baby items from diapers to clothing are
staying steady as parents cut corners on their own personal products, but pay the higher prices for kids’
merchandise.
Market analysts found that shoppers are less likely to buy cheaper brands of baby products than
many other items. A recent study found that just 10% of consumers switched to a cheaper diaper brand
because “it’s not worth paying more in this category.” Conversely, nearly a third surveyed said they had
switched brands of liquid soap and bottled water. With that info in hand, Kimberly-Clark and Procter &
Gamble, makers of Huggies and Pampers, respectively, are increasing prices of diapers and wipes by as
much as 7%. Similarly, though sales in men’s, women’s and teen fashion have been anemic for years,
retailers have been able to hold the line for the most part when it comes to children’s clothing.
Chapter 14 – Developing and Pricing Goods And Services
14-72
Part of the reason why prices are rising now is because companies can’t find any more places to
cut corners. Trimming overhead became a top priority for many businesses during the recession, especial-
ly for retailers. Now that they’re out of ideas about how to cut costs any leaner, companies say they have
no choice but to raise prices. Nevertheless, many businesses could face consumer backlash as they switch
to private labels and generic products. Necessities like toilet paper and diapers are in a different league,
however, since it’s harder to reduce consumption of those items. With a larger market share at their com-
mand, brands like Huggies, Pampers, and even Charmin have more power to increase prices than others.
Still, Kimberly-Clark at least remains wary about driving prices too high. The company plans to reduce
sticker shock by reducing the volume of the packages rather than raising the price immediately.vi
lecture enhancer 14-8
THE MYSTIQUE OF COCA-COLA
One of the masters in product differentiation is Coca-Cola. The brand is worth $65 billion world-
wide. A critical element in this success is the aura of mystery around the product’s formula.
The 120-year-old formula for Coca-Cola is stored in a vault in the bowels of a SunTrust Bank in
Atlanta. That is one certainty. Everything else surrounding it—the need for a vote by Coke’s board of di-
rectors to open the vault, for example—may be urban legend.
Myth or not, at least three people recently risked jail time to breech the company’s air of mystery.
The three, including a former administrative assistant at Coke’s Atlanta headquarters, pleaded guilty in a
plot to sell Coca-Cola trade secrets to Pepsi for $1.5 million. The plot fizzled when Pepsi alerted Coca-
Cola, which then contacted the FBI.
The incident sparked fresh questions about whether the formula is an actual trade secret or mysti-
cal marketing.
History suggests it’s a mixture of both. In 1886 John Pemberton, a pharmacist, started Coca-Cola
with a recipe he created in his lab. Pemberton sold the concoction a few years later to Asa Candle, a busi-
nessman, who helped transform the soft drink into a success. This in turn made competitors and consum-
ers curious about what exactly went into the drink. Some swore that the main ingredient was cocaine, a
claim that the company denies. By 1919, when the Candlers sold Coca-Cola to a group of investors, the
secrecy surrounding the formula had become a marketing tool. The new owners made the formula a pop
culture legend when they placed the recipe in the Atlanta vault.
Experts say it is not impossible to decipher the formula and effectively clone Coca-Cola—but not
100%. Besides, copying it is pointless, say others, because it’s not the secret, it’s the branding that has
made Coke such a success.vii
lecture enhancer 14-9
TOP 10 NEW PRODUCTS IN HISTORY
Three hundred and fifty research and development executives were polled by New Product De-
velopment newsletter on the top 10 new products of all time. Their choices, in order, were:
1. The wheel
2. The bow and arrow
3. Telegraph
4. Electric light
5. Plow
Chapter 14 – Developing and Pricing Goods And Services
14-73
6. Steam engine
7. Vaccine
8. Telephone
9. Paper
10. Flush toilet
lecture enhancer 14-10
EXTENDING THE LIFE CYCLE ON A ROLLER COASTER
America’s love affair with the roller coaster has lasted over a century. In the final decades of the
past century, newer and scarier coasters were constructed to satisfy increasing sophisticated riders.
Theme-park owners scrambled trying to find creative ways to keep customers coming through the turn-
stiles.
Now many parks are finding a new lure—the haunted amusement park. Each October, Knott’s
Berry Farms sponsors a month-long Halloween celebration. A cast of 1,000 actors dressed in monster
costumes take over the amusement park, growling at unsuspecting bystanders. According to one actor,
“People scream, they flinch, they run, they faint because they get so scared.” The customers love it.
The haunted amusement park phenomenon, which started in the 1970s, has become a surefire
way for parks to keep riders happy and to extend peak travel season beyond the summer months.
Knott’s Berry Farm is not the only amusement park to use the scary approach. Disney World’s
Magic Kingdom devoted a record 15 nights to Halloween in the 2005 Halloween season. All Six Flags
parks in the United States celebrate Halloween with haunted houses. Magic Mountain in Valencia, Cali-
fornia, includes a roller coaster that rides backward.
A few of the parks prevent kids from entering during the haunted days. Most parks stress that the
events are rated PG-13 and try to discourage parents from bringing children. But a few parks actually ca-
ter to children and their families. Mickey’s Not–So-Scary Halloween Party at Disney World offers a pa-
rade, fireworks, story telling, and pictures with characters in Halloween costumes.viii
Chapter 14 – Developing and Pricing Goods And Services
14-74
critical
thinking exercises
Name: ___________________________
Date: ___________________________
critical thinking exercise 14-1
CHOOSING A BRAND NAME
Suggest an appropriate brand name for each of the following consumer products:
1. A cable TV network targeted at new parents with features on babies and toddlers
2. A chocolate-flavored vitamin drink
3. A sporty car targeted at middle-aged women
4. A glow-in-the-dark light switch
5. A breakthrough prescription drug to treat childhood diabetes
6. A restaurant serving Japanese and Chinese food
7. An easy-to-use handheld e-mail device targeted at technology-phobic senior citizens
8. An inexpensive line of cosmetics featuring vibrant colors
9. A magazine targeted on single career women
10. A high-end all-natural cat food
11. An exclusive line of children’s sports shoes

Chapter 14 – Developing and Pricing Goods And Services
14-75
critical thinking exercise 14-1 (continued)
12. A banana-flavored breakfast cereal
13. A mobile dental clinic
14. A digital camera/GPS (global positioning satellite) combination preloaded with maps of North
America