Comprehensive Problem, Colo Company (Continued)
Part 3—continued
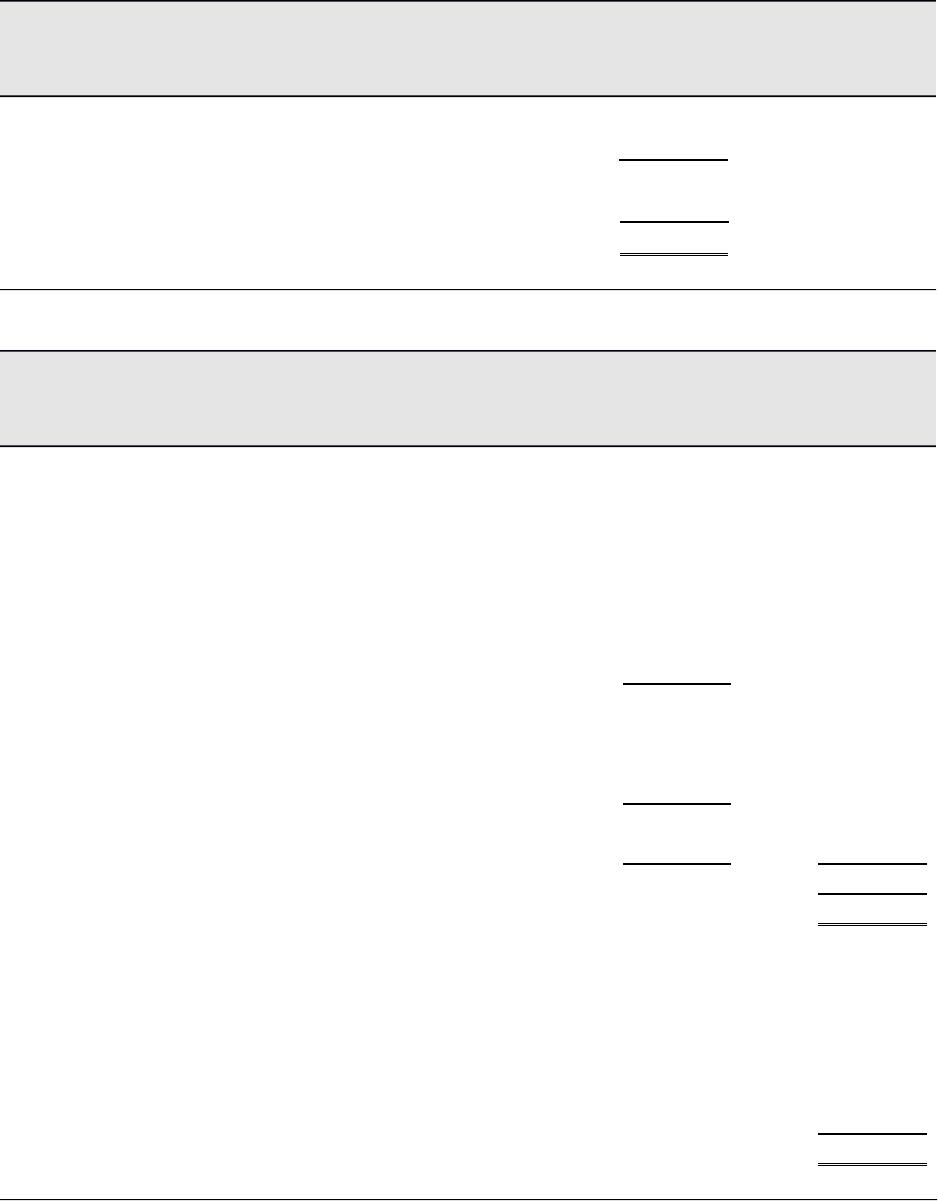
COLO COMPANY
Statement of Owner’s Equity
For Month Ended May 31, 2015
Jenny Colo, Capital, April 30, 2015……………. $308,085
Plus: Net income…………………………………….. 31,647
339,732
Less: Withdrawals by owner…………………….. (7,000)
Jenny Colo, Capital, May 31, 2015…………….. $332,732
COLO COMPANY
Balance Sheet
May 31, 2015
Assets
Current assets
Cash……………………………………………………. $135,911
Accounts receivable……………………………… 18,200
Merchandise inventory…………………………. 189,519
Office supplies…………………………………….. 504
Store supplies……………………………………… 2,632
Prepaid insurance………………………………… 2,765
Total current assets……………………………… $349,531
Plant assets
Office equipment………………………………….. 25,690
Less accumulated depreciation…………….. 10,227 15,463
Store equipment…………………………………… 38,920
Less accumulated depreciation…………….. 18,123 20,797
Total plant assets…………………………………. 36,260
Total assets…………………………………………… $385,791
Liabilities
Current liabilities
Accounts payable…………………………………. $ 53,059
Equity
Jenny Colo, Capital………………………………… 332,732
Total liabilities and equity……………………….. $385,791
Comprehensive Problem, Colo Company (Concluded)
Part 4
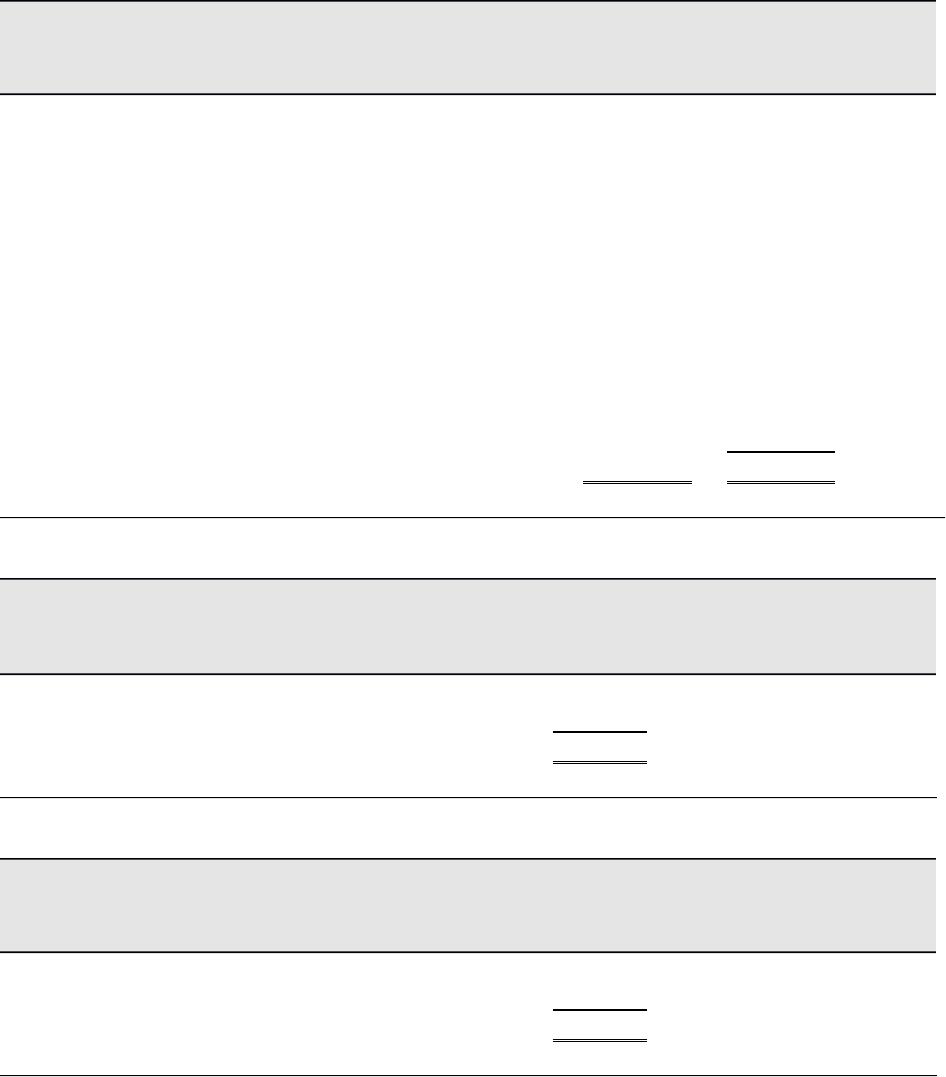
COLO COMPANY
Post-Closing Trial Balance
May 31, 2015
Cash……………………………………………………………$135,911
Accounts receivable……………………………………. 18,200
Merchandise inventory………………………………… 189,519
Office supplies……………………………………………. 504
Store supplies…………………………………………….. 2,632
Prepaid insurance……………………………………….. 2,765
Office equipment…………………………………………. 25,690
Accumulated depreciation—Office equip………. $ 10,227
Store equipment………………………………………….. 38,920
Accumulated depreciation—Store equip……….. 18,123
Accounts payable……………………………………….. 53,059
Jenny Colo, Capital……………………………………… _______ 332,732
Totals………………………………………………………….$414,141 $414,141
COLO COMPANY
Schedule of Accounts Receivable
May 31, 2015
Crane Corp…………………………………………… $14,210
Hensel Company …………………………………. 3,990
Total accounts receivable……………………… $18,200
COLO COMPANY
Schedule of Accounts Payable
May 31, 2015
Peyton Products…………………………………… $ 3,080
Gear Supply Co……………………………………. 49,979
Total accounts payable…………………………. $53,059

Reporting in Action — BTN 7-1
1. Apple’s Note 11 reports on its business segment.
2. Apple identifies and describes its reportable segment in its Note 11 as
follows: “The Company manages its business primarily on a
geographic basis. The Company’s reportable operating segments
consist of the Americas, Europe, Greater China, Japan, Rest of Asia
Pacific and Retail operations. The Americas segment includes both
North and South America. The Europe segment includes European
countries, as well as India, the Middle East and Africa. The Greater
China segment includes China, Hong Kong and Taiwan. The Rest of
Asia Pacific segment includes Australia and Asian countries, other than
those countries included in the Company’s other operating segments.
The Retail segment operates Apple retail stores in 13 countries,
including the U.S. The results of the Company’s geographic segments
do not include results of the Retail segment. Each operating segment
provides similar hardware and software products and similar services.
3.
Segment
Operating
Income
Average
Assets
Return on
Assets
Americas………………….. $22,817 $5,589 408.2%
Europe…………………….. 13,025 3,115 418.1
Greater China…………… 8,541 2,132 400.6
Japan………………………. 6,819 2,315 294.6
Rest of Asia Pacific…... 3,753 918 408.8
Retail 4,025 3,027 133.0
Interpretation: The Europe segment reports the highest return on
segment assets. Segments close behind are: Rest of Asia Pacific,
Americas, and Greater Chica. Its Retail segment has the lowest return.
Instructor note: Depending on the depth of discussion, one might
mention that Apple’s shared corporate assets are not assigned to
segments; thus, its return on assets ratio for each segment appears
quite large. Nevertheless, one can sometimes draw inferences about
the profitability across segments—more detailed analyses is covered
in advanced courses.
4. Solution depends on the most recent information obtained.

Comparative Analysis — BTN 7-2
1. Apple – Current Year Revenue/Segment Assets
Domestic segment: $ 62,739 / [($ 5,653 + $5,525)/2] = 1122%
International segment: $108,171/ [($13,261 + $9,752)/2] = 940%
Google – Current Year Revenue/Segment Assets
Domestic Segment: $26,768 / [($24,004 + $20,985)/2] = 119%
International Segment: $33,057 / [($14,030 + $12,359)/2] = 251%
2. Apple’s domestic revenue as a percent of its domestic assets is
markedly higher than that of Google’s for the domestic segment. For
the international segment, Apples revenue as a percent of assets is
also markedly higher than Google’s. For both Apple and Google, their
sales are roughly split between domestic and international (although
Apple has a bit more international than domestic sales). Apple’s higher
revenue/assets ratio, for both domestic and international segments, is
meaningful and positive for its future performance assessments and
expectations.

Ethics Challenge — BTN 7-3
1. Independence in fact means that the auditor maintains an objective
point of view of the client. Independence in appearance means that a
third party viewing the relationship between the auditor and client
would have no reason to believe that the auditor is not independent of
the client.
2. While auditors are hired by their clients to perform audits, auditors
have a responsibility to the company’s “stakeholders” and the public.
In our society, auditors provide credibility to financial reporting by
offering professional audit opinions about companies’ financial
statements. While it is sometimes difficult to be responsible to clients,
as well as to the stakeholders and the public, auditors must maintain
their independence to keep the public’s trust.
3. Since Erica Gray is a sole practitioner it is questionable whether she
can consult on the client’s accounting system and then remain
objective in subsequent years when she performs the audit of the
company. Large firms often separate consulting and auditing
engagements for the same client by having staff stationed in two
different geographic branches of the firm do the work. Or a large local
firm might be able to perform consulting and auditing for the same
client by assigning different personnel to the two jobs. In this
scenario, Erica Gray would need to do both jobs herself, making it
difficult to maintain independence in fact and appearance.
(Note to instructors: The Sarbanes-Oxley Act specifically prohibits auditors
from providing financial information and system designs for their SEC audit
clients. This was codified by the SEC [Final Ruling 68].)
Communicating in Practice — BTN 7-4
The memo should recommend the use of special journals and subsidiary
ledgers. It should explain the time-saving aspect of journalizing in labeled
columns and also the posting of column totals representing the impact of
groups of like transactions. The memo should discuss the timely
information provided by subsidiary ledgers regarding customer and
creditor balances. A discussion of the uses of a schedule for verifying the
accuracy of subsidiary ledgers should also be included.

Taking It to the Net — BTN 7-5
(See Dell’s Note 15 – Segment Information)
1. Large Enterprise; Public; Small and Medium Business; and Consumer.
2. The Large Enterprise segment reports $1,553 million of operating income
and the Large Enterprise segment reports $3,054 million of assets.
These totals are larger than its next largest segments, which is Small
and Medium Business segment with $1,505 million in operating income
and the Public segment with $1,940 million in assets.
3. Dell’s Operating Income and Total Assets by Segment
($ millions)
Operating
Income 2013
Total Assets 2013 :
Total Assets 2012
Segment Return
on Assets
Large Enterprise………..$ 1,553 $3,054 : $2,729 53.7%
Public……………………….$ 1,238 $1,940 : $1,873 64.9%
Small & Medium
Business…………………$ 1,505 $1,161 : $1,107 132.7%
Consumer…………………$ (11) $1,138: $1,249 (0.9)%
The Small and Medium Business had the highest segment return on
assets for the fiscal year ended 2013 with a 132.7% return. The other
three segments had returns on assets ranging from (0.9)% to 64.9%.
4. The six product groups reported by Dell include: Desktop PCs, Mobility, Software and peripherals, Servers and networking, Enhanced
services, and Storage.
($ millions) 2013 Fiscal Year
Mobility……………………………………………………… $15,303 26.9%
Desktop PCs …………………………………………….. 12,991 22.8
Servers and networking……………………………… 9,294 16.3
Software and peripherals……………………………. 9,257 16.3
Services……………………………………………………. 8,396 14.7
Storage……………………………………………………… 1,699 3.0
Totals………………………………………………………… $56,940 100.0%
Dell earned more—in both dollars and returns—from its Mobility group;
its Desktop PCs was second in both categories.

Teamwork in Action — BTN 7-6
For check figures in the implementation of this activity see the solution
to Problem 7-1A or 7-1B.
Entrepreneurial Decision — BTN 7-7
1. The following special journals are likely to be used:
Sales journal to record credit sales
Cash receipts journal to record all cash receipts
Purchases journal to record credit purchases
Cash disbursements journal to record all cash payments
General journal to record all transactions not in special journals
The company also is likely to use the following subsidiary ledgers:
Accounts receivable subsidiary ledger to track amounts owed by
individual customers
Accounts payable ledger to track amounts owed to individual vendors
Inventory ledger to keep track of all different inventory items
(including inventory ready to sell, inventory in the process of being
completed, and materials to be used in the production of inventory)
2.
Year
One Year
Hence
Two Years
Hence
Three Years
Hence
Four Years
Hence
Five Years
Hence
Sales………………………..$1.00 mil 1.20 mil $1.38 mil $1.725 mil $2.07 mil
Computations Year 2: $1.00 mil x 120% = $1.20 mil
Year 3: $1.20 mil x 115% = $1.38 mil
Year 4: $1.38 mil x 125% = $1.725 mil
Year 5: $1.725 mil x 120% = $2.07 mil
If sales follow the growth projected, the company will have more than doubled the current $1.00 mil in annual
sales to $2.07 mil annually.

Global Decision — BTN 7-8
1. Samsung has the following reported segments:
Korea
America
Europe
Asia and Africa
China
2. Samsung discloses dollar amounts for the following line items:
Total segment revenue
Intercompany revenue
Revenue from external customers
Non-current assets
3. Yes. On most financial measures reported, the Korea segment appears to dominate Samsung’s other segments.