Comprehensive Problem, Colo Company (Continued)
Part 2—continued
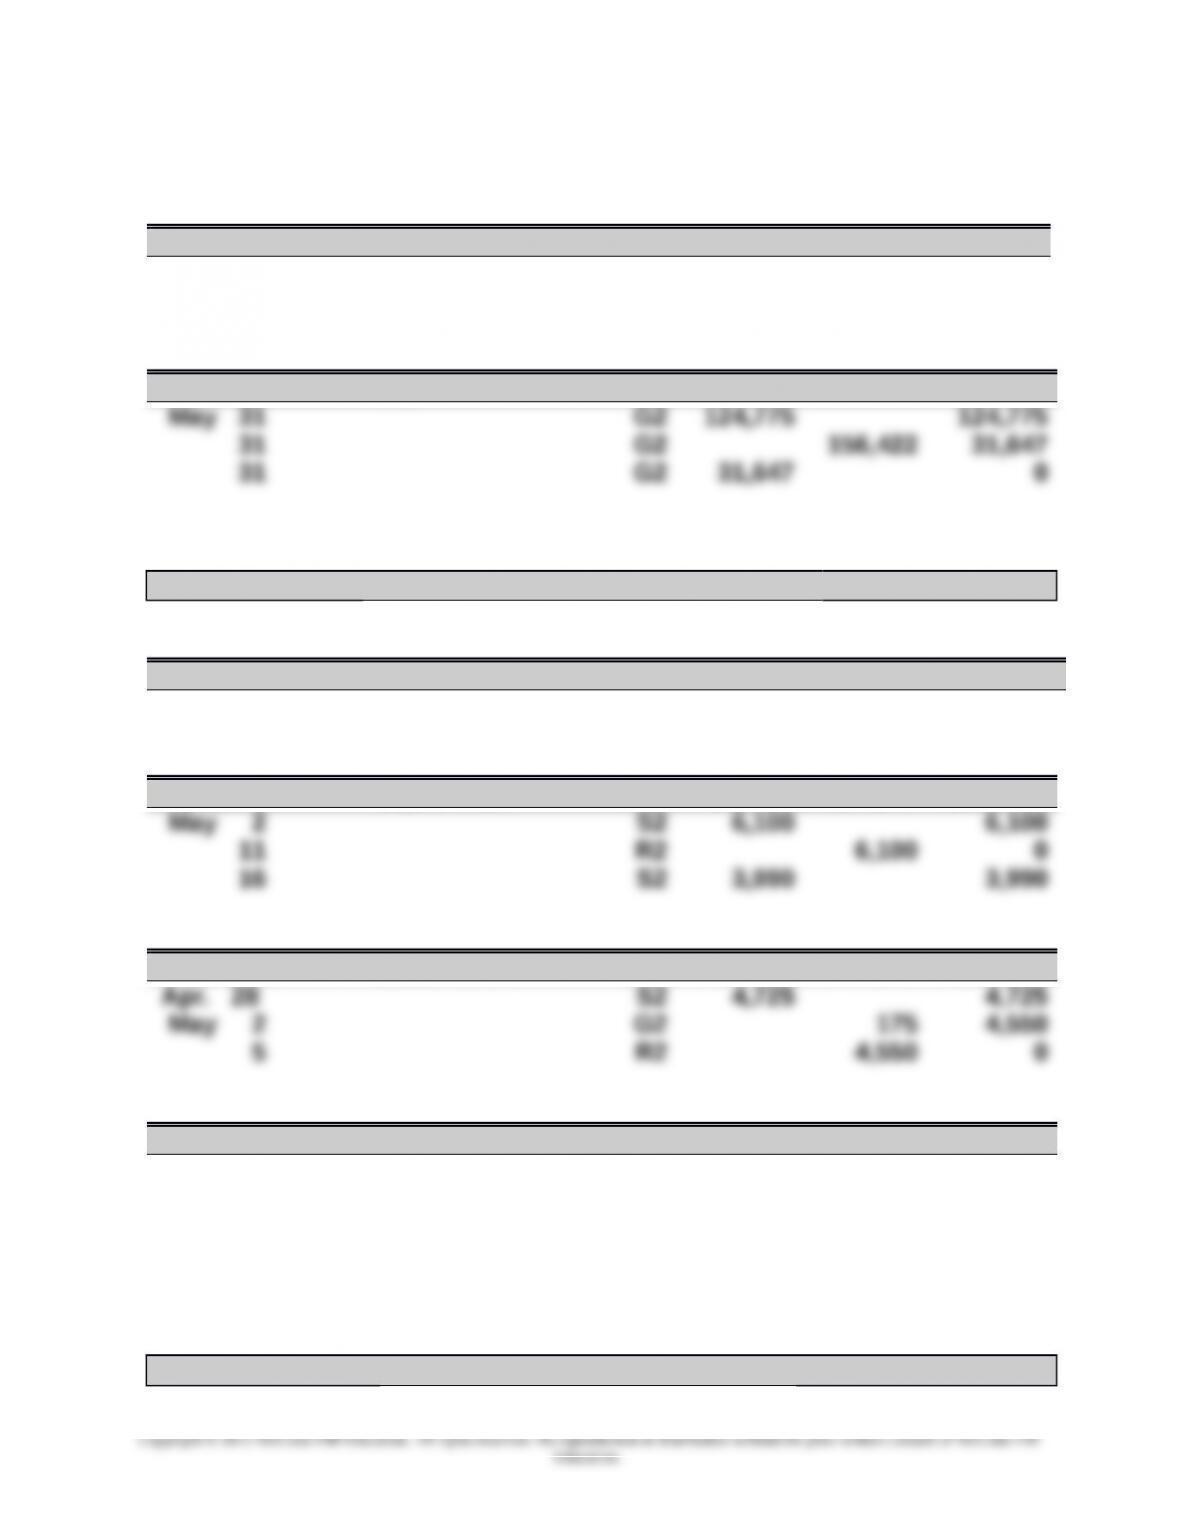
Utilities Expense Acct. No. 690
Date Explanation PR Debit Credit Balance
May 26 D2 1,283 1,283
31 G2 1,283 0
Income Summary Acct. No. 901
Date Explanation PR Debit Credit Balance
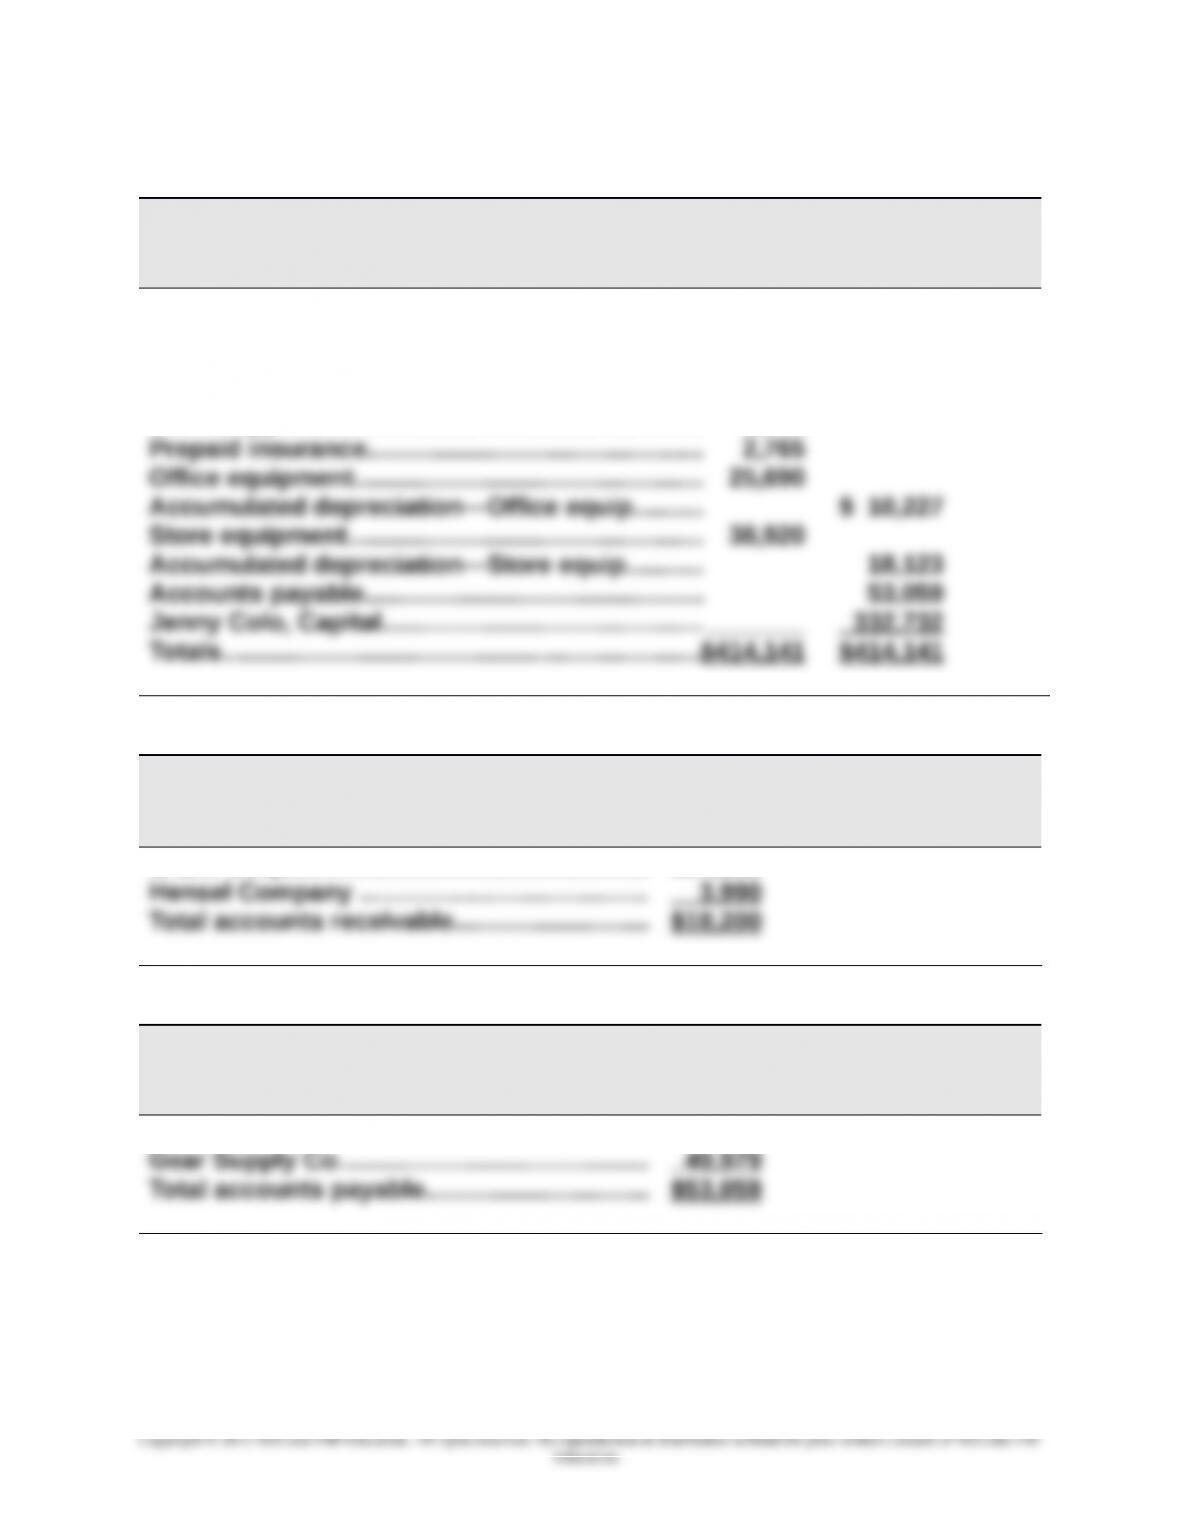
ACCOUNTS RECEIVABLE LEDGER
Crane Corp.
Date Explanation PR Debit Credit Balance
May 26 S2 14,210 14,210
Hensel Company
Date Explanation PR Debit Credit Balance
Knox, Inc.
Date Explanation PR Debit Credit Balance
Lee Services
Date Explanation PR Debit Credit Balance
May 22 S2 6,850 6,850
30 R2 6,850 0
Comprehensive Problem, Colo Company (Continued)
Part 2—continued
ACCOUNTS PAYABLE LEDGER
7-1
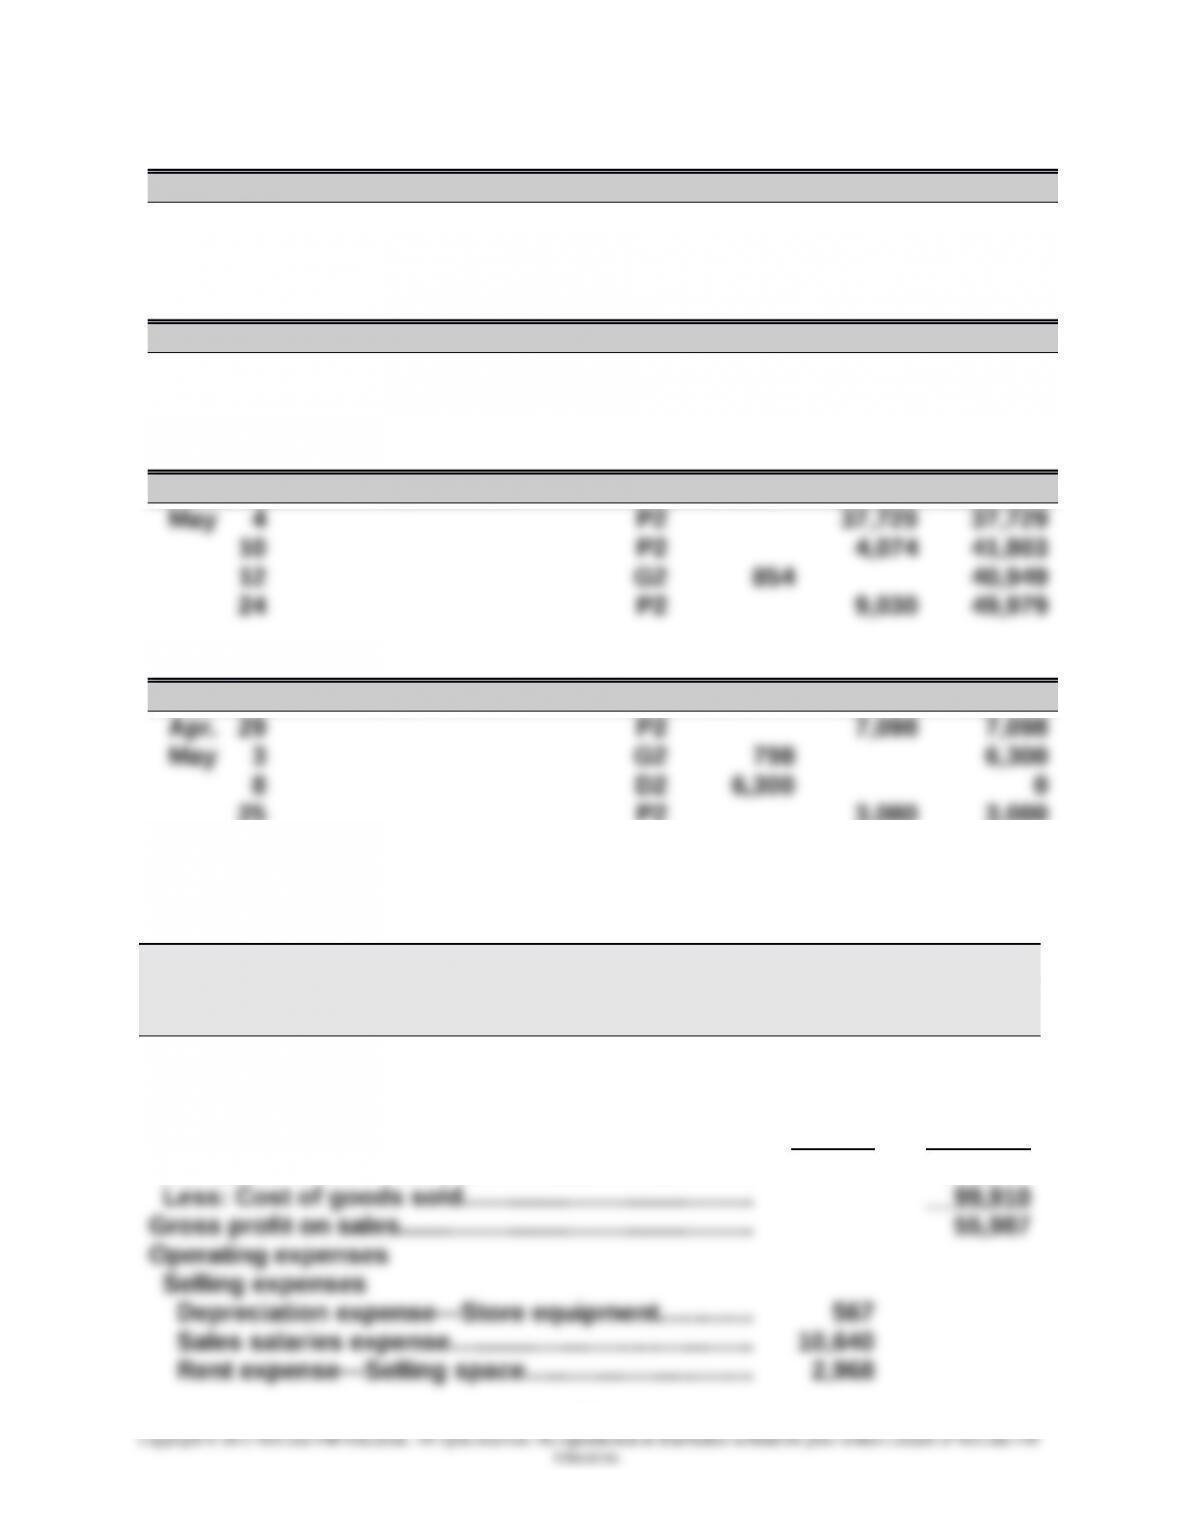
Fink Corp.
Date Explanation PR Debit Credit Balance
May 17 P2 13,650 13,650
23 D2 13,650 0
Garcia, Inc.
Date Explanation PR Debit Credit Balance
May 11 P2 8,800 8,800
19 D2 8,800 0
Gear Supply Co.
Date Explanation PR Debit Credit Balance
Peyton Products
Date Explanation PR Debit Credit Balance
25 P2 3,080 3,080
Comprehensive Problem, Colo Company (Continued)
Part 3
COLO COMPANY
Income Statement
For Month Ended May 31, 2015
Revenue
Sales…………………………………………….…….….….…….. $156,422
Less: Sales discounts………….….…….….….…….….. $ 350
Sales returns and allowances..….…............ 175 525
Net sales……………………………………………………..….… 155,897
7-2
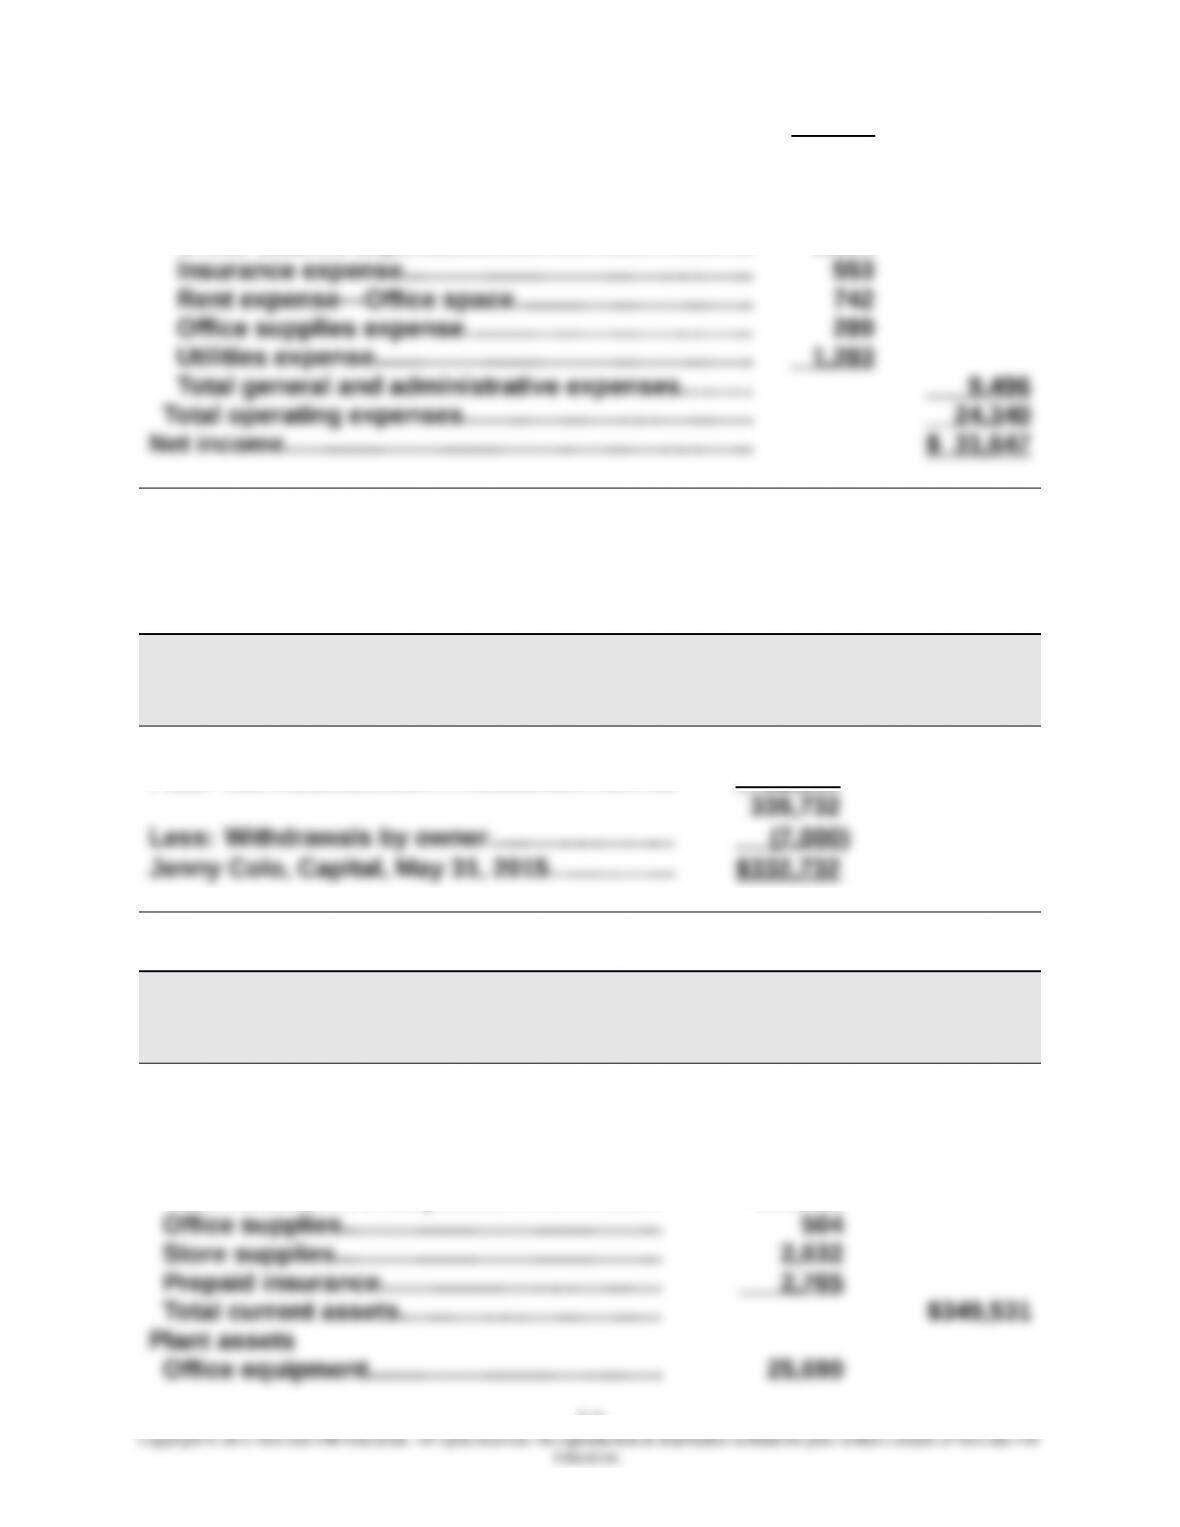
Store supplies expense…………..….…….….…….…... 669
Total selling expenses…………..….…….….…….….…. 14,844
General and administrative expenses
Depreciation expense—Office equipment............ 329
Office salaries expense…….….….…….….….…….….. 6,300
Comprehensive Problem, Colo Company (Continued)
Part 3—continued
COLO COMPANY
Statement of Owner’s Equity
For Month Ended May 31, 2015
Jenny Colo, Capital, April 30, 2015………..…… $308,085
Plus: Net income……………………….….….….….. 31,647
COLO COMPANY
Balance Sheet
May 31, 2015
Assets
Current assets
Cash……………………………………………………… $135,911
Accounts receivable………………………………. 18,200
Merchandise inventory……….….…….….….… 189,519
7-3
Less accumulated depreciation……………… 10,227 15,463
Store equipment………………………….…….….. 38,920
Less accumulated depreciation……………… 18,123 20,797
Total plant assets…………….….….…….….…… 36,260
Total assets……………………………………….….… $385,791
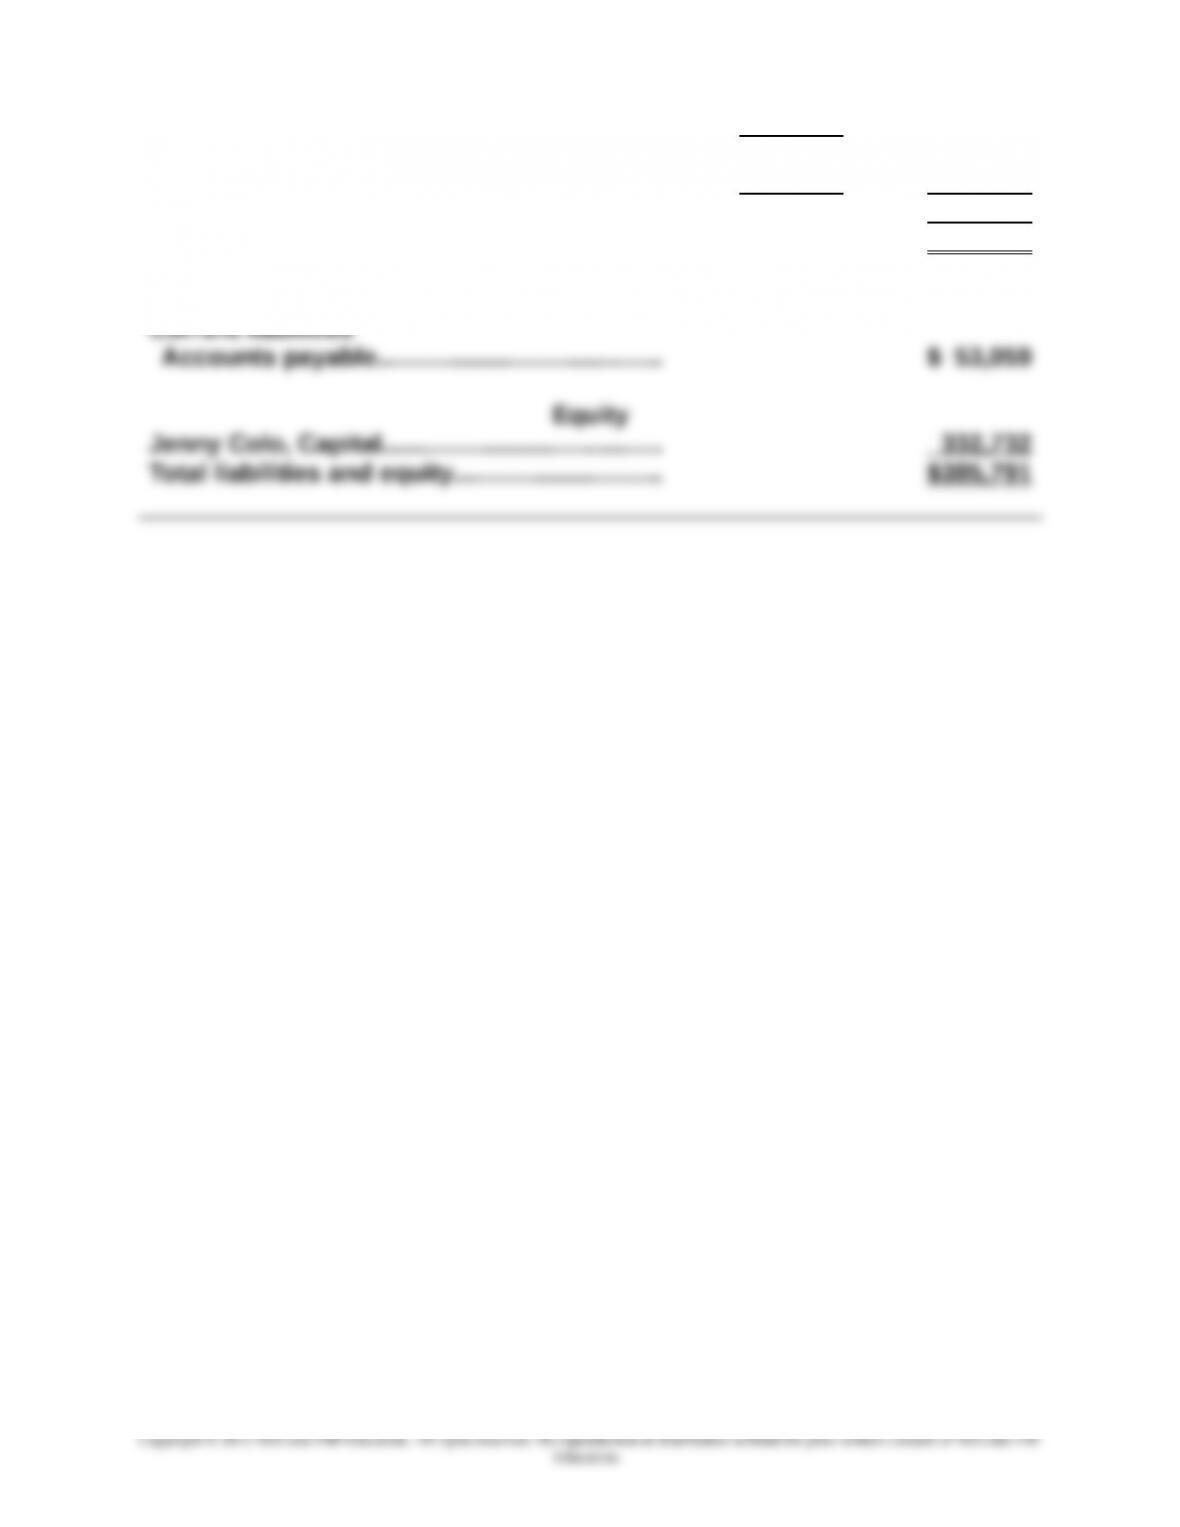
Liabilities
7-4
Comprehensive Problem, Colo Company (Concluded)
Part 4
COLO COMPANY
Post-Closing Trial Balance
May 31, 2015
Cash…………………………………………………………..…$135,911
Accounts receivable………………….….…….….….… 18,200
Merchandise inventory………………….…….….….… 189,519
Office supplies……………………………………………... 504
Store supplies…………………………………………….... 2,632
COLO COMPANY
Schedule of Accounts Receivable
May 31, 2015
Crane Corp……………………………….…….….…. $14,210
COLO COMPANY
Schedule of Accounts Payable
May 31, 2015
Peyton Products………………………..….….…… $ 3,080
7-5
Reporting in Action — BTN 7-1
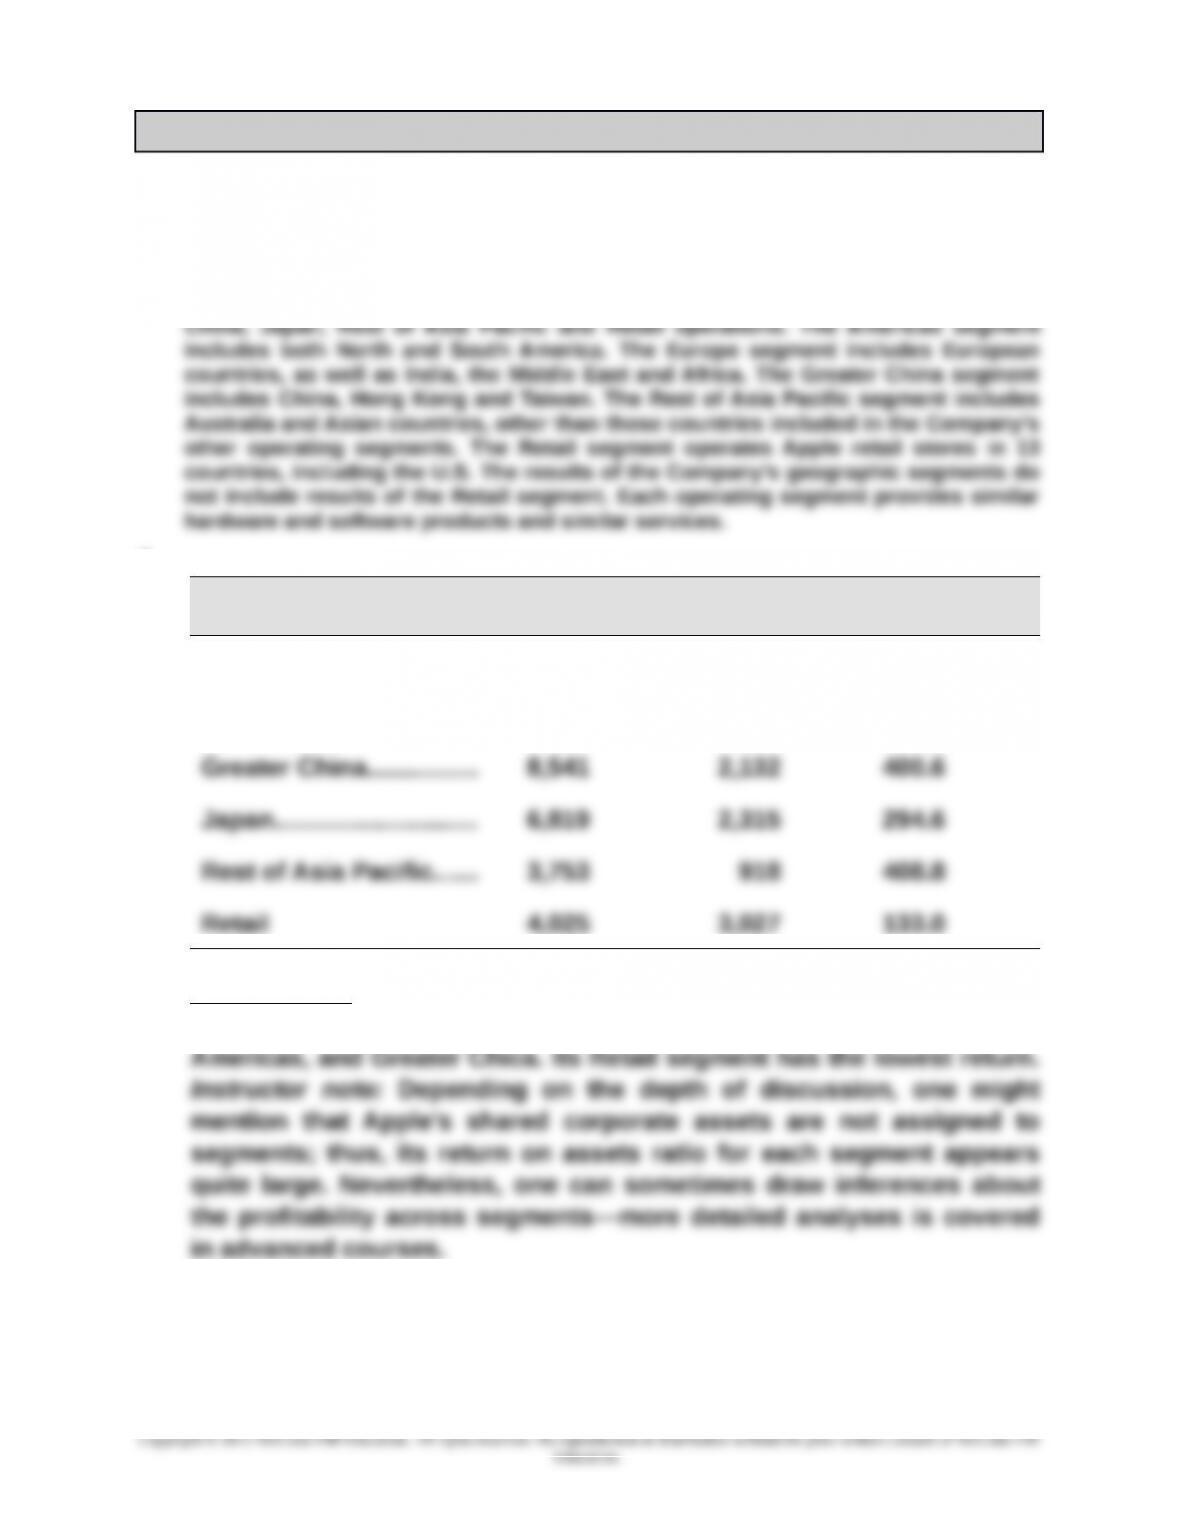
1. Apple’s Note 11 reports on its business segment.
2. Apple identifies and describes its reportable segment in its Note 11 as
follows: “The Company manages its business primarily on a geographic basis. The
Company’s reportable operating segments consist of the Americas, Europe, Greater
3.
Segment
Operating
Income
Average
Assets
Return on
Assets
Americas…….….……...... $22,817 $5,589 408.2%
Europe……….…….….…… 13,025 3,115 418.1
Interpretation: The Europe segment reports the highest return on
segment assets. Segments close behind are: Rest of Asia Pacific,
4. Solution depends on the most recent information obtained.
7-6
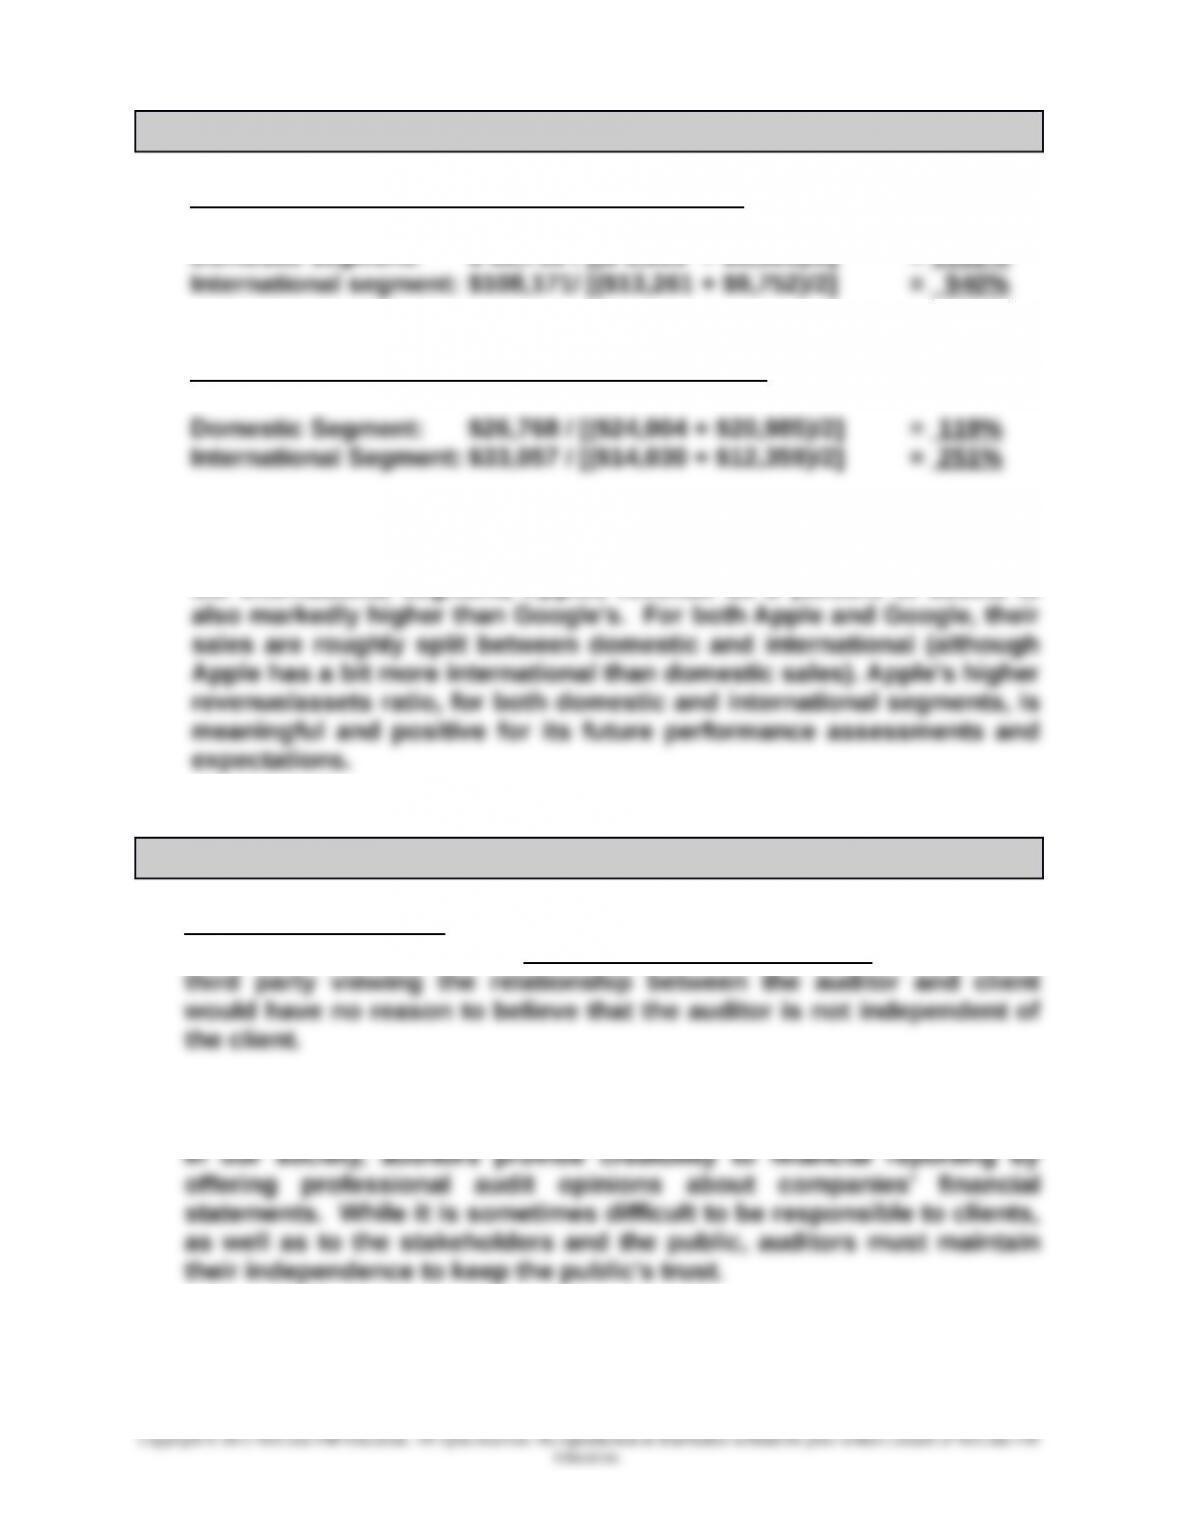
Comparative Analysis — BTN 7-2
1. Apple – Current Year Revenue/Segment Assets
Domestic segment: $ 62,739 / [($ 5,653 + $5,525)/2] = 1122%
Google – Current Year Revenue/Segment Assets
2. Apple’s domestic revenue as a percent of its domestic assets is
markedly higher than that of Google’s for the domestic segment. For
the international segment, Apples revenue as a percent of assets is
Ethics Challenge — BTN 7-3
1. Independence in fact means that the auditor maintains an objective
point of view of the client. Independence in appearance means that a
2. While auditors are hired by their clients to perform audits, auditors
have a responsibility to the company’s “stakeholders” and the public.
3. Since Erica Gray is a sole practitioner it is questionable whether she
can consult on the client’s accounting system and then remain
objective in subsequent years when she performs the audit of the
7-7
Communicating in Practice — BTN 7-4
The memo should recommend the use of special journals and subsidiary
ledgers. It should explain the time-saving aspect of journalizing in labeled
7-8
Taking It to the Net — BTN 7-5
(See Dell’s Note 15 – Segment Information)
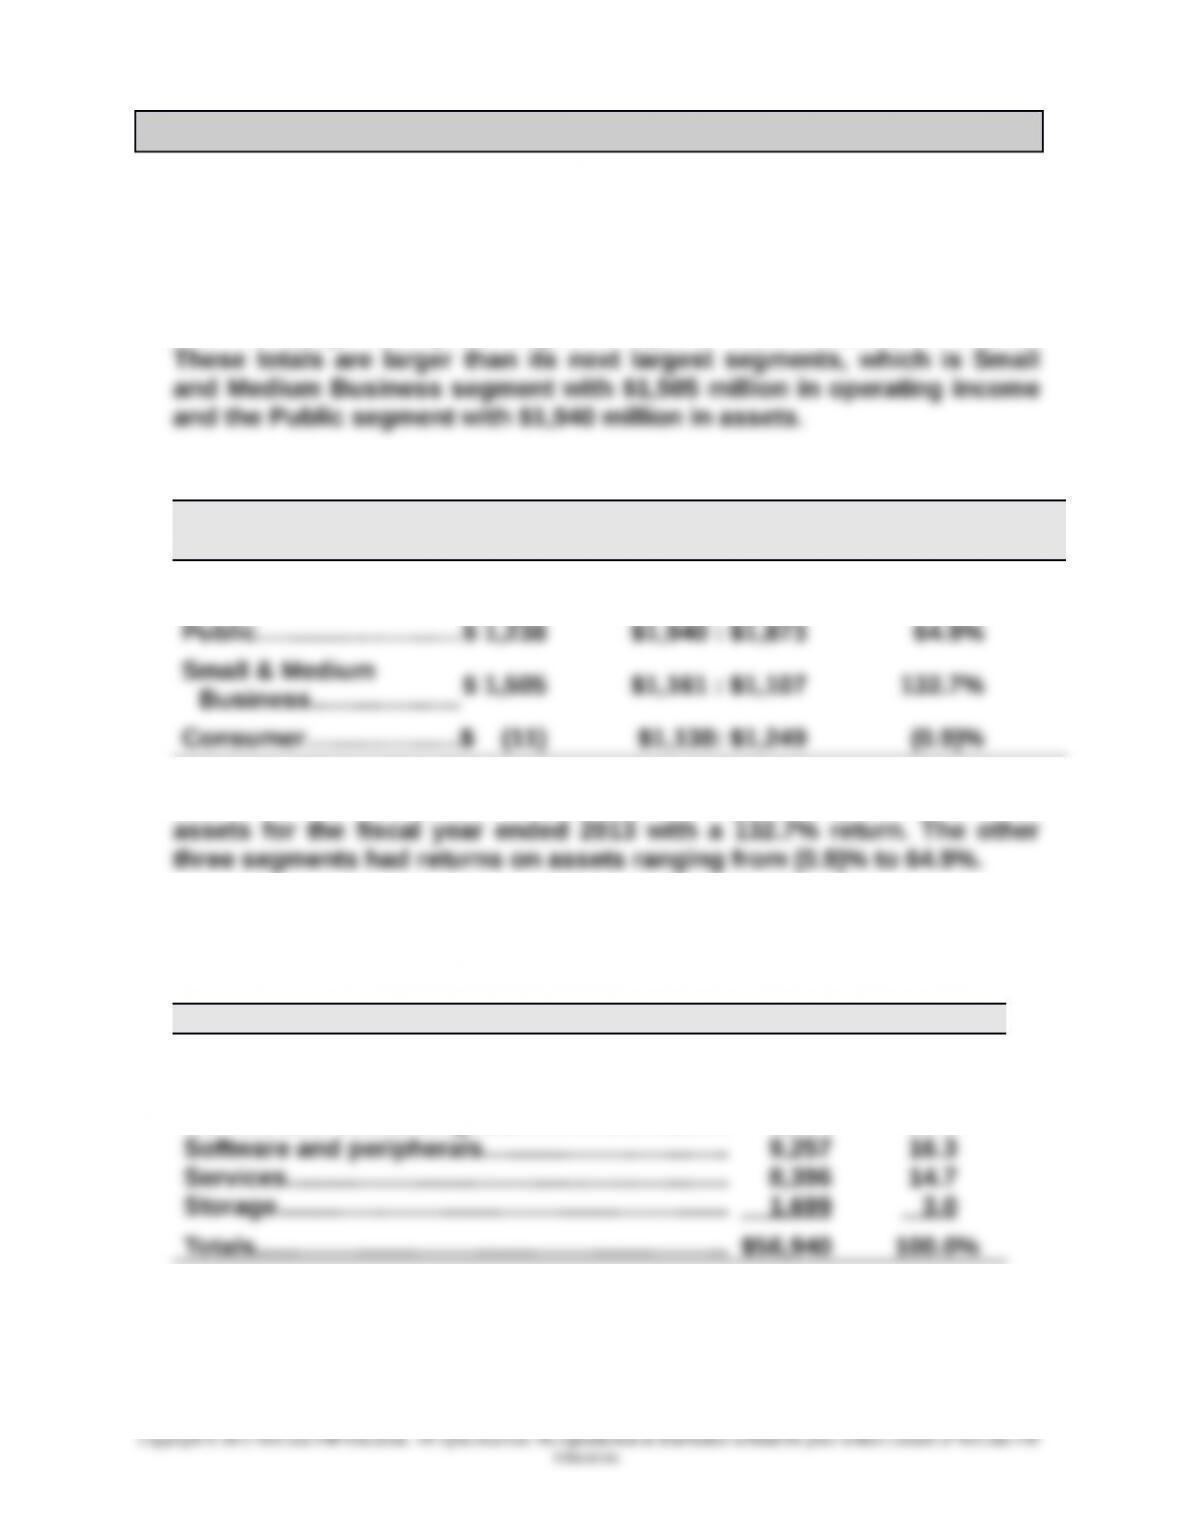
1. Large Enterprise; Public; Small and Medium Business; and Consumer.
2. The Large Enterprise segment reports $1,553 million of operating income
and the Large Enterprise segment reports $3,054 million of assets.
3. Dell’s Operating Income and Total Assets by Segment
($ millions)
Operating
Income 2013
Total Assets 2013 :
Total Assets 2012
Segment Return
on Assets
Large Enterprise...........$ 1,553 $3,054 : $2,729 53.7%
The Small and Medium Business had the highest segment return on
4. The six product groups reported by Dell include: Desktop PCs, Mobility,
Software and peripherals, Servers and networking, Enhanced services,
and Storage.
($ millions) 2013 Fiscal Year
Mobility…………………………………….….….…….…... $15,303 26.9%
Desktop PCs …………………………………………..….. 12,991 22.8
Servers and networking……………….…….….……. 9,294 16.3
Dell earned more—in both dollars and returns—from its Mobility group;
its Desktop PCs was second in both categories.
7-9
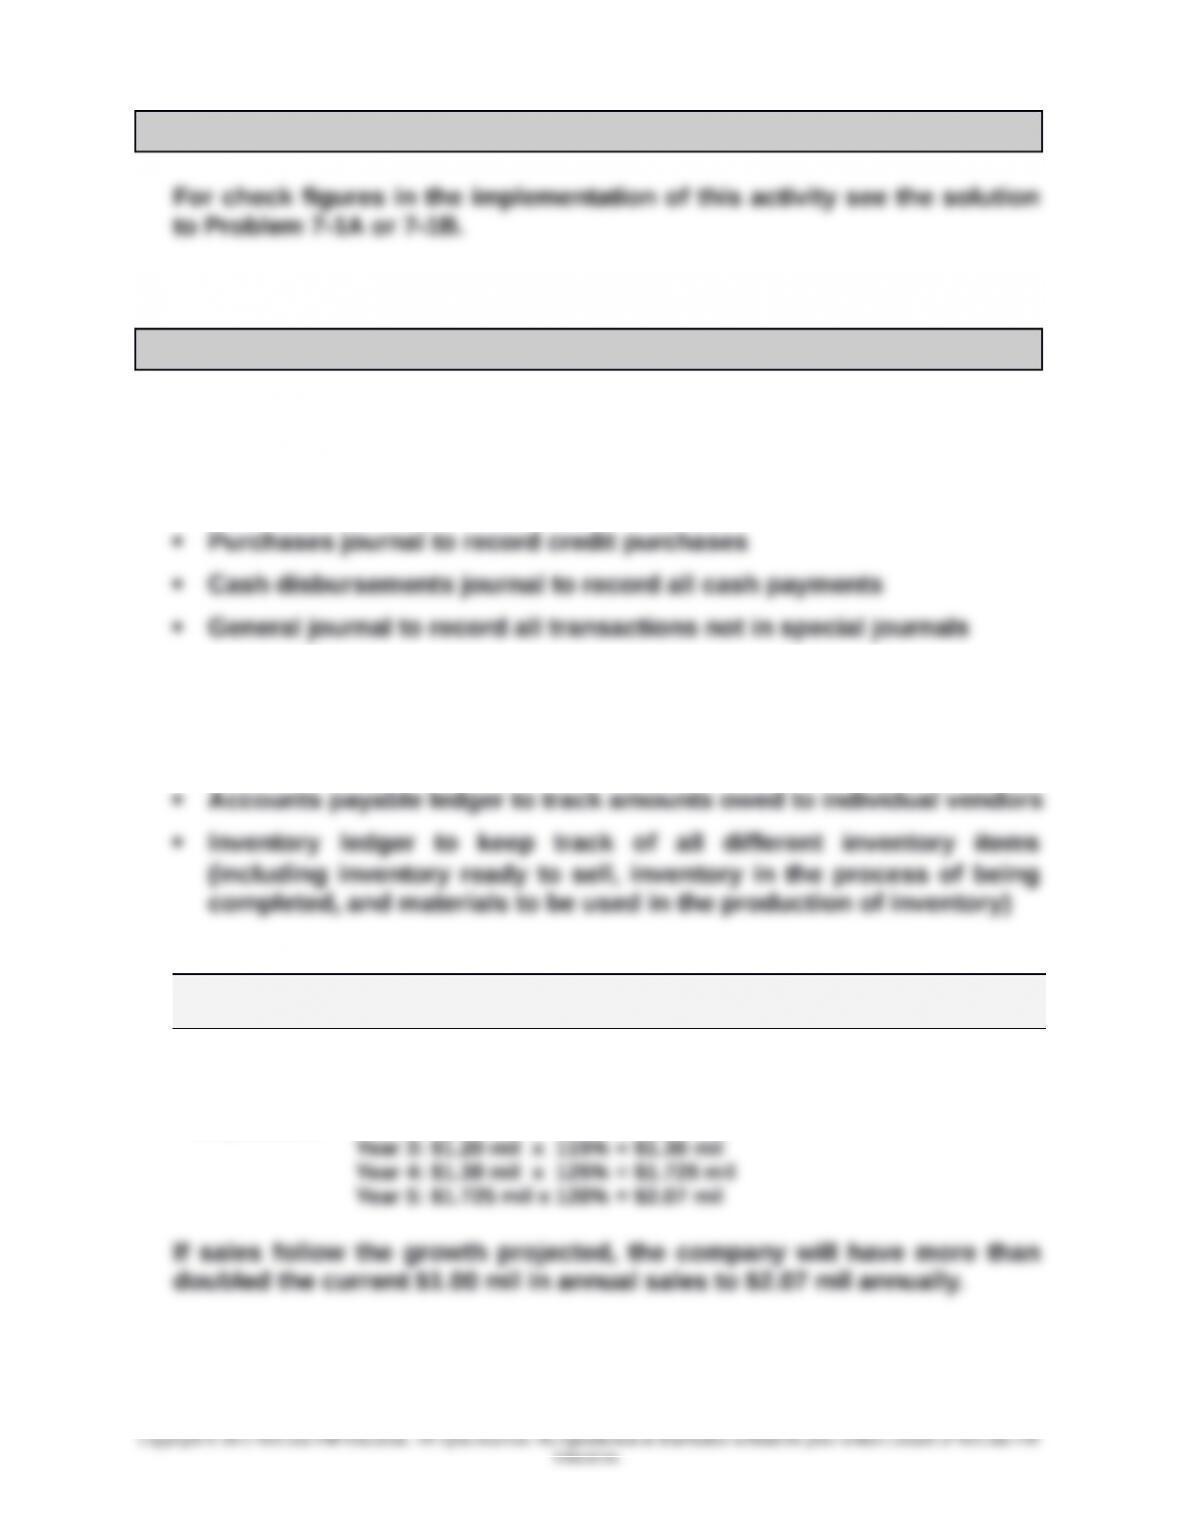
Teamwork in Action — BTN 7-6
Entrepreneurial Decision — BTN 7-7
1. The following special journals are likely to be used:
Sales journal to record credit sales
Cash receipts journal to record all cash receipts
The company also is likely to use the following subsidiary ledgers:
Accounts receivable subsidiary ledger to track amounts owed by
individual customers
2.
Year
One Year
Hence
Two Years
Hence
Three Years
Hence
Four Years
Hence
Five Years
Hence
Sales………….…….….…...$1.00 mil 1.20 mil $1.38 mil $1.725 mil $2.07 mil
Computations Year 2: $1.00 mil x 120% = $1.20 mil
7-10
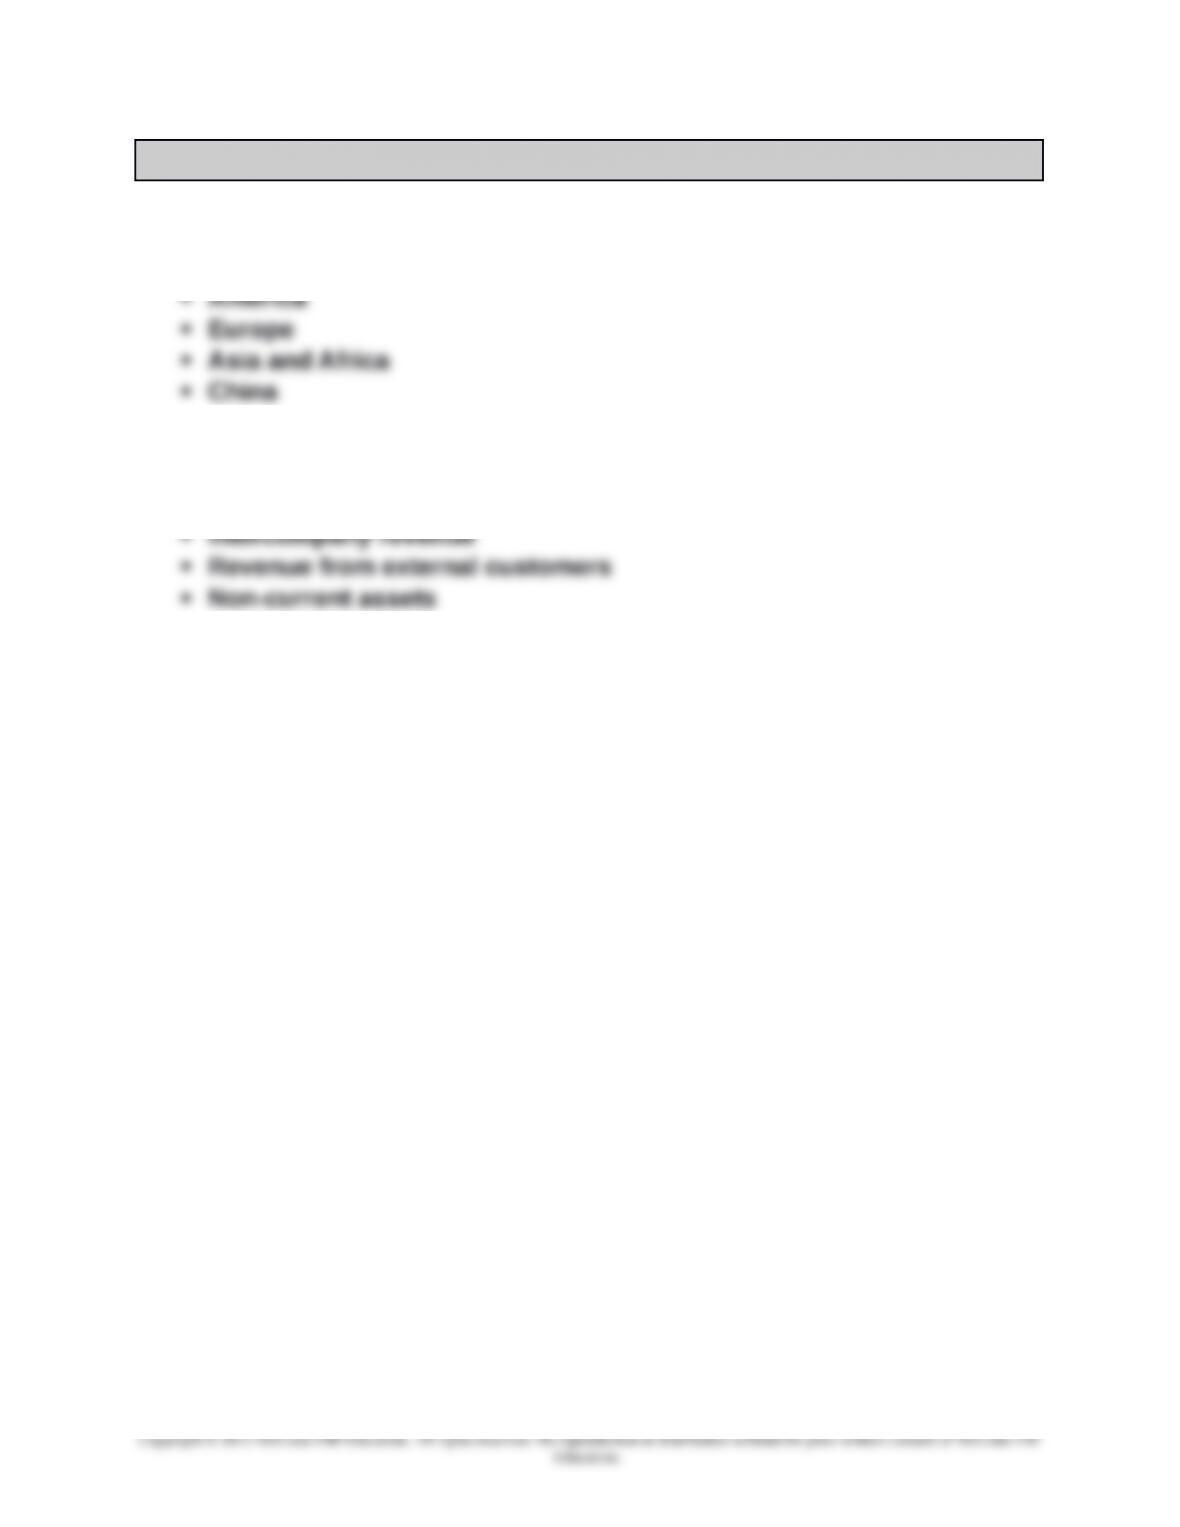
Global Decision — BTN 7-8
1. Samsung has the following reported segments:
Korea
2. Samsung discloses dollar amounts for the following line items:
Total segment revenue
3. Yes. On most financial measures reported, the Korea segment appears
to dominate Samsung’s other segments.
7-11