Problem 6-8BA (30 minutes)
Part 1
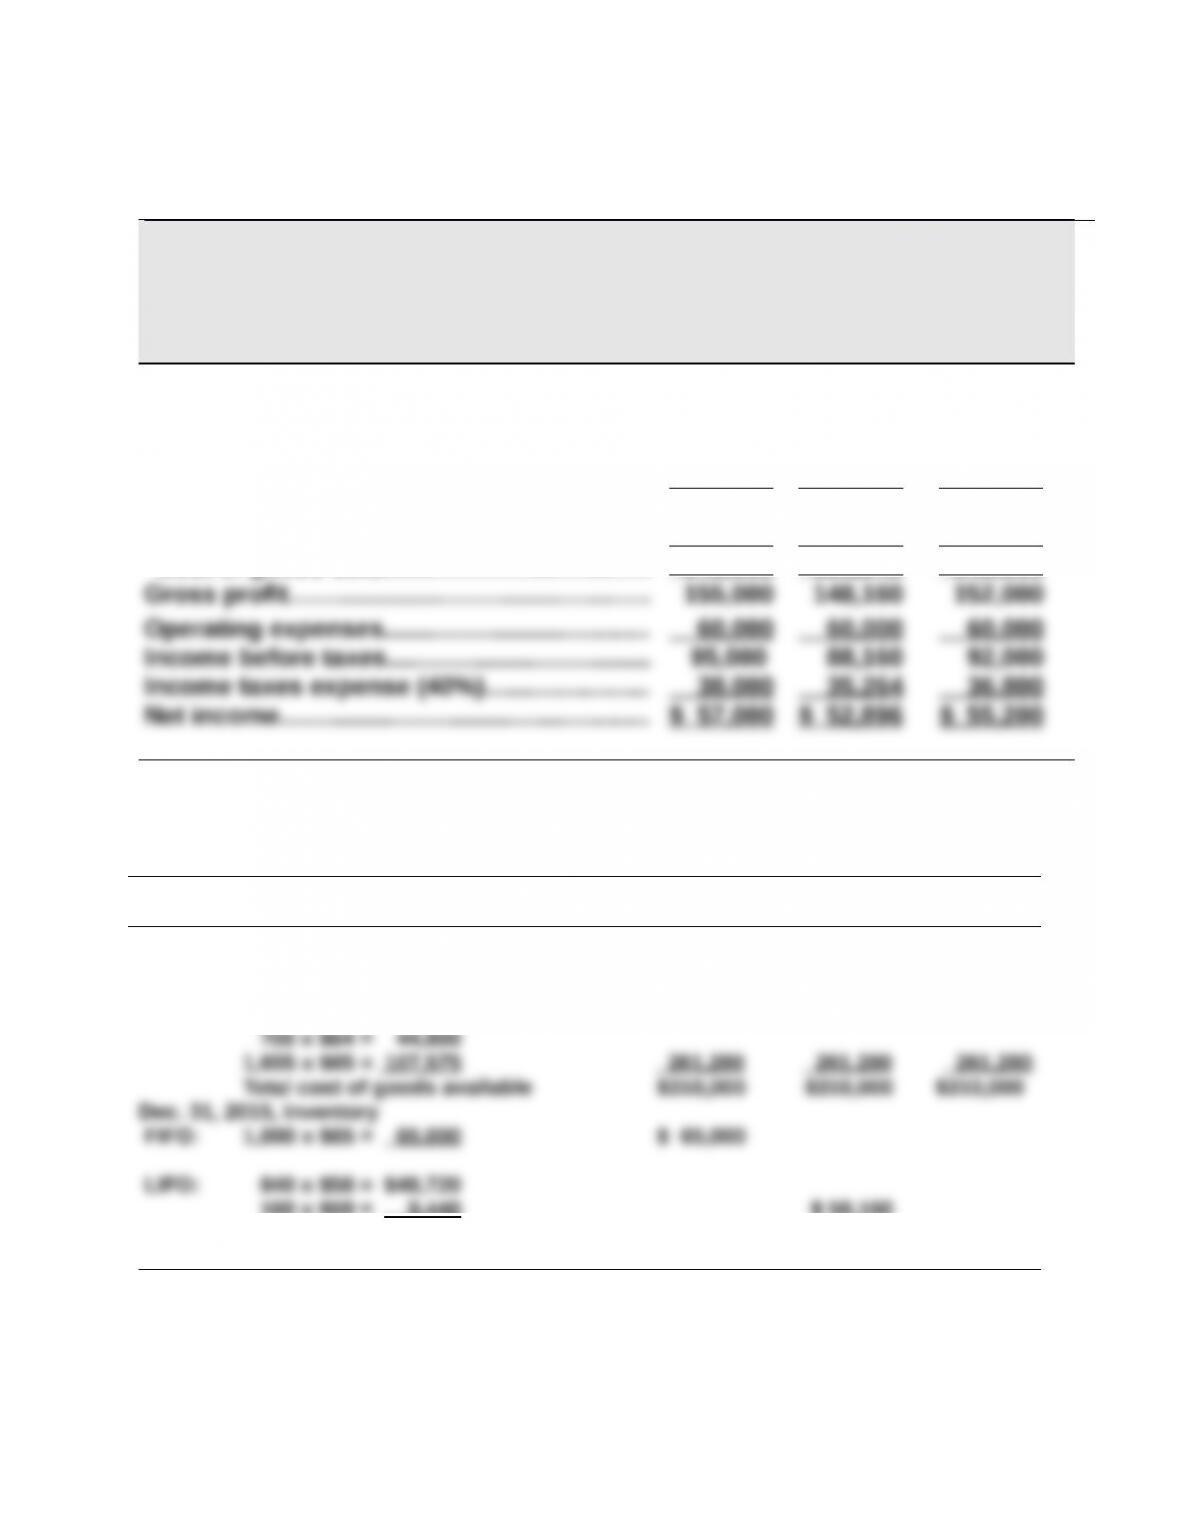
SHEPARD COMPANY
Income Statements Comparing FIFO, LIFO, and Weighted Average
For Year Ended December 31, 2015
FIFO LIFO
Weighted
Average
Sales……………………………………………………… $400,000 $400,000 $400,000
Cost of goods sold
Inventory, Dec. 31, 2014……….………….……. 48,720 48,720 48,720
Cost of purchases………….….…………………. 261,280 261,280 261,280
Cost of goods available for sale................ 310,000 310,000 310,000
Inventory, Dec. 31, 2015……….………….……. 65,000 58,160 62,000
Cost of goods sold……………….…………….… 245,000 251,840 248,000
Supporting calculations
FIFO LIFO
Weighted
Average
Dec. 31, 2014, inventory (840 x $58)................... $ 48,720 $ 48,720 $ 48,720
Purchases
600 x $59 = $ 35,400
1,205 x $61 = 73,505
160 x $59 = 9,440 $ 58,160
W.A.: ($310,000/5,000) x 1,000 $ 62,000
Problem 6-8BA (Concluded)
Part 2
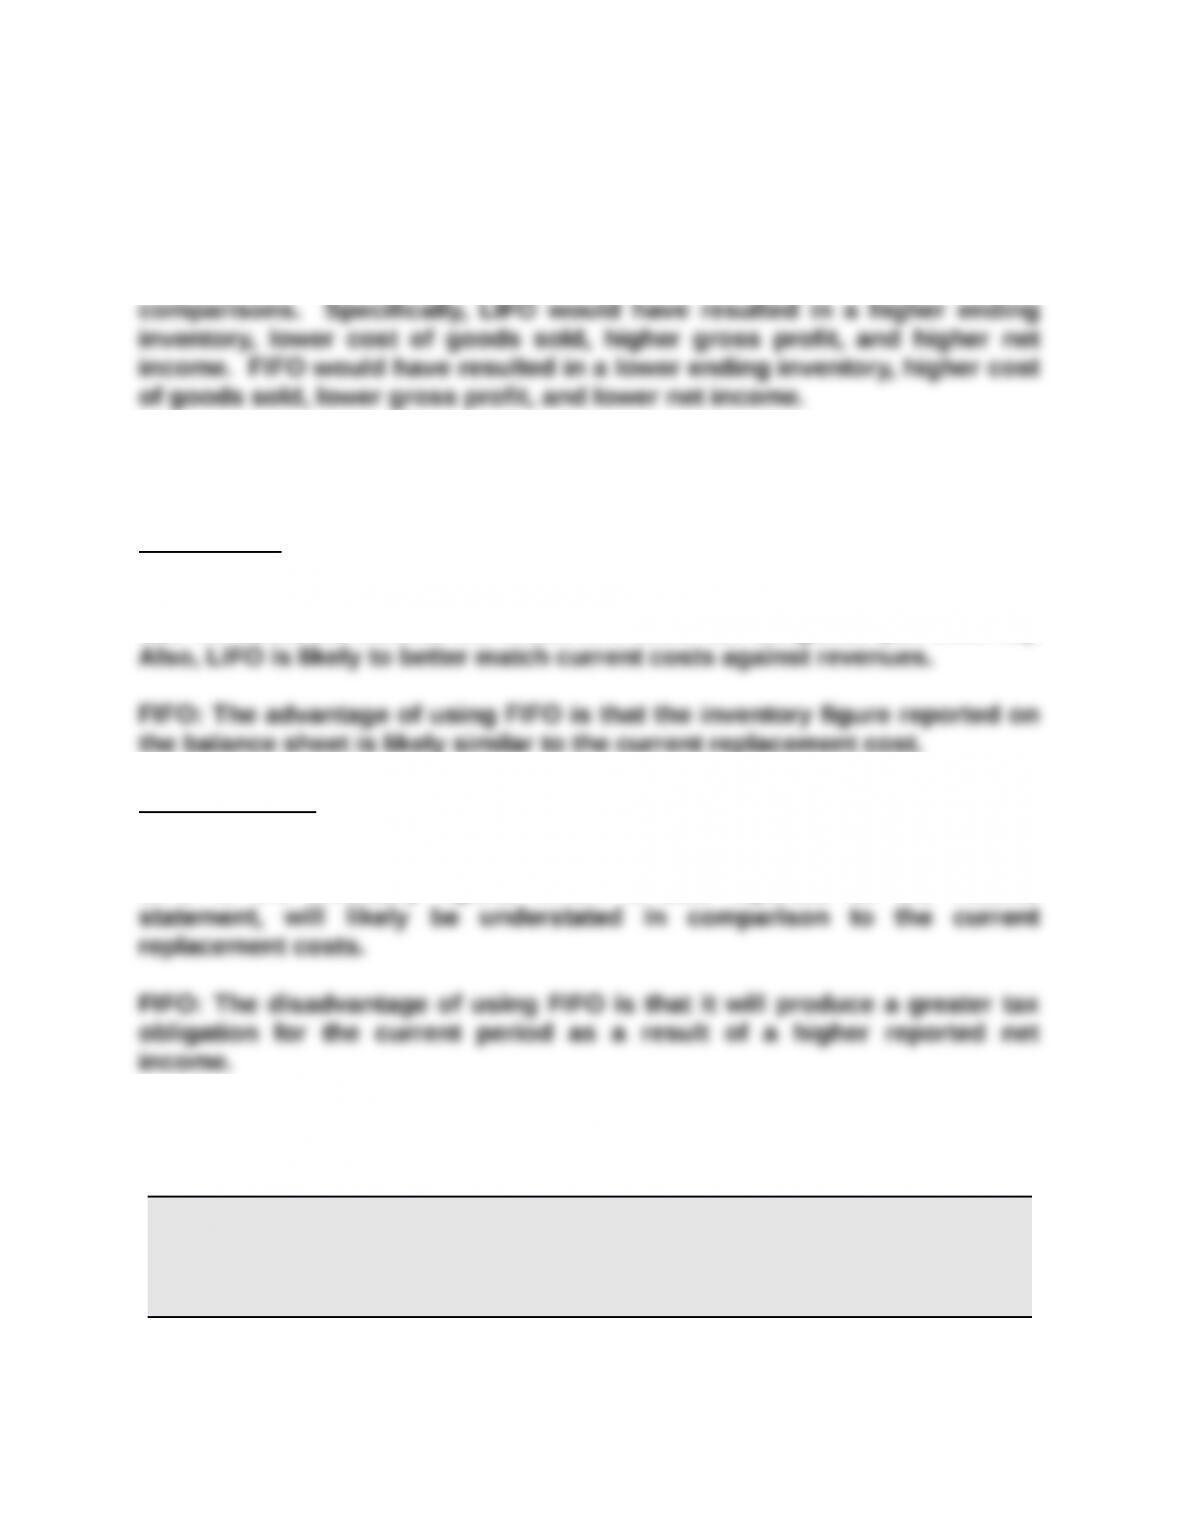
If Shepard Company had been experiencing decreasing costs in the
acquisition of inventory, we would observe the opposite results in our
Part 3
Advantages
LIFO: Assuming a trend of increasing costs, the advantage of using LIFO is
that the lower net income will result in a lower tax obligation (tax deferral).
Disadvantages
LIFO: Assuming a trend of increasing costs, the disadvantage of using
LIFO is the inventory figure, which is also reported on the income
Problem 6-9BB (25 minutes)
Part 1
MACKLIN COMPANY
Estimated Inventory
December 31
At Cost At Retail
Goods available for sale
Beginning inventory……………………..….……………. $ 90,022 $115,610
Cost of goods purchased….…………….…………….. 502,250 761,830
Goods available for sale…………….………………….. $592,272 $877,440
Part 2
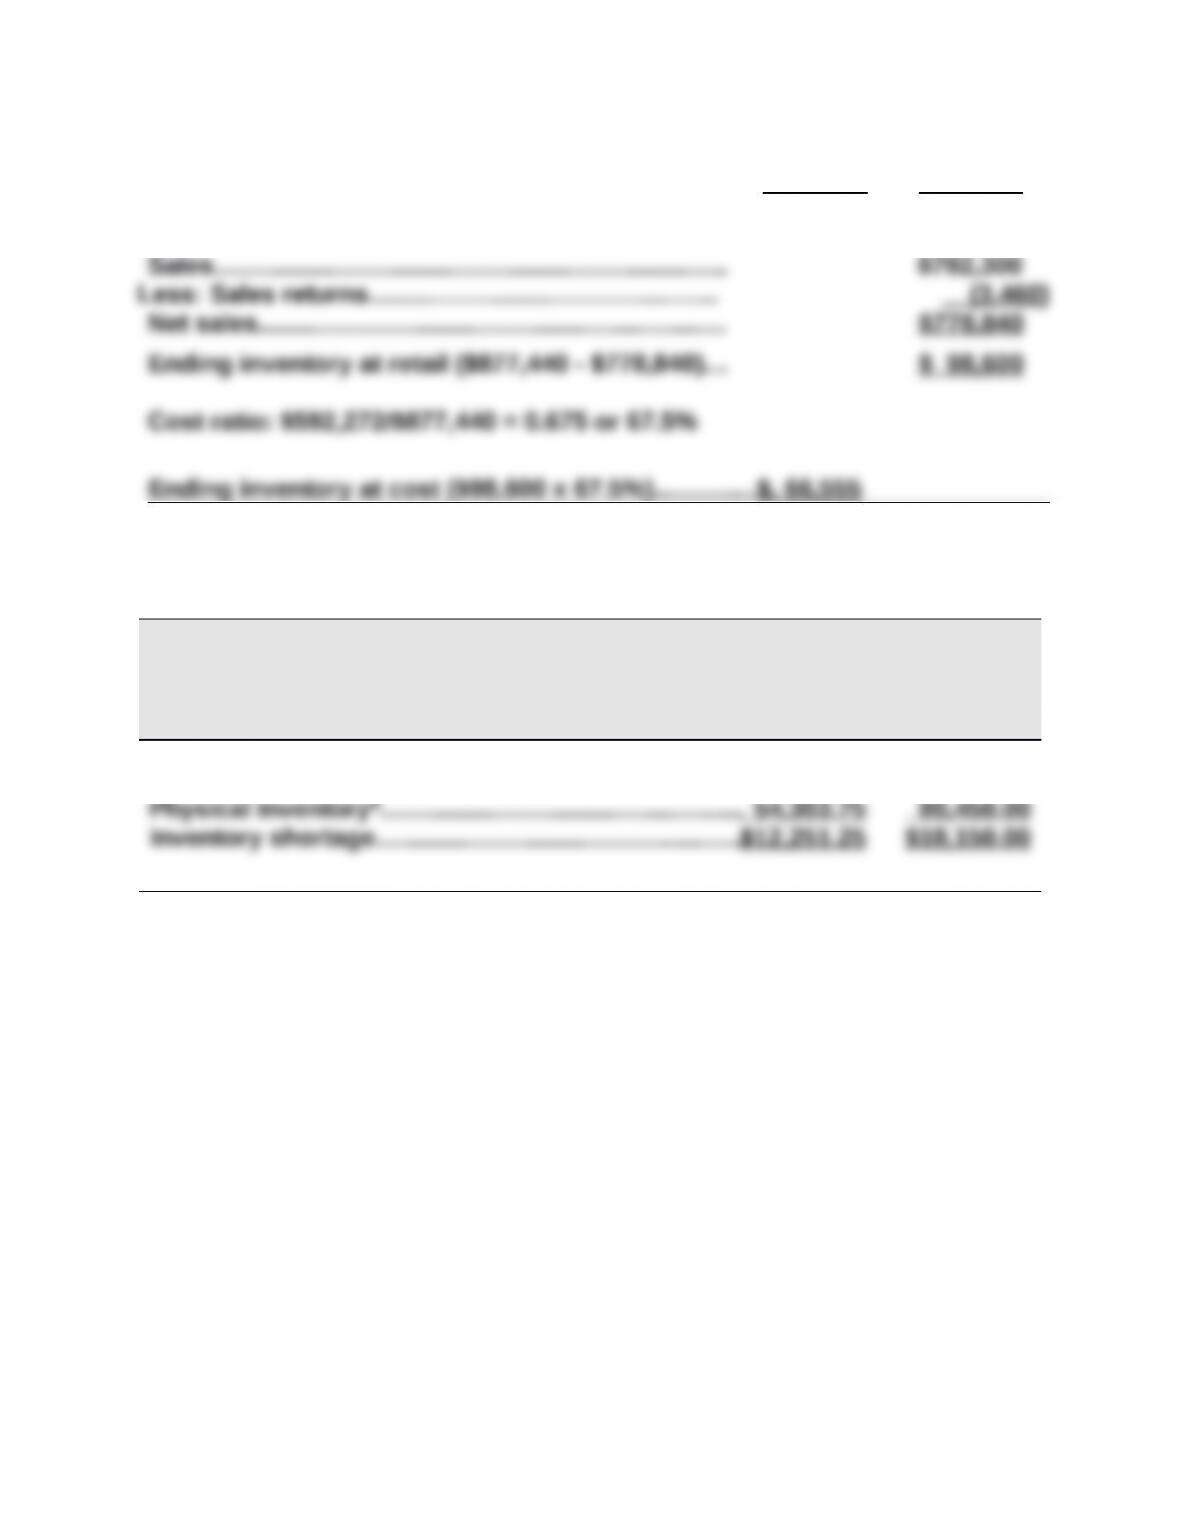
MACKLIN COMPANY
Inventory Shortage
December 31
At Cost At Retail
Estimated inventory (from part 1)………………………..$66,555.00 $98,600.00
* $54,303.75 = $80,450 (given) x 67.5% (from part 1)—some students may round amounts
to the nearest dollar.
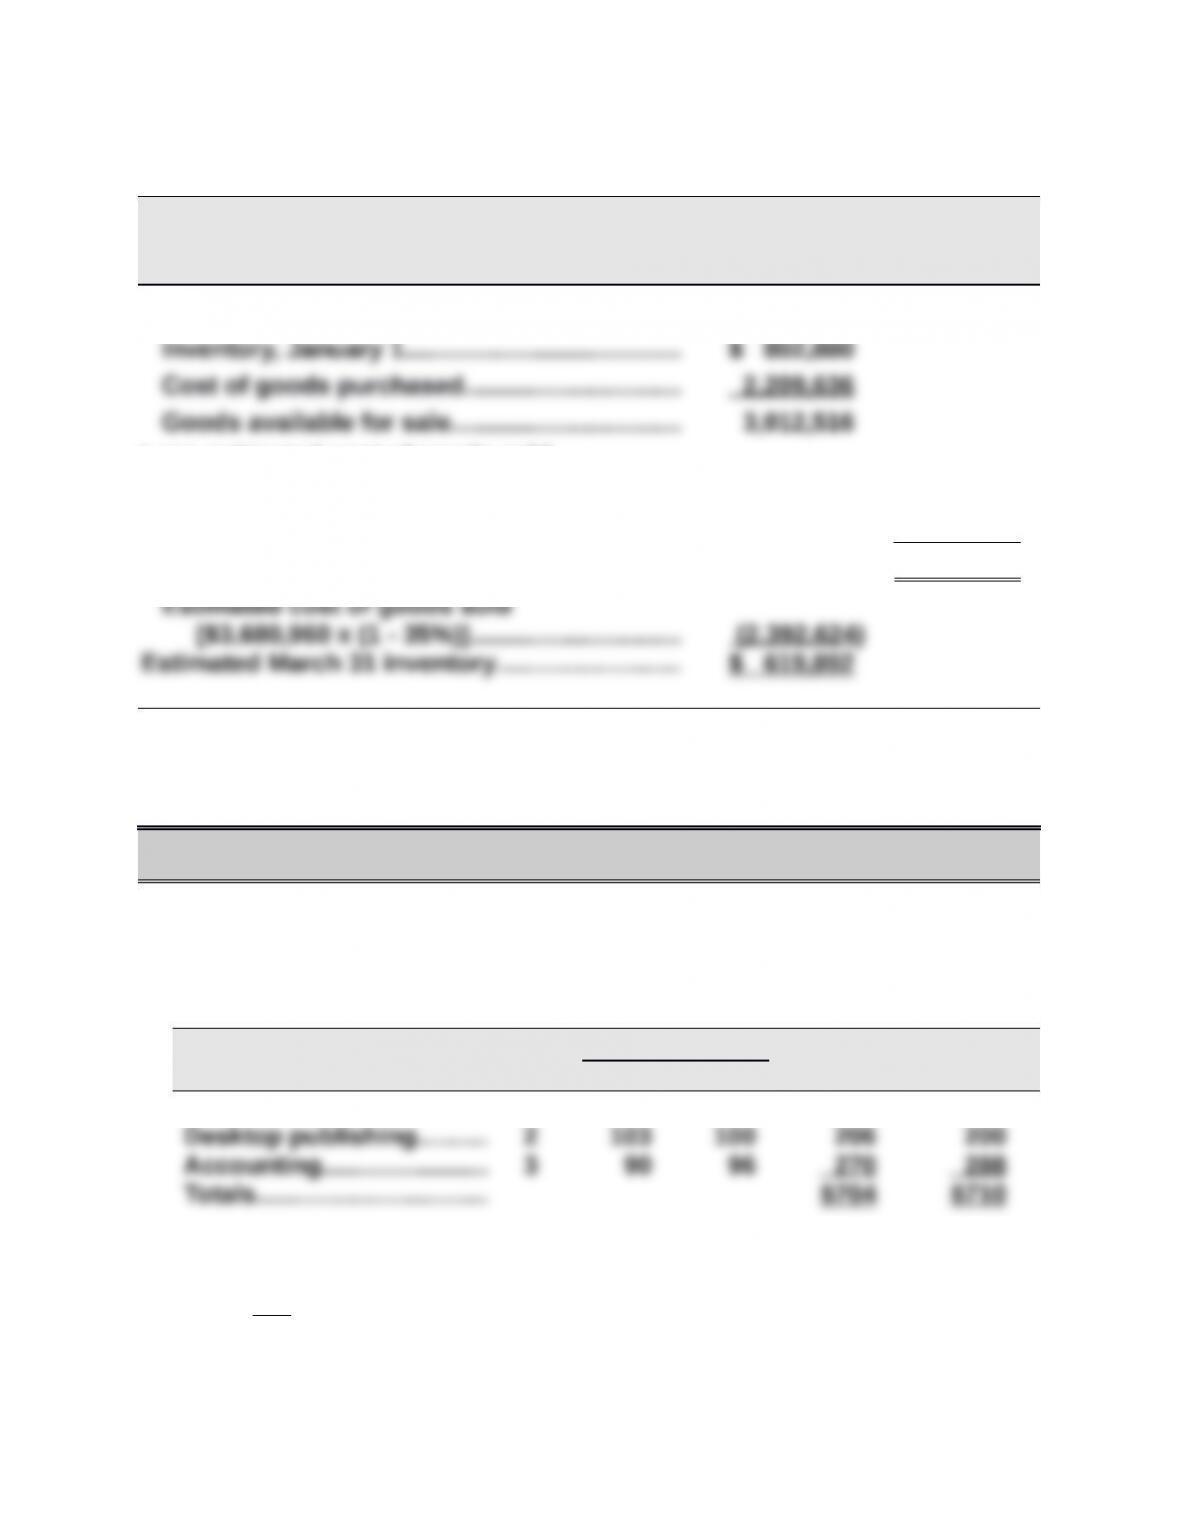
Problem 6-10BB (25 minutes)
OTINGO EQUIPMENT CO.
Estimated Inventory at March 31
At Cost At Retail
Goods available for sale
Less estimated cost of goods sold
Sales……………………………………………………….. $3,760,260
Less sales returns…………………………….……… (79,300)
Net sales………………………………………………..… $3,680,960
SERIAL PROBLEM — SP 6
Serial Problem — SP 6, Business Solutions (20 minutes)
Part A
1.
Per Unit Total Total
Inventory Items Units Cost Market Cost Market
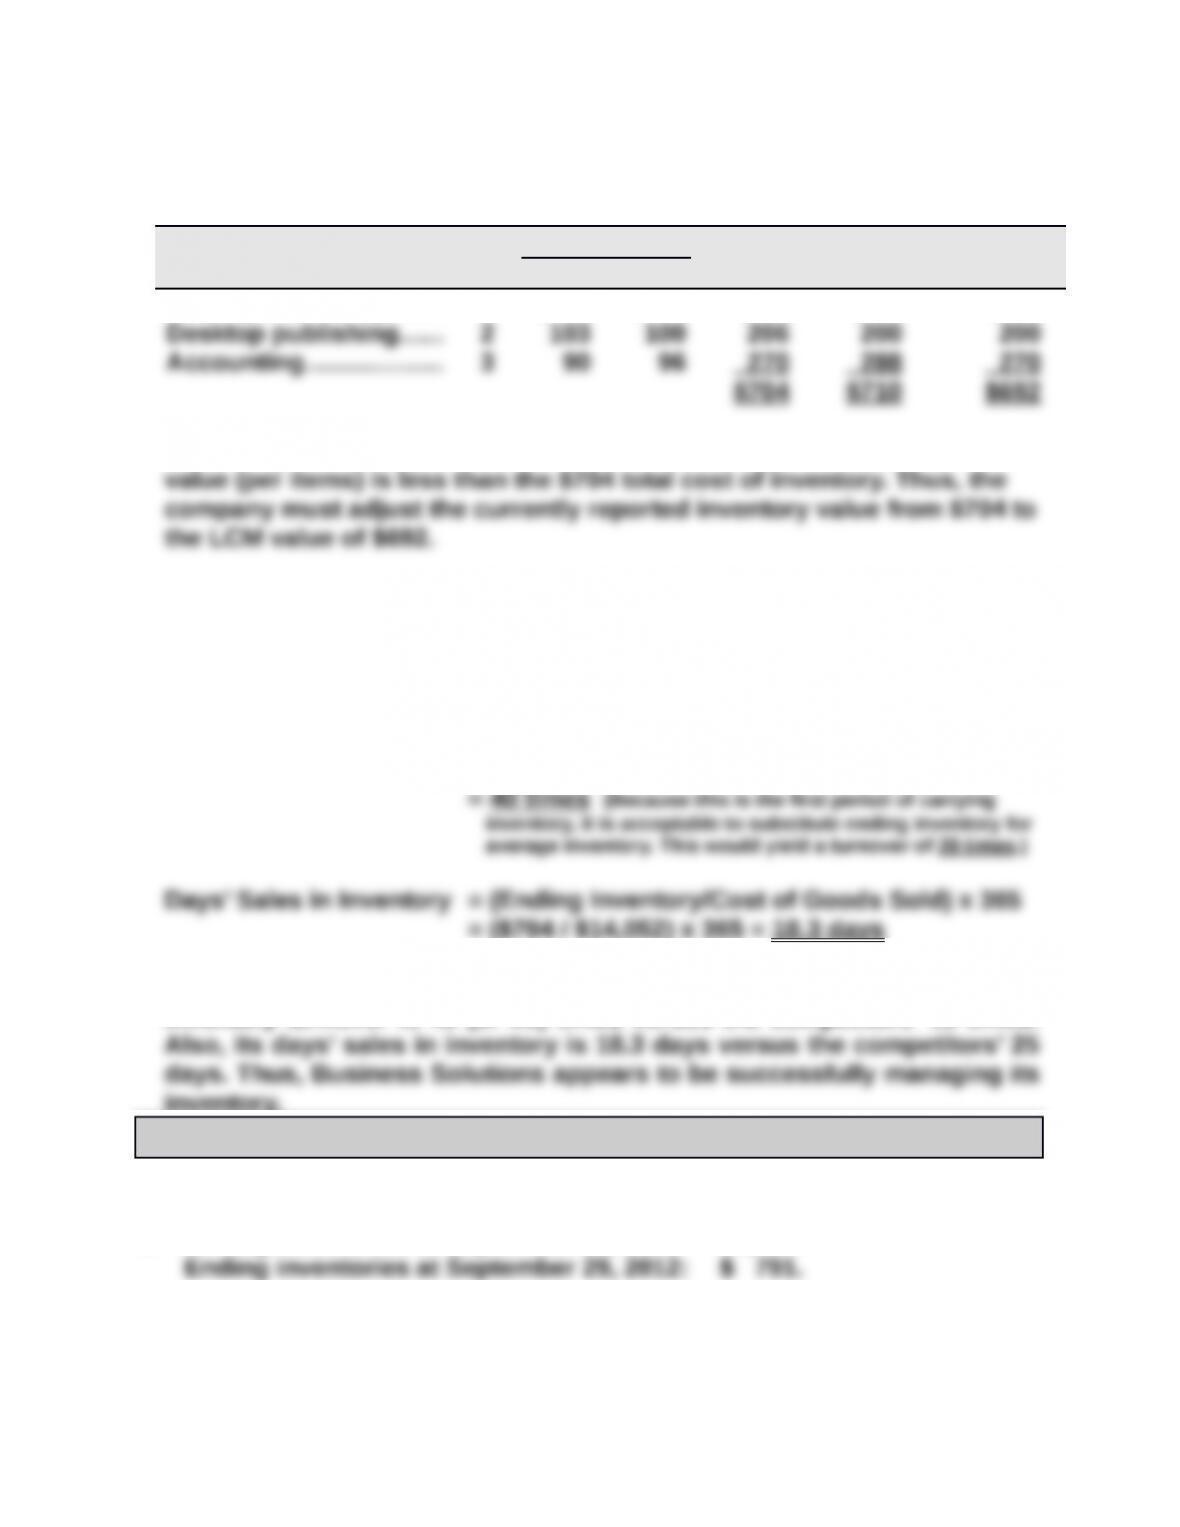
Office productivity………... 3 $ 76 $ 74 $228 $222
Assuming LCM is applied to the “whole of inventory,” the $704 total cost
of inventory is less than the $710 total market value. Thus, the company
would not adjust the currently reported inventory value of $704.
Serial Problem — SP 6, Business Solutions (concluded)
2.
Per Unit Total Total LCM Applied
Inventory Items Units Cost Market Cost Market To Items
Office productivity…….. 3 $ 76 $ 74 $228 $222 $222
Assuming LCM is applied to the “items of inventory,” the $692 market
Part B
1. Ratio computations for the three months ended March 31, 2016:
Inventory Turnover = Cost of Goods Sold / Average Inventory
= $14,052 / [($0 + $704)/2]
2. Business Solutions outperforms its competitors on both ratios. Its
inventory turnover is 40 (or 20) times versus the competitors’ 15 times.
inventory.
Reporting in Action — BTN 6-1
($ millions for all parts)
1. Ending inventories at September 28, 2013: $1,764.
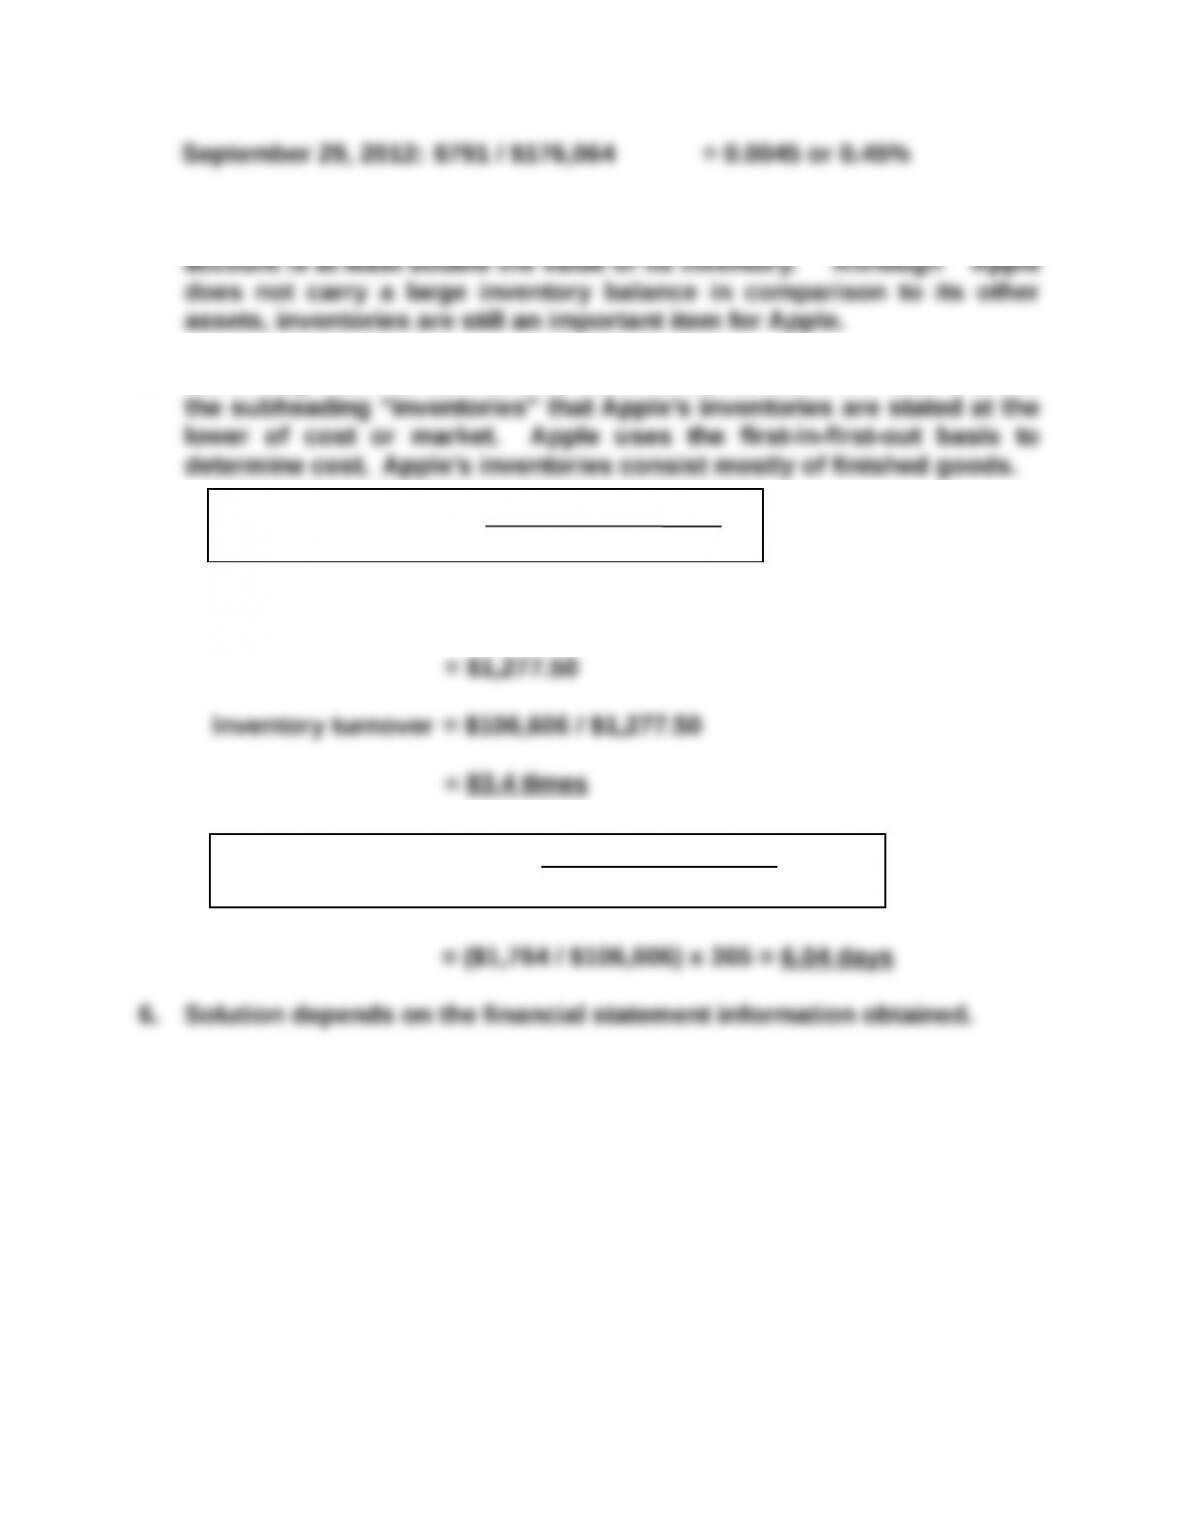
2. September 28, 2013: $1,764 / $207,000 = 0.0085 or 0.85%
3. Apple’s inventories are its second smallest asset at September 28,
2013. Goodwill has a slightly smaller balance, but every other asset
4. Reviewing notes to its financial statements, we see from Note 1 under
5. a. Inventory turnover =
Average inventory = ($1,764 + $791) / 2
b. Days’ sales in inventory = x 365
Cost of sales
Average inventory
Ending inventory
Cost of sales
Comparative Analysis — BTN 6-2
($ thousands)
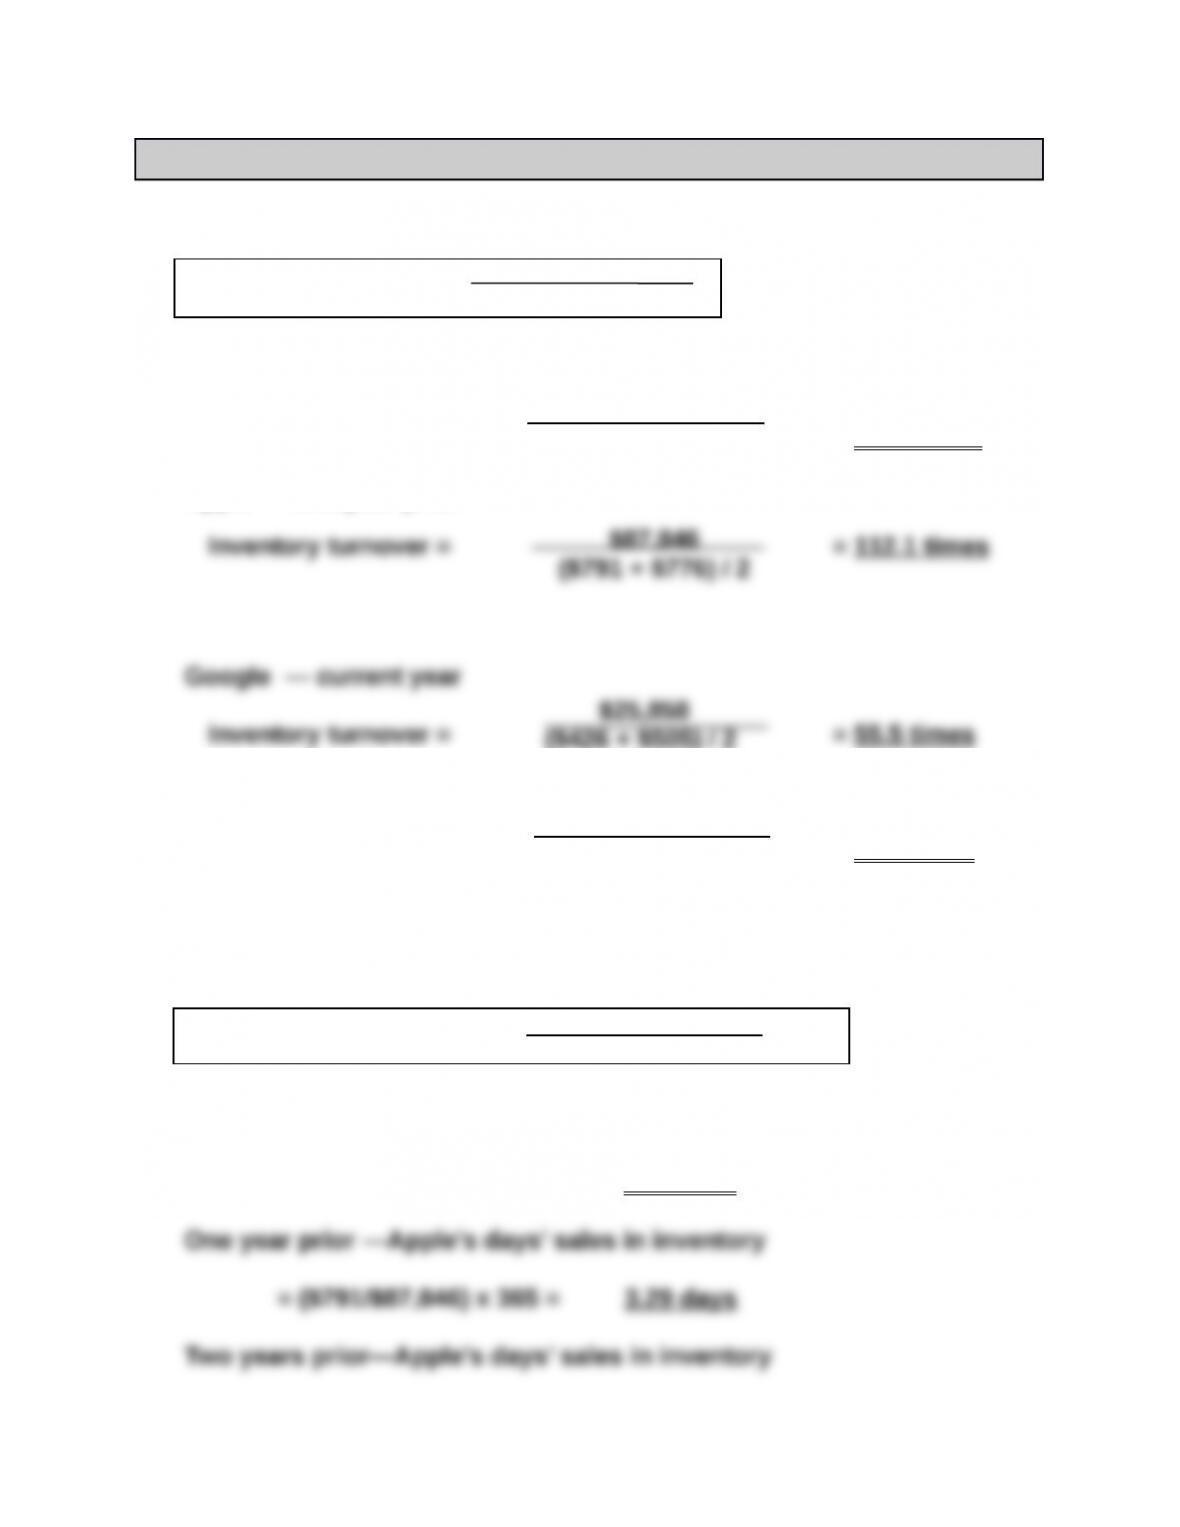
1. Inventory turnover =
Apple — current year
Inventory turnover = = 83.4 times
Apple — one year prior
Google — one year prior
Inventory turnover = = 76.4 times
Comparative Analysis (Concluded)
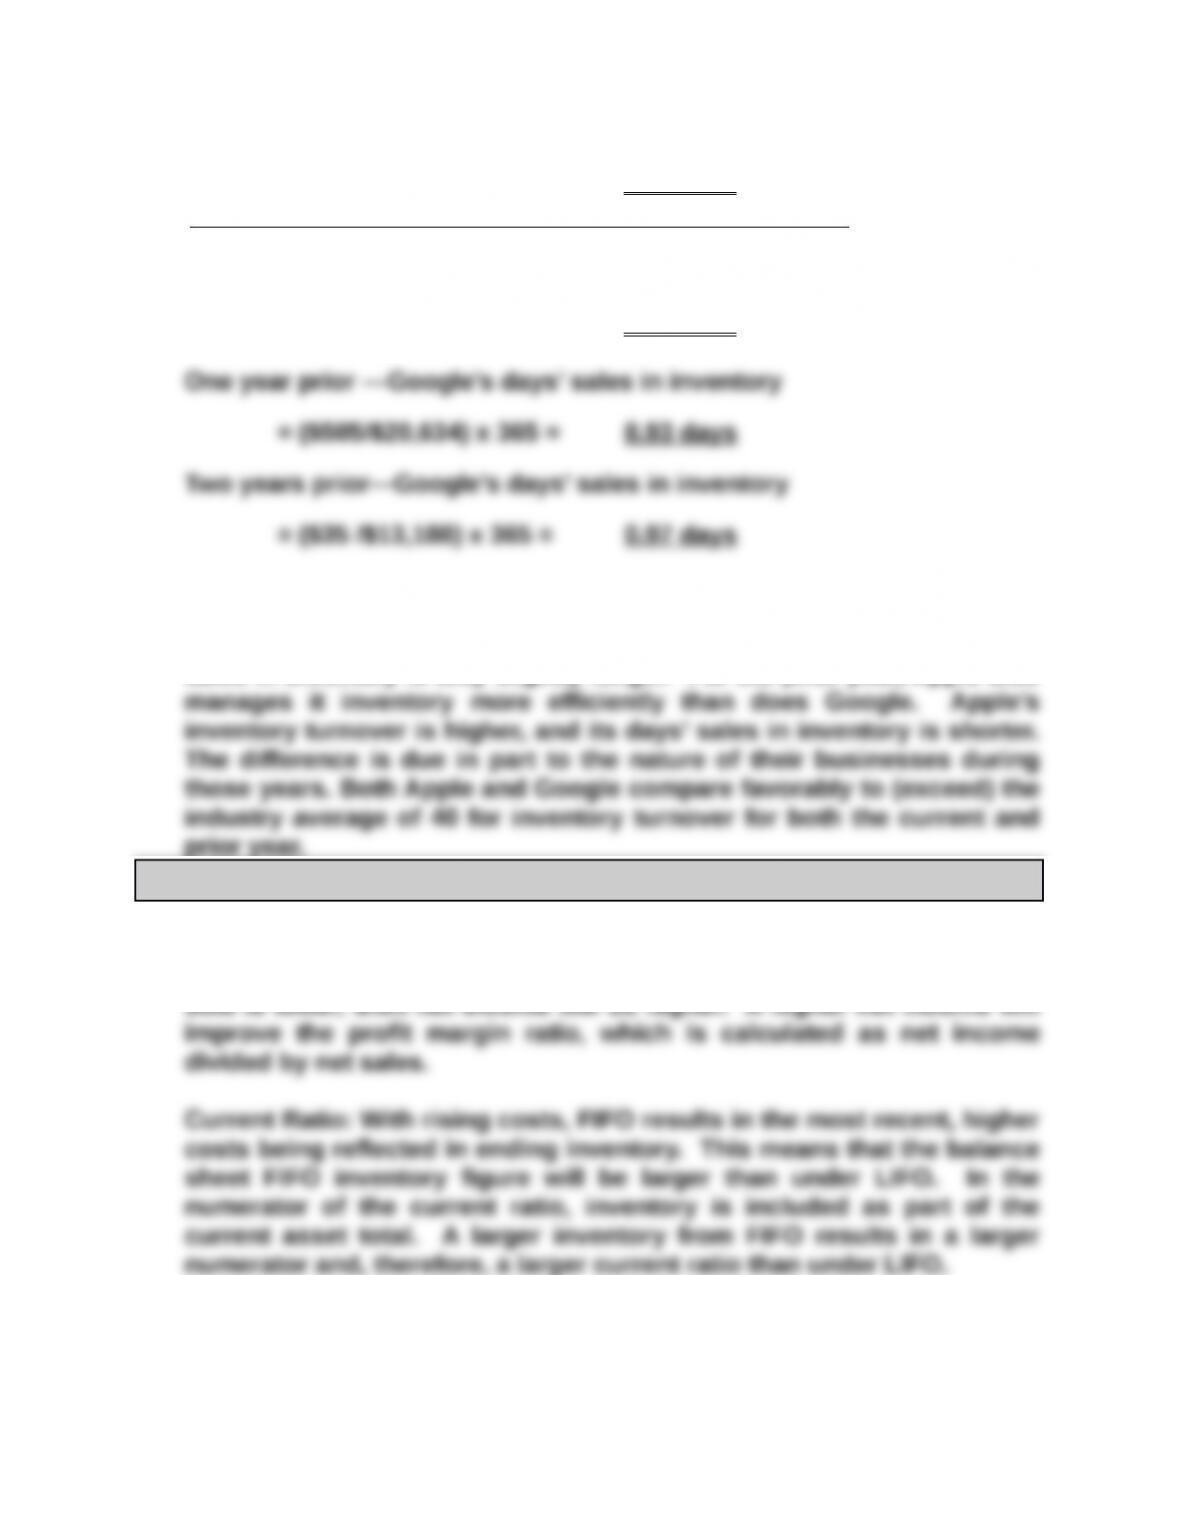
2. Days’ sales in inventory = x 365
Current year — Apple’s days’ sales in inventory
= ($1,764/$106,606) x 365 = 6.04 days
Cost of sales
Average inventory
$106,606
($1,764 + $791) / 2
$20,634
($505 + $35) / 2
Ending Inventory
Costs of Goods Sold
= ($776/$64,431) x 365 = 4.40 days
Current year — Google’s days’ sales in inventory
= ($426/$25,858) x 365 = 6.01 days
3. For the most recent year, Apple manages its inventory more efficiently
than does Google. Apple’s inventory turnover is higher, and its days’
sales in inventory is only slightly longer. For the prior year, Apple also
Ethics Challenge — BTN 6-3
1. Profit Margin: In an economic environment of rising costs, the use of
FIFO results in a lower cost of goods sold than LIFO. If cost of goods
2. First, it is true that managers have discretion in choosing an inventory
costing method. It appears, however, that Golf Challenge’s owner does
Third, the full disclosure principle requires the owner to disclose to the
bank that the company has implemented a change in inventory costing
method from LIFO to FIFO.
Communicating in Practice — BTN 6-4
[Note: An acceptable memorandum format should be used.]
The body of the memo would likely recommend use of the LIFO method for
this start-up business. The memo should explain that this would allow for
the matching of the most recent (higher) costs against revenue through
Taking It to the Net — BTN 6-5
1. Apple designs, manufactures, and markets mobile communication and
2. Its summary of significant accounting policies (Note 1) reports:
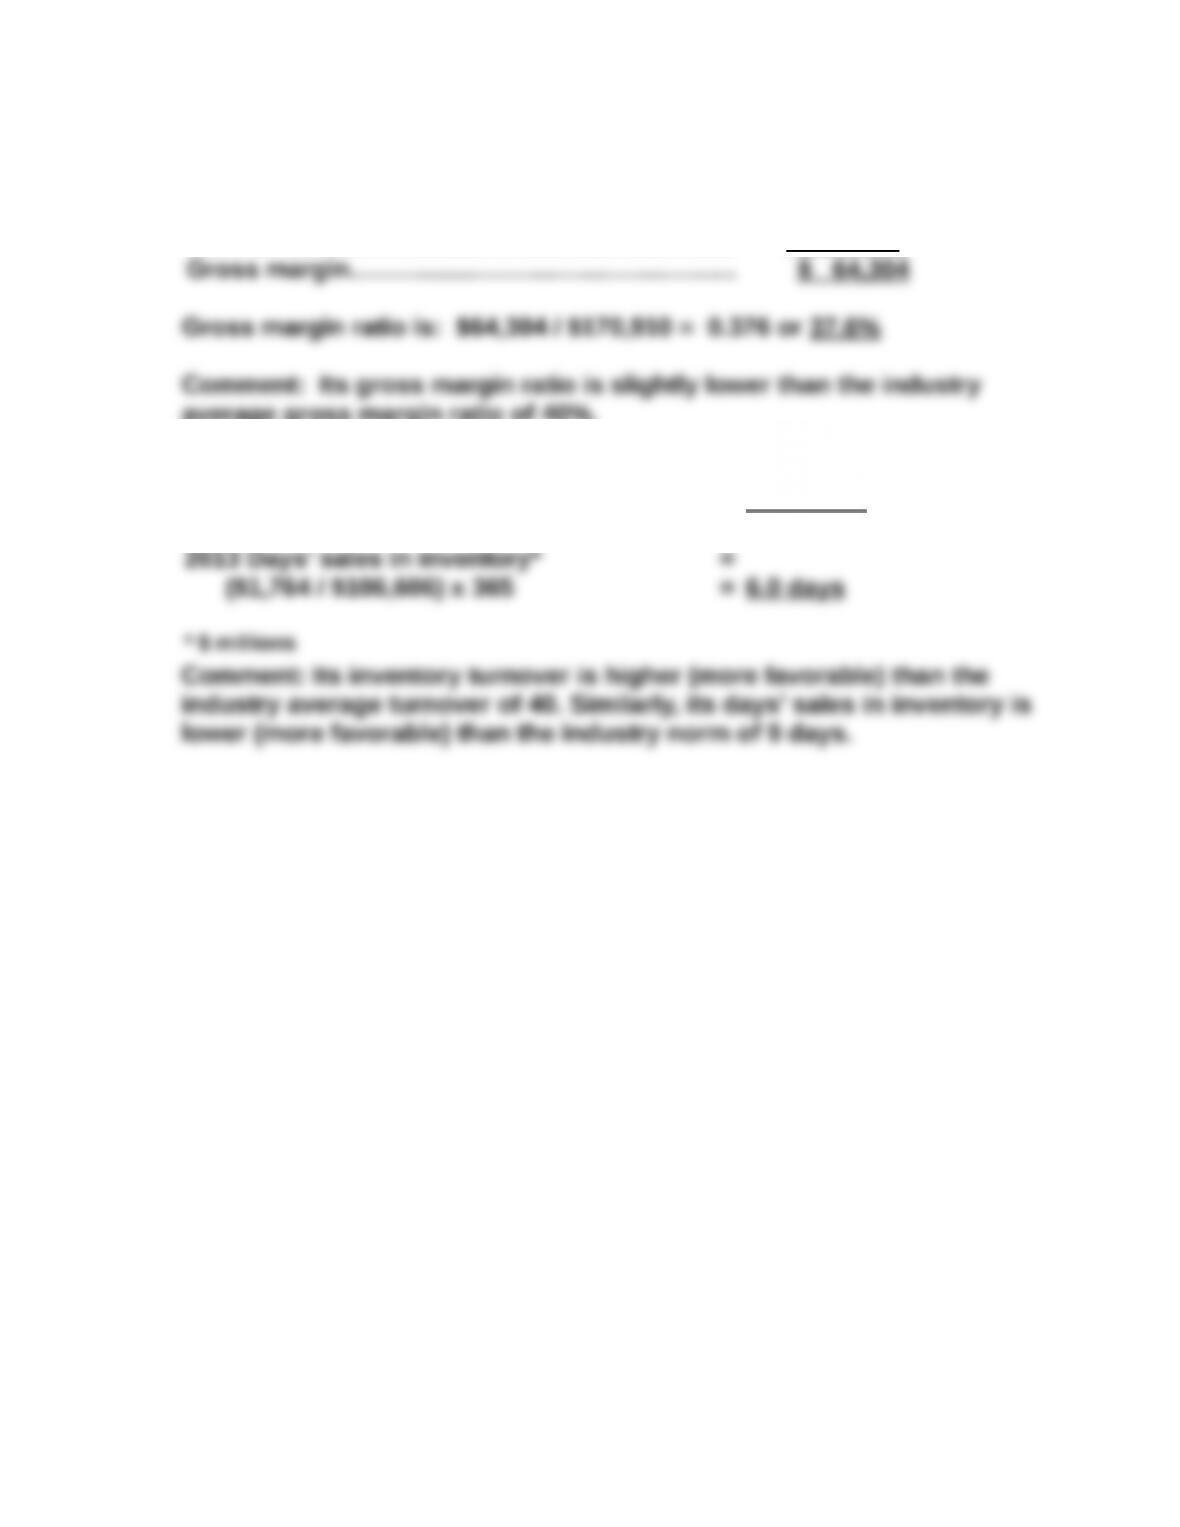
3. Its gross margin for fiscal 2013 is ($ millions)
Sales………………………………….……………….………. $ 170,910
Cost of sales……………………….……………….……… (106,606)
average gross margin ratio of 40%.
4. 2013 Inventory turnover* =
$106,606/ [($1,764 + $791)/2] = 83.4 times