Problem 6-3B (40 minutes)
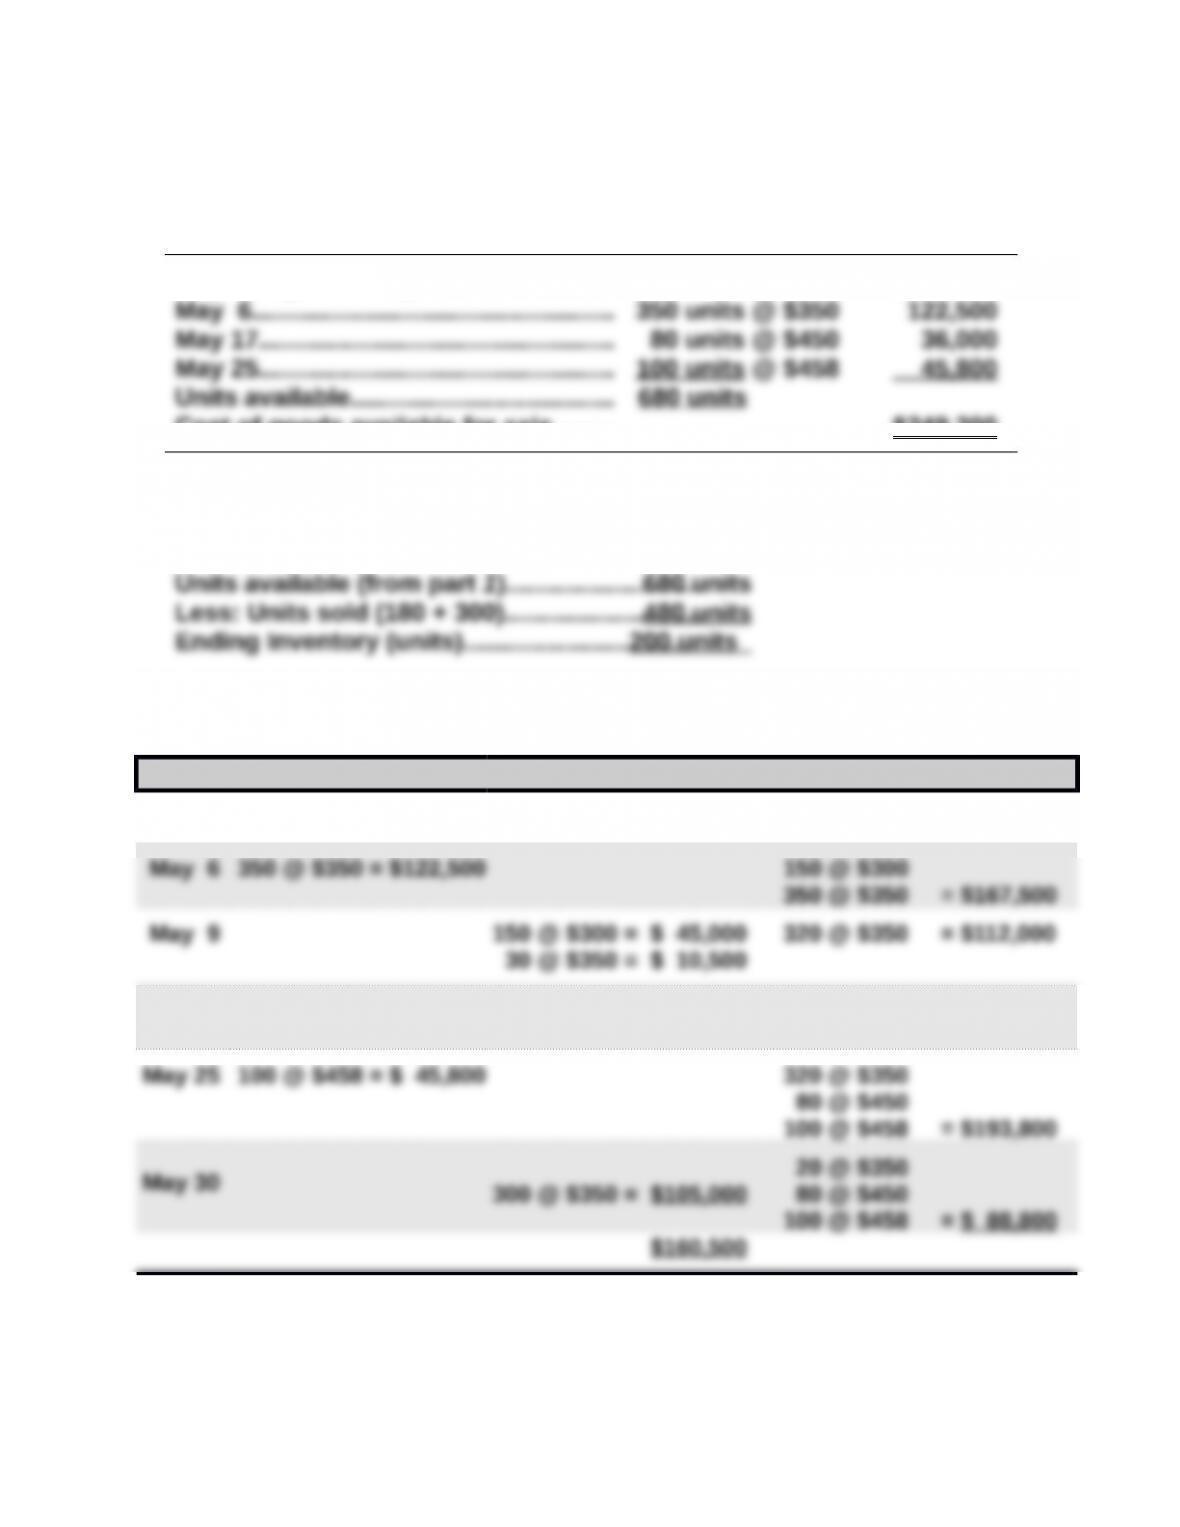
1. Compute cost of goods available for sale and units available for sale
Beginning inventory……………………… 150 units @ $300 $ 45,000
Cost of goods available for sale…….. $249,300
2. Units in ending inventory
3a. FIFO perpetual
Date Goods Purchased Cost of Goods Sold Inventory Balance
May 1 150 @ $300 = $ 45,000
May 17 80 @ $450 = $ 36,000 320 @ $350
80 @ $450 = $148,000
Problem 6-3B (Continued)
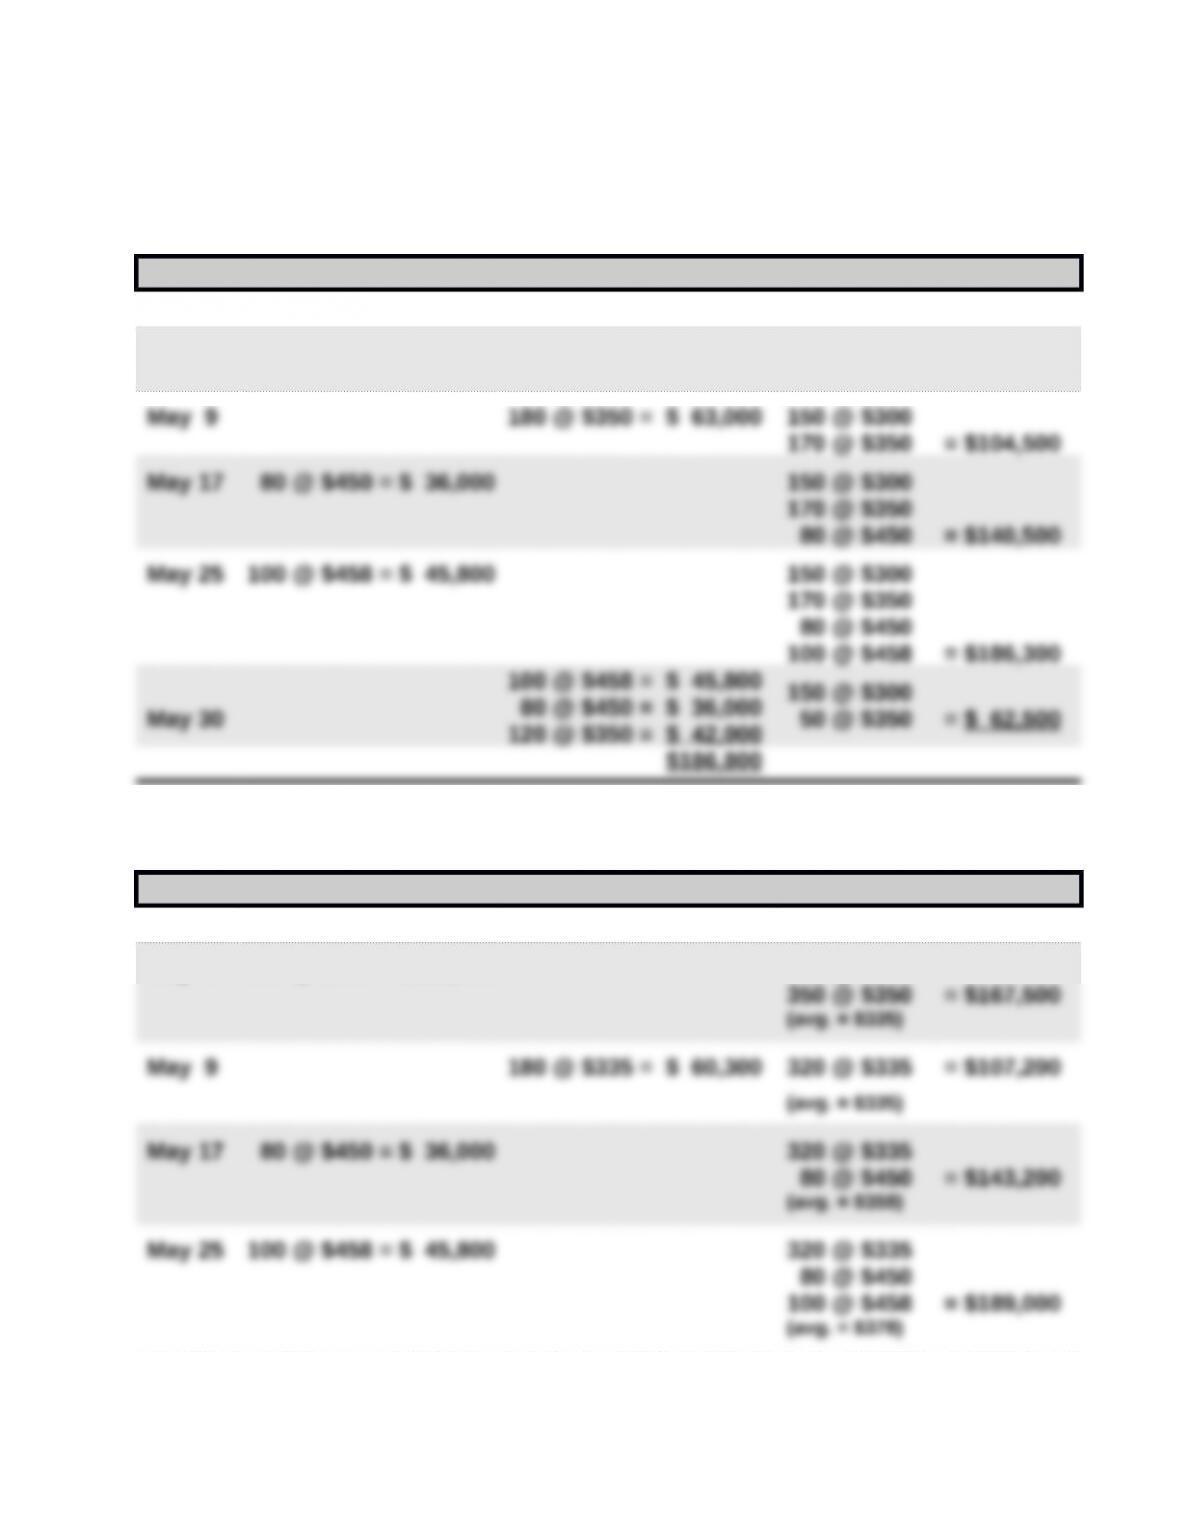
3b. LIFO perpetual
Date Goods Purchased Cost of Goods Sold Inventory Balance
May 1 150 @ $300 = $ 45,000
May 6 350 @ $350 = $122,500 150 @ $300
350 @ $350 = $167,500
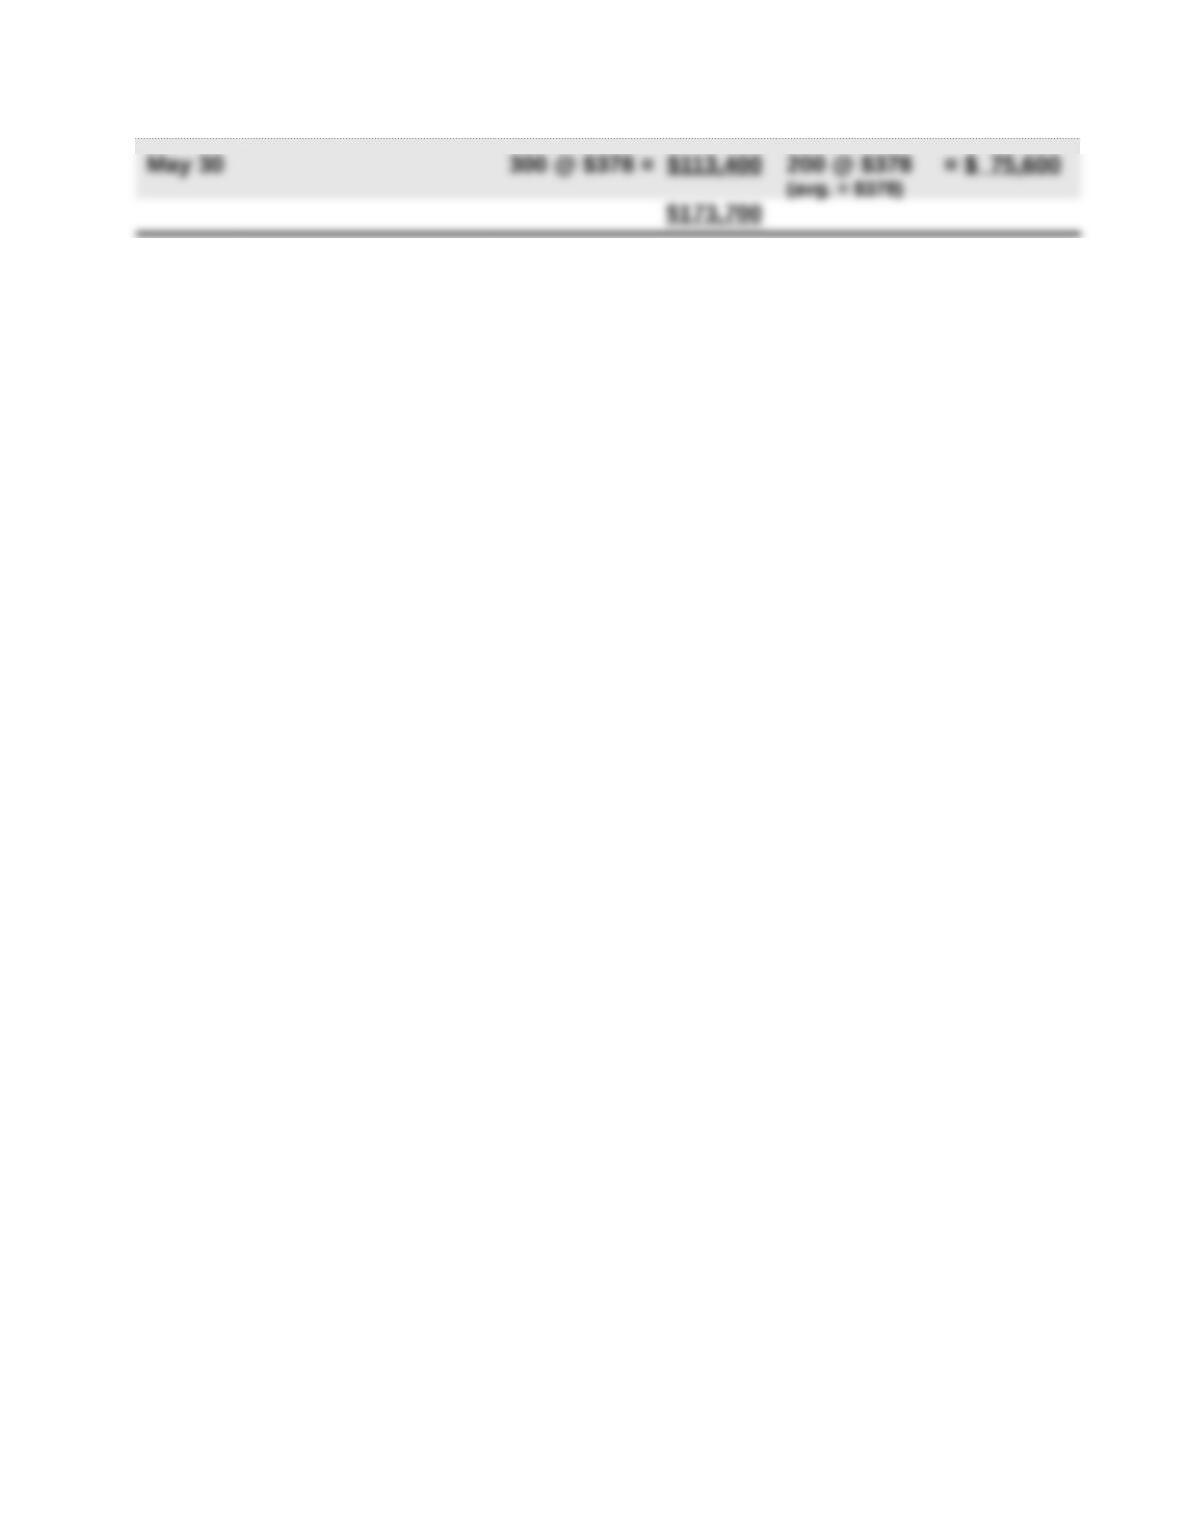
3c. Weighted Average perpetual
Date Goods Purchased Cost of Goods Sold Inventory Balance
May 1 150 @ $300 = $ 45,000
May 6 350 @ $350 = $122,500 150 @ $300
Problem 6-3B (Continued)
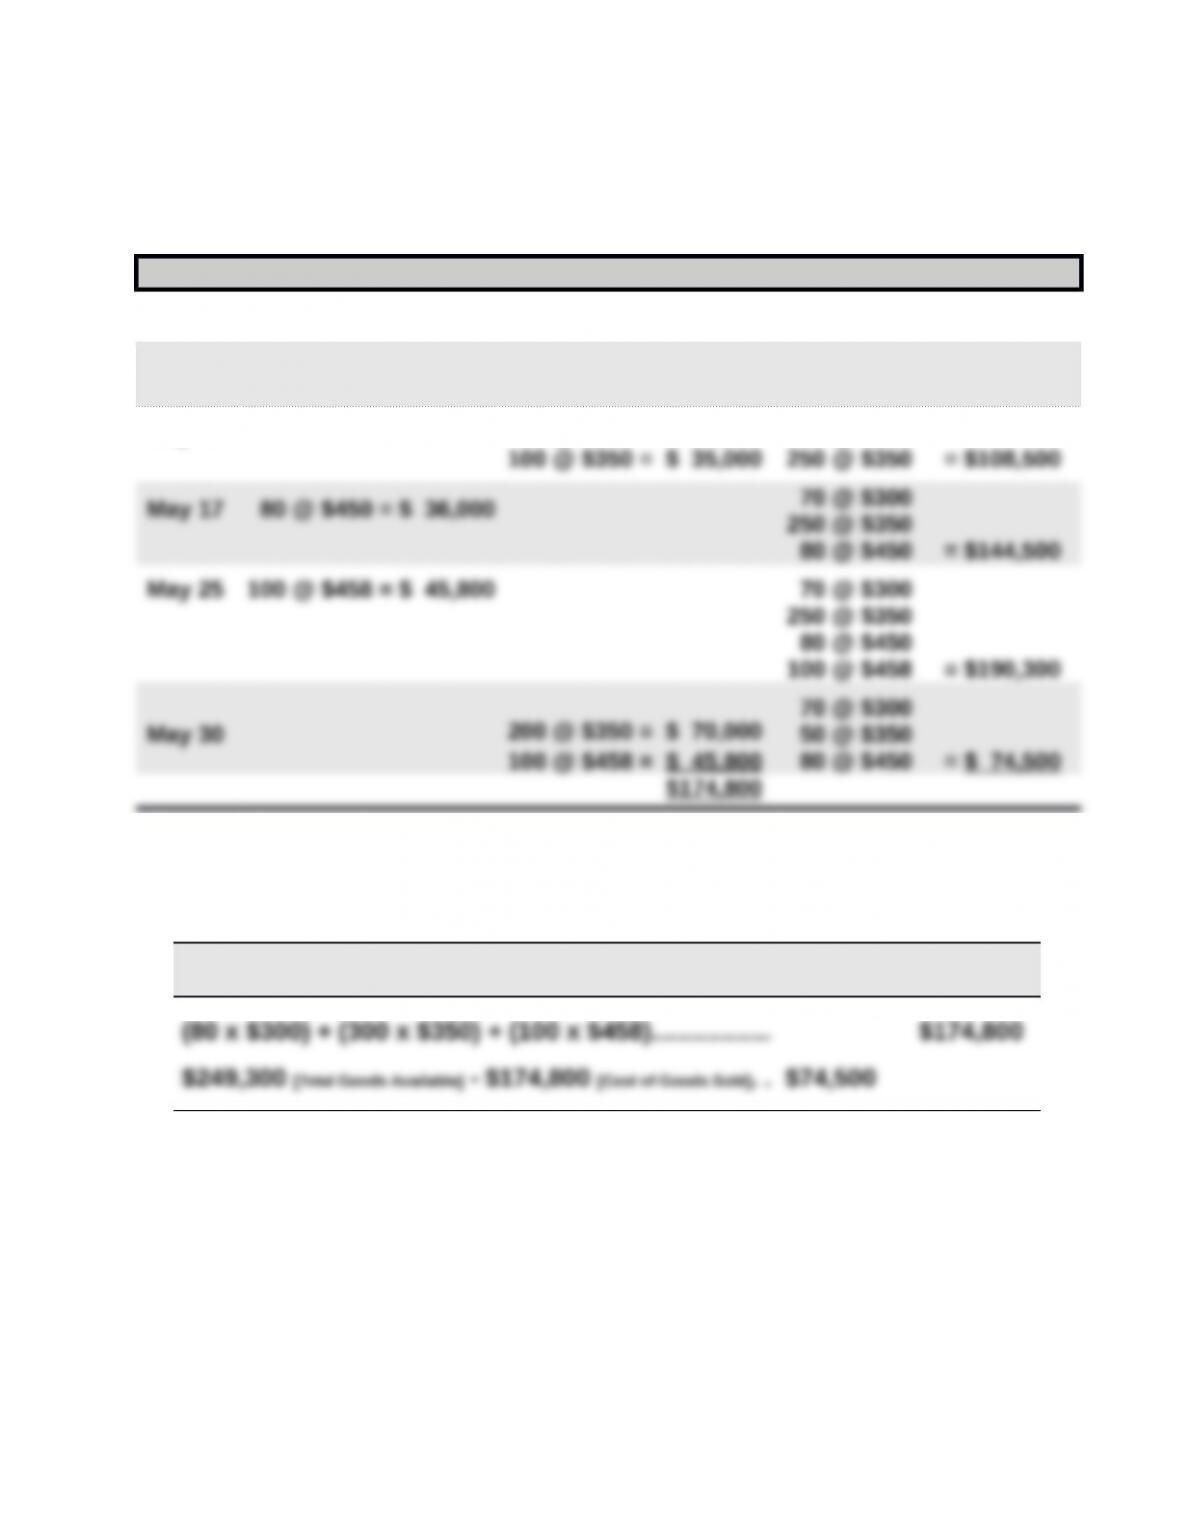
3d. Specific Identification
Date Goods Purchased Cost of Goods Sold Inventory Balance
May 1 150 @ $300 = $ 45,000
May 6 350 @ $350 = $122,500 150 @ $300
350 @ $350 = $167,500
May 9 80 @ $300 = $ 24,000
70 @ $300
Specific identification—Alternative Computation
Cost of goods sold—80 units from beginning inventory, 300 [100+200] units from May
6 purchase, and 100 units from May 25 purchase
Ending Cost of
Specific Identification Inventory Goods Sold
Problem 6-3B (Continued)
4.
FIFO LIFO
Weighted
Average
Specific
Identifi-cat
ion
5. The manager of Aloha Company likely will prefer the FIFO method
because it would yield the largest gross profit (in this period of rising
costs). This would give the manager the highest bonus based on gross
profit.
Problem 6-4B (40 minutes)
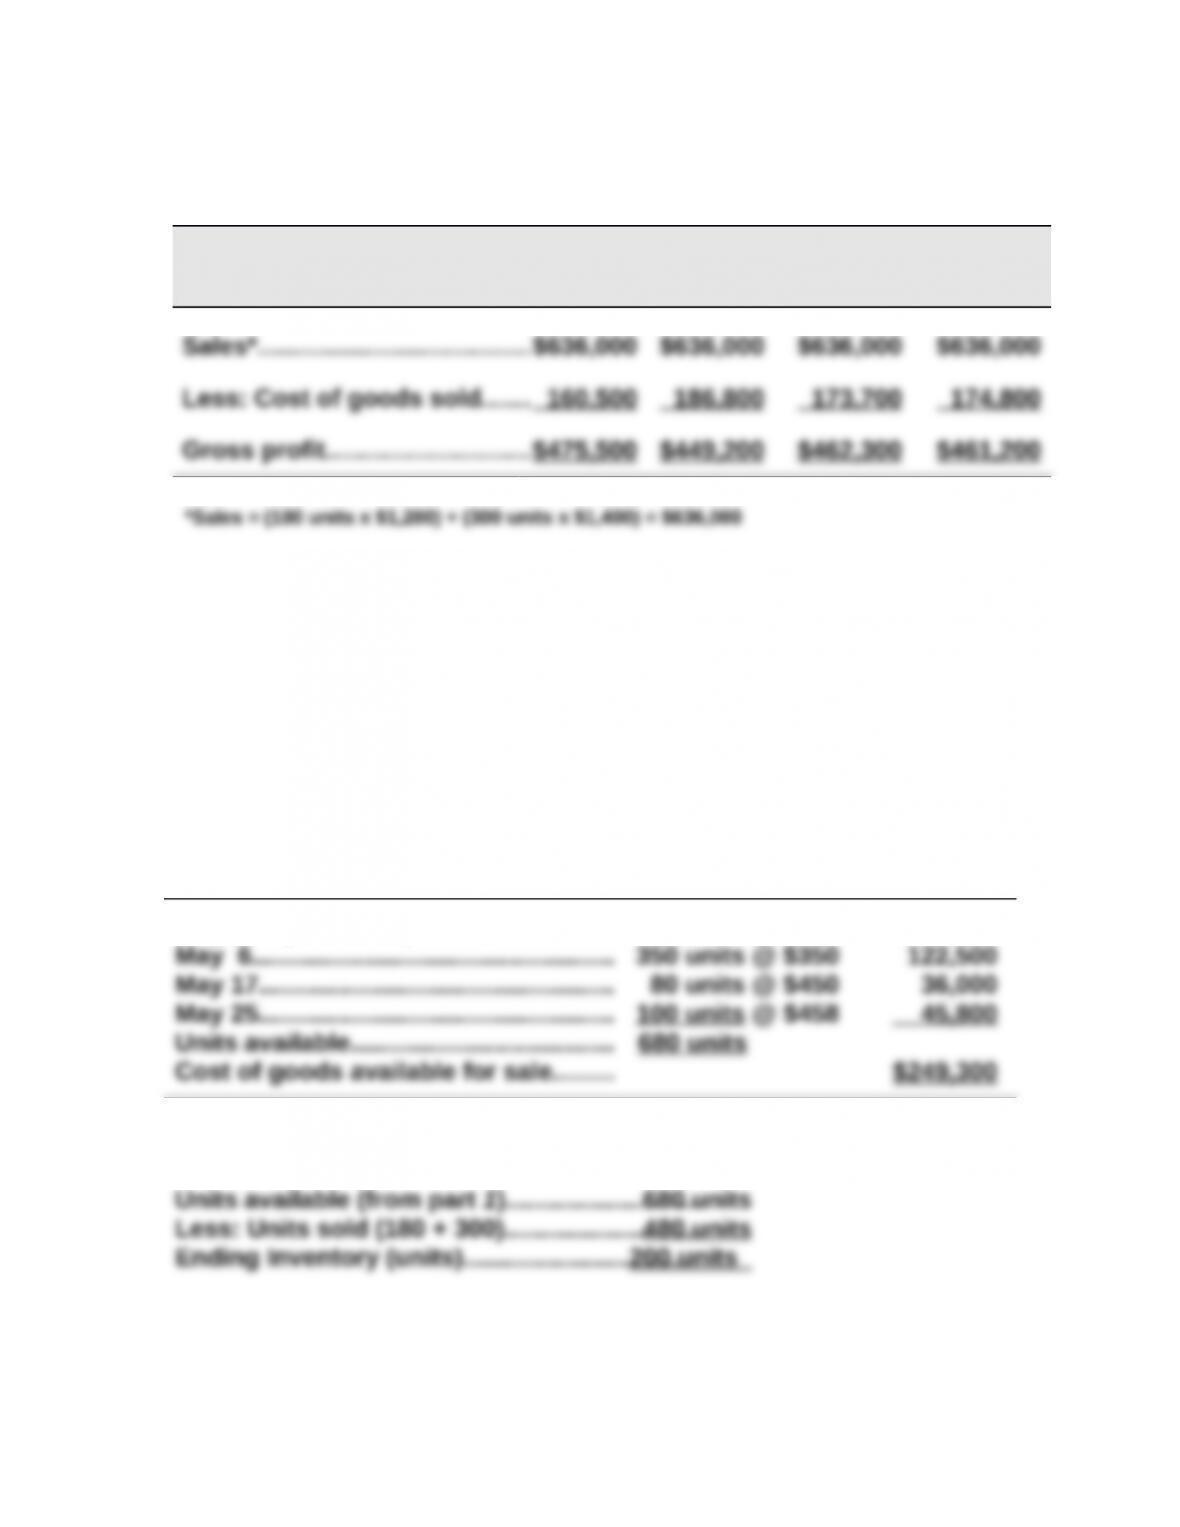
1. Compute cost of goods available for sale and units available for sale
Beginning inventory……………………… 150 units @ $300 $ 45,000
2. Units in ending inventory
Problem 6-4B (Concluded)
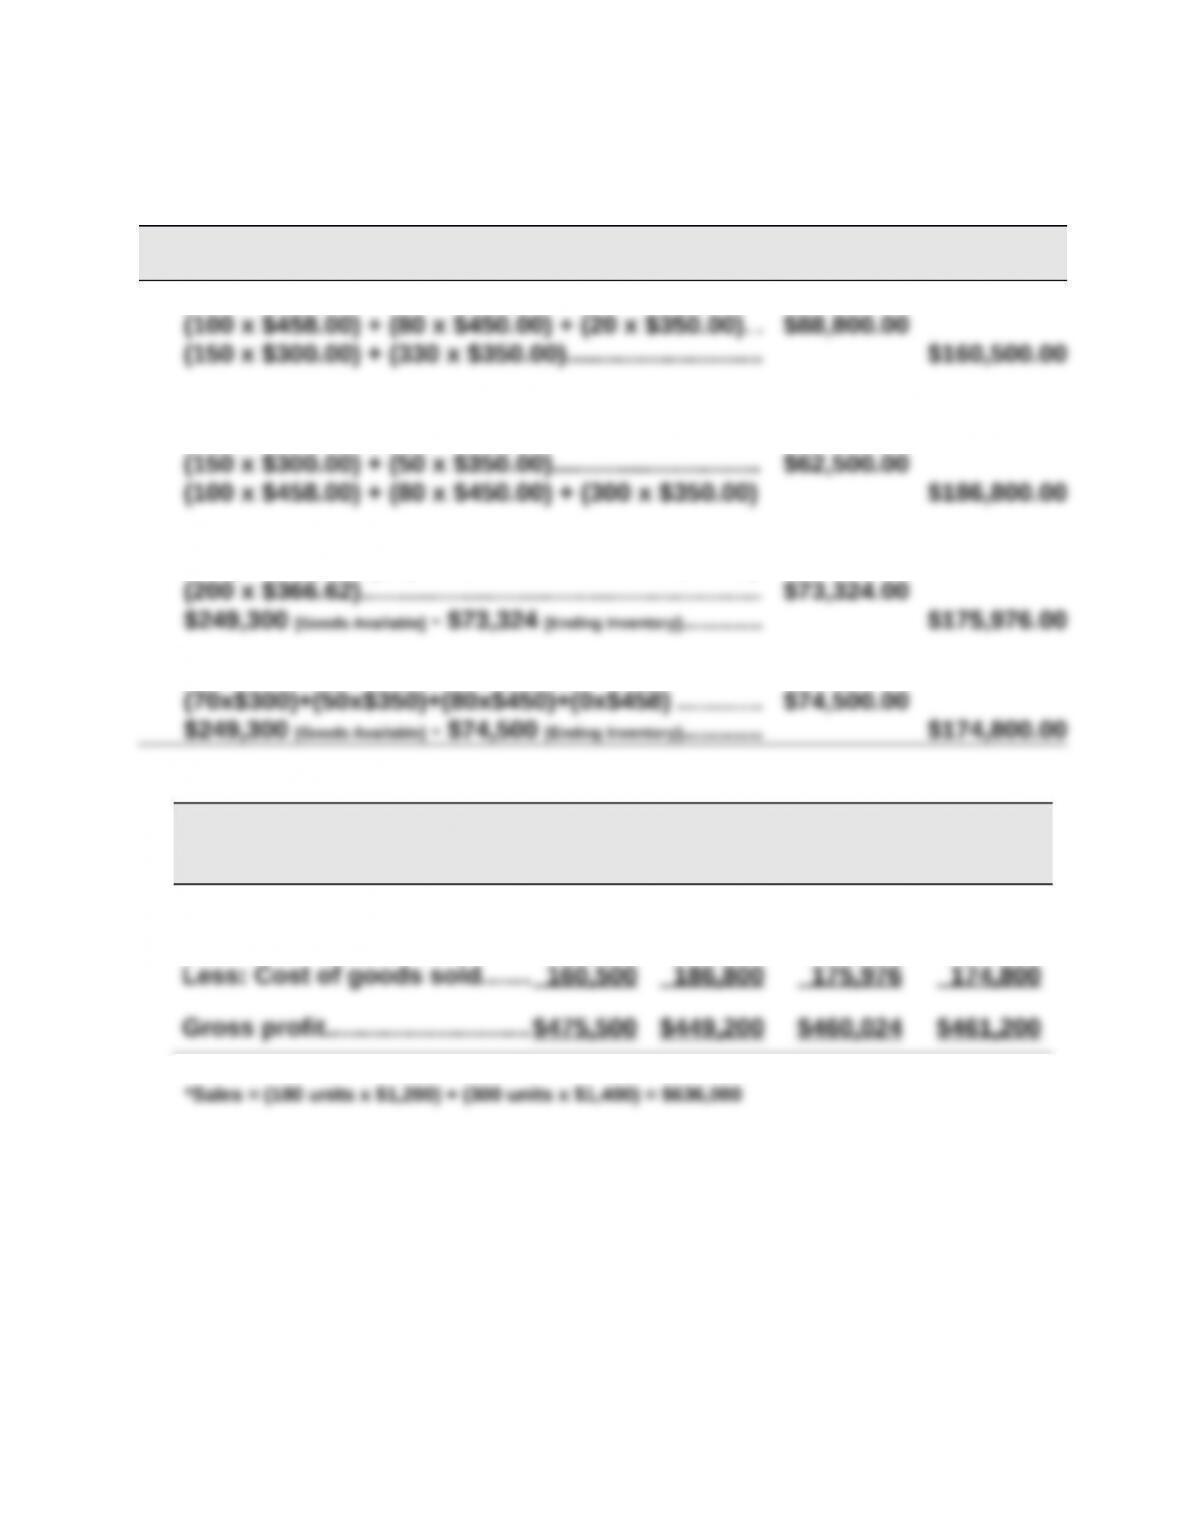
3.
Periodic Inventory
Ending
Inventory
Cost of
Goods Sold
a. FIFO
b. LIFO
c. Weighted average ($249,300/680=$366.62 [rounded])
d. Specific identification
4.
FIFO LIFO
Weighted
Average
Specific
Identifi-cat
ion
Sales*……………………………….. $636,000 $636,000 $636,000 $636,000
5. The manager likely will prefer the FIFO method because it would yield
the largest gross profit (in this period of rising costs). This would give
the manager the highest bonus based on gross profit.
Problem 6-5B (50 minutes)
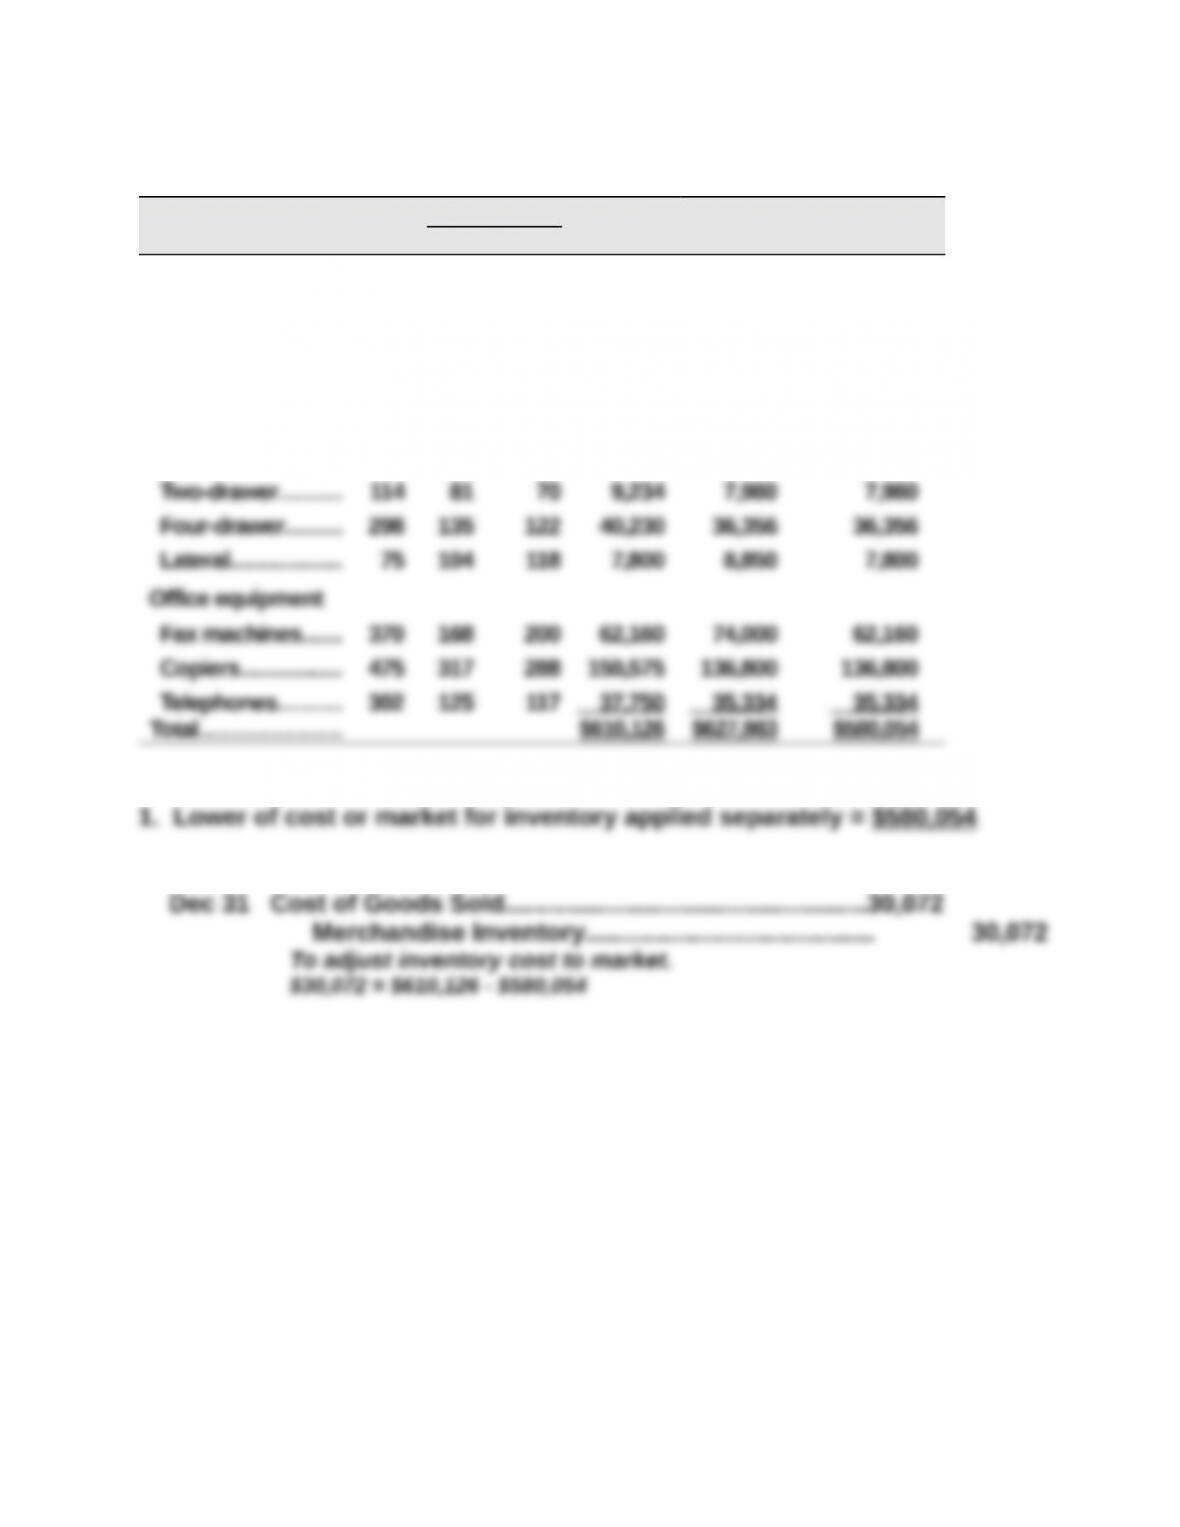
Per Unit Total Total LCM Applied
Inventory Items Units Cost Market Cost Market to Items
Office furniture
Desks……………… 536 $261 $305 $139,896 $163,480 $139,896
Credenzas……….. 395 227 256 89,665 101,120 89,665
Chairs…………….. 687 49 43 33,663 29,541 29,541
Bookshelves……. 421 93 82 39,153 34,522 34,522
Filing cabinets
2.
Problem 6-6B (35 minutes)
Part 1
(a)
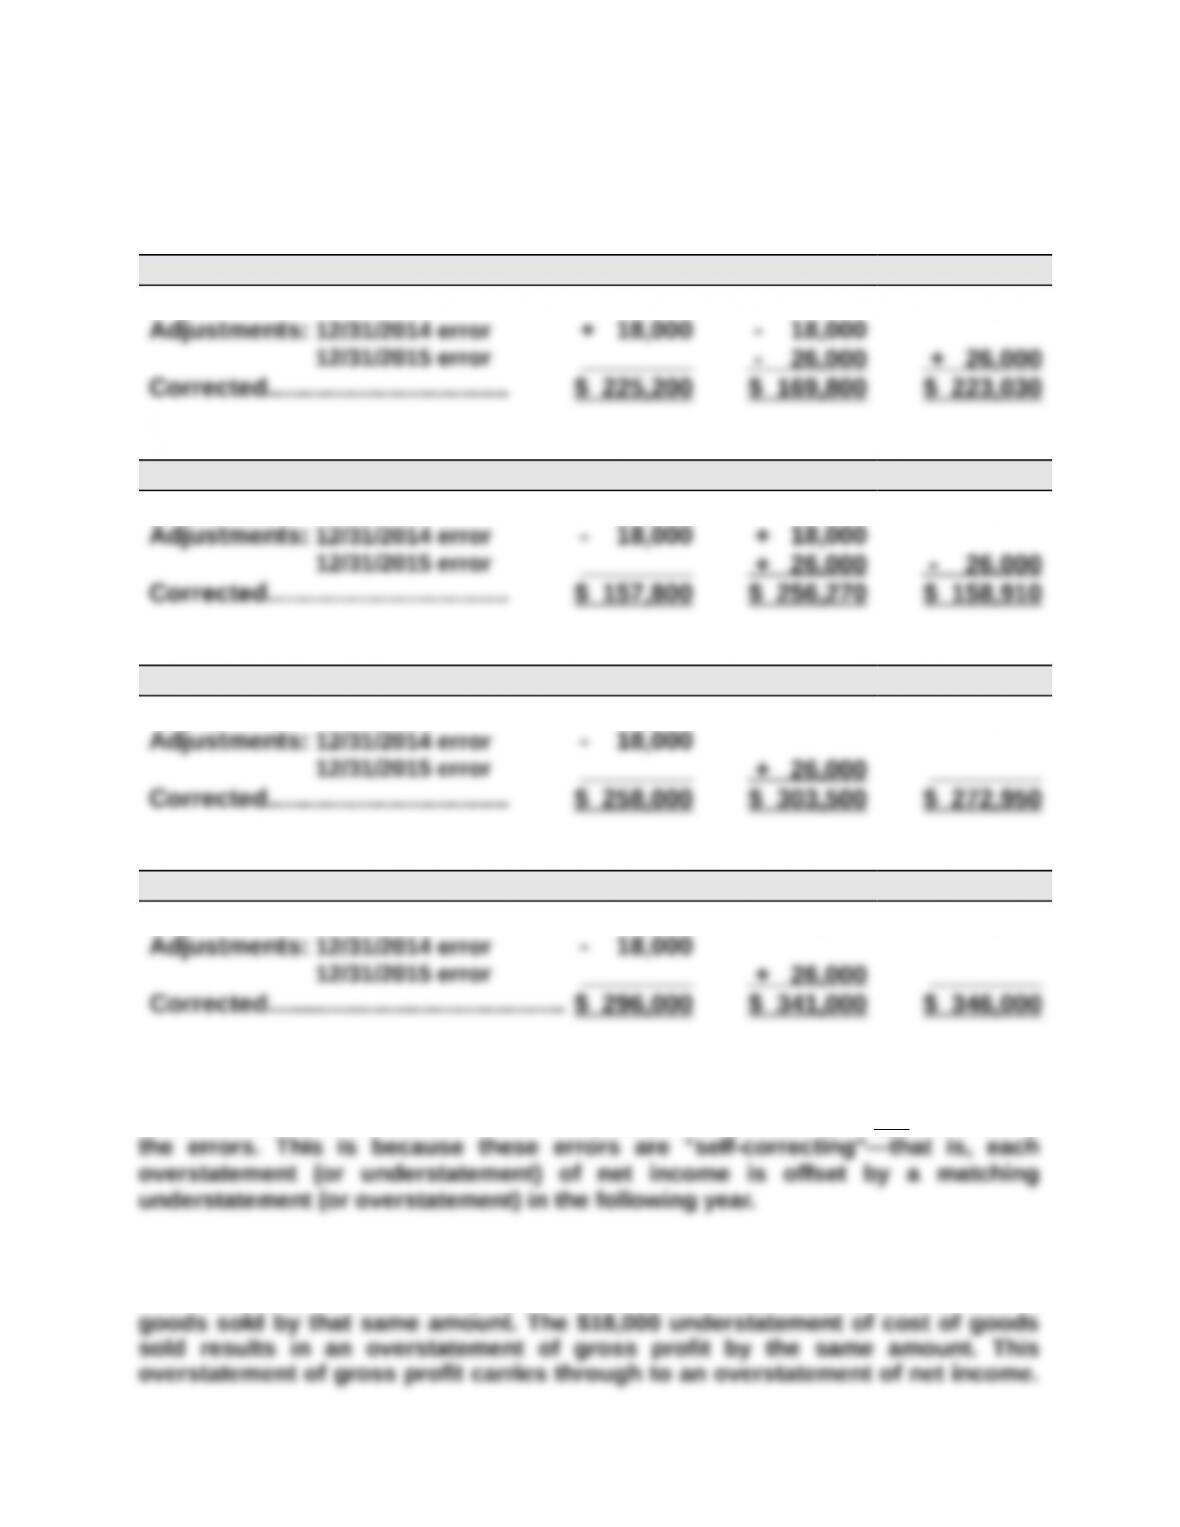
Cost of goods sold 2014 2015 2016
Reported…………………………….. $ 207,200 $ 213,800 $ 197,030
(b)
Net income 2014 2015 2016
Reported…………………………….. $ 175,800 $ 212,270 $ 184,910
(c)
Total current assets 2014 2015 2016
Reported…………………………….. $ 276,000 $ 277,500 $ 272,950
(d)
Equity 2014 2015 2016
Reported…………………………………… $ 314,000 $ 315,000 $ 346,000
Part 2
Total net income for the combined three-year period ($572,980) is not affected by
Part 3
The overstatement of inventory by $18,000 results in an understatement of cost of
Problem 6-7BA (25 minutes)
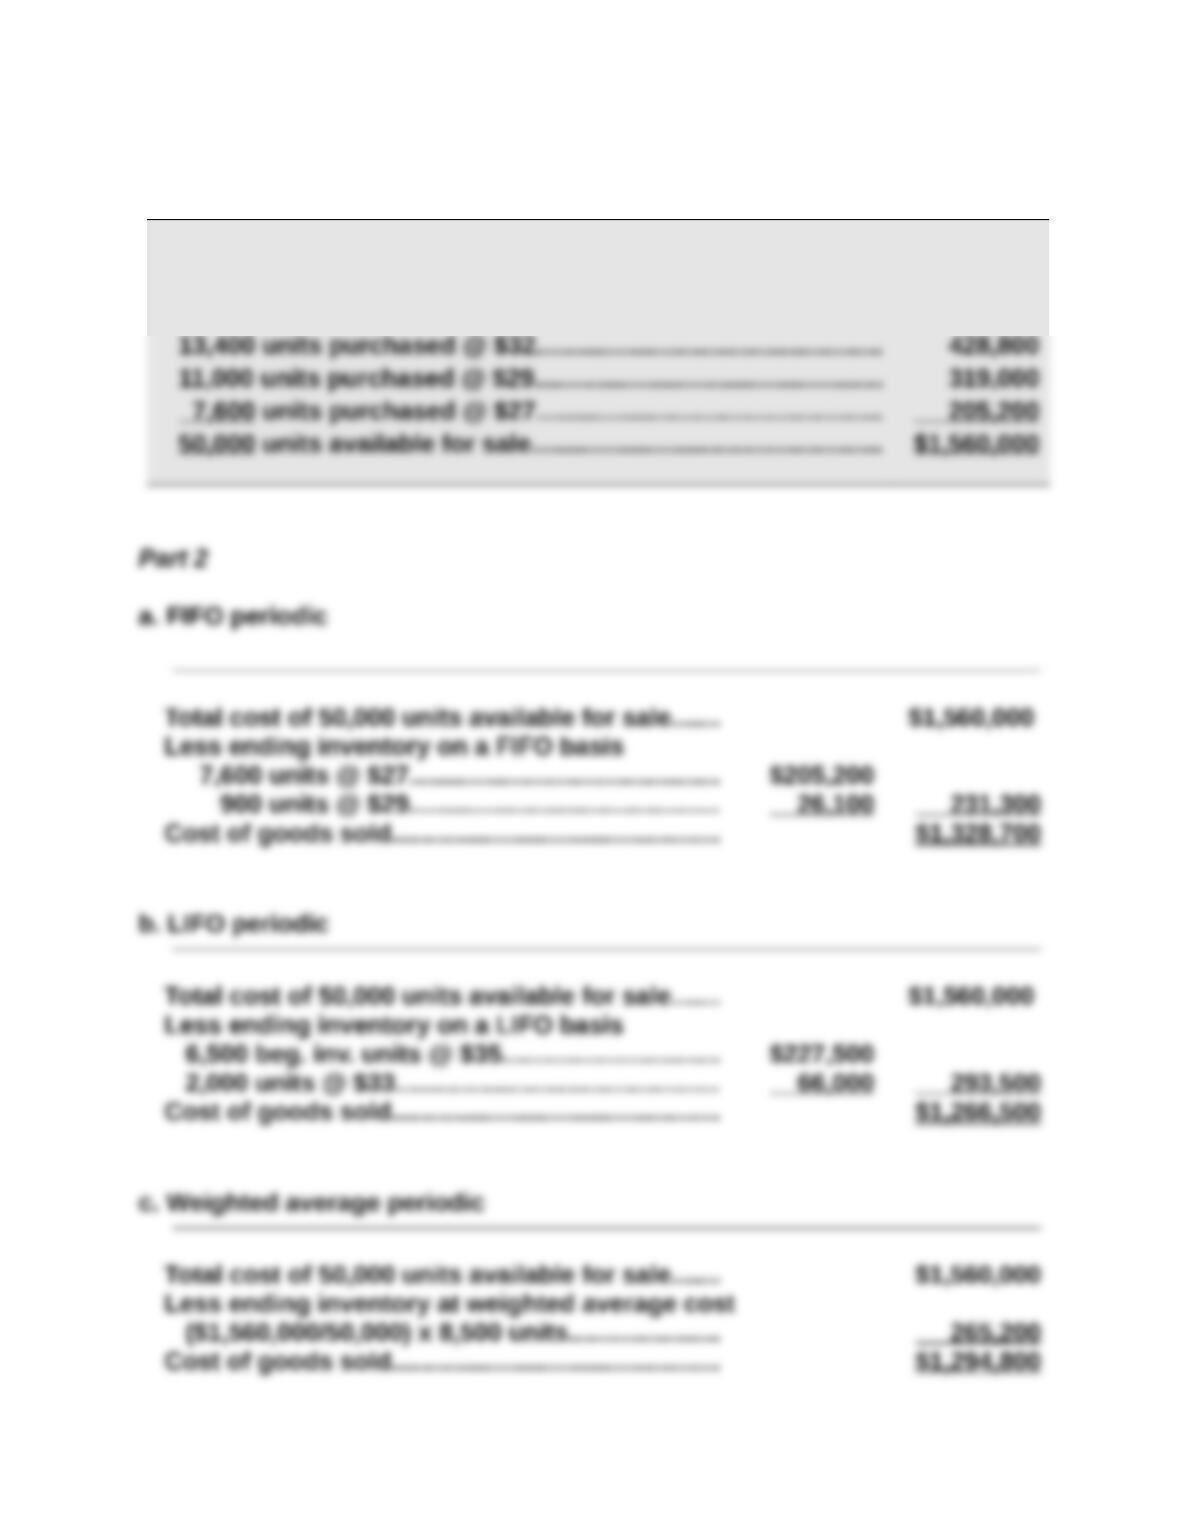
Part 1
Number and total cost of units available for sale
6,500 units in beginning inventory @ $35………………………. $ 227,500
11,500 units purchased @ $33…………………………………………. 379,500