Chapter 25 – Capital Budgeting and Managerial Decisions
Problem 25-2B (Continued)
Part 4
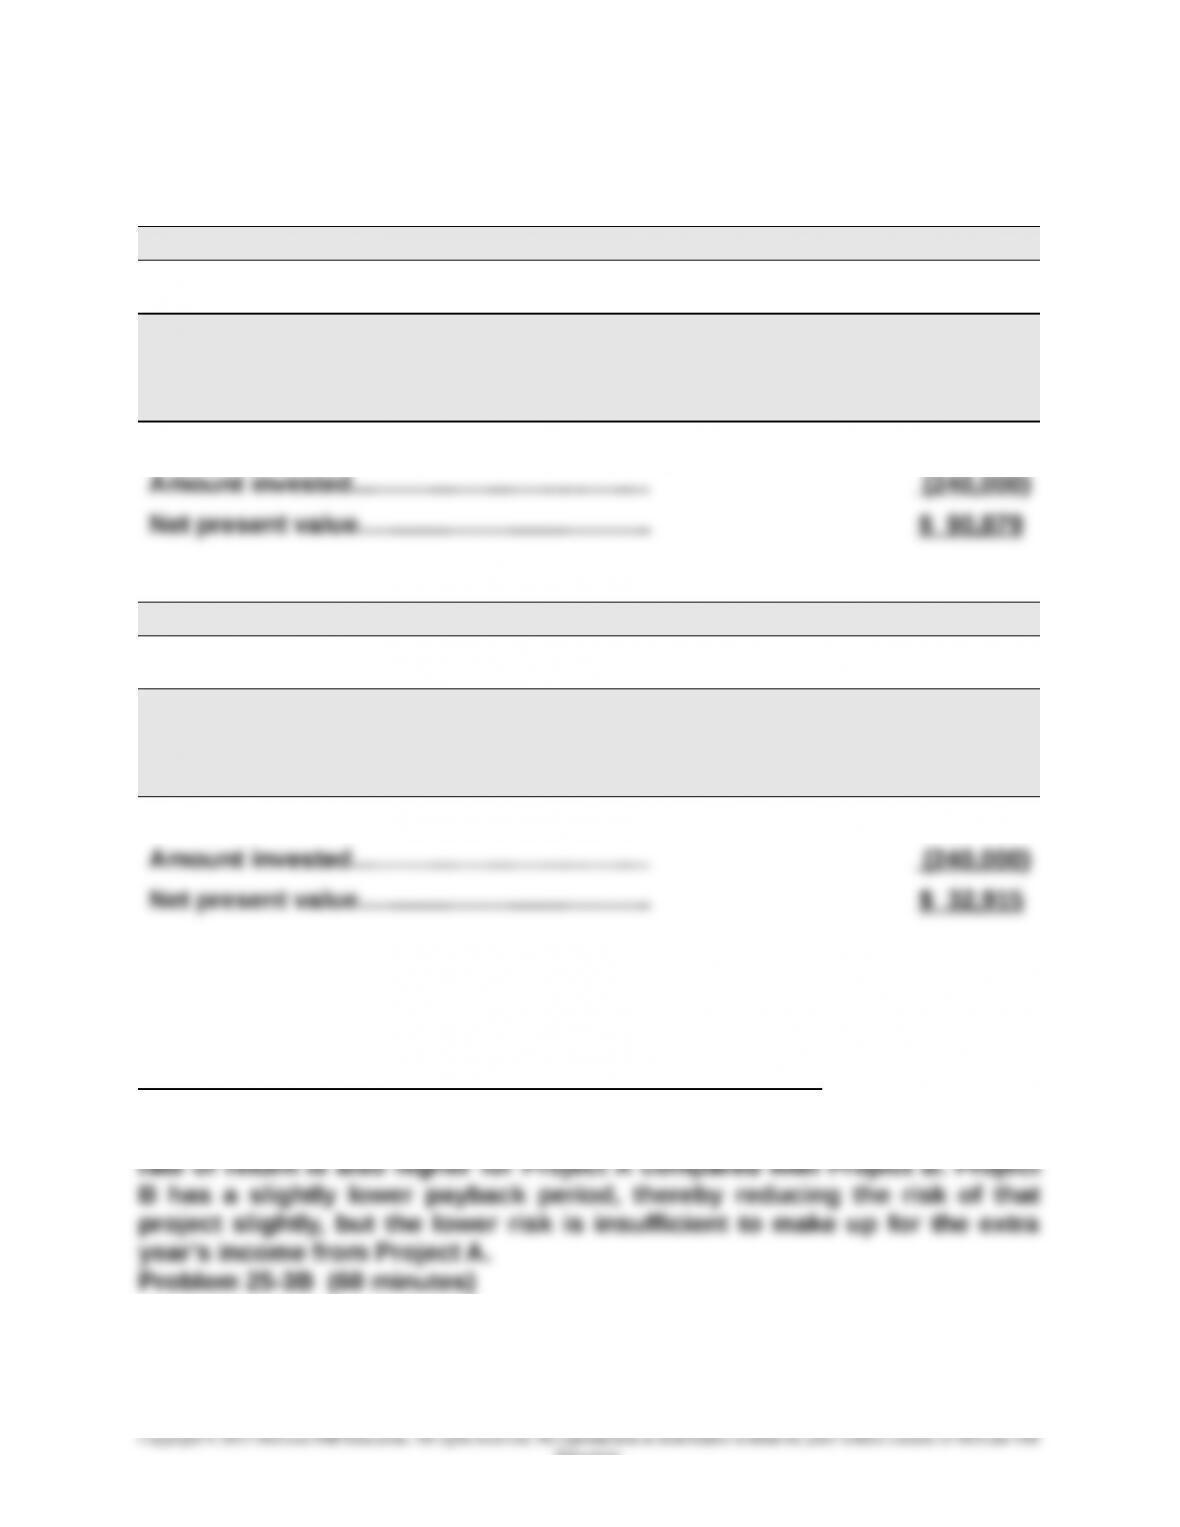
PROJECT A
Present Value of Net Cash Flows
Present Present
Value of Value of
Net Cash
Flows
1 at 8%
Annuity
Net Cash
Flows
Years 1-4……………………………………….…….… $99,900 3.3121 $330,879
PROJECT B
Present Value of Net Cash Flows
Present Present
Value of Value of
Net Cash
Flows
1 at 8%
Annuity
Net Cash
Flows
Years 1-3……………………………………….…….… $105,900 2.5771 $272,915
Part 5
Recommendation to management is to pursue Project A. This is because
although both projects have a positive net present value, Project A has a
higher positive net present value. We might also note that the accounting
Part 1
25-1481
Education.
Chapter 25 – Capital Budgeting and Managerial Decisions
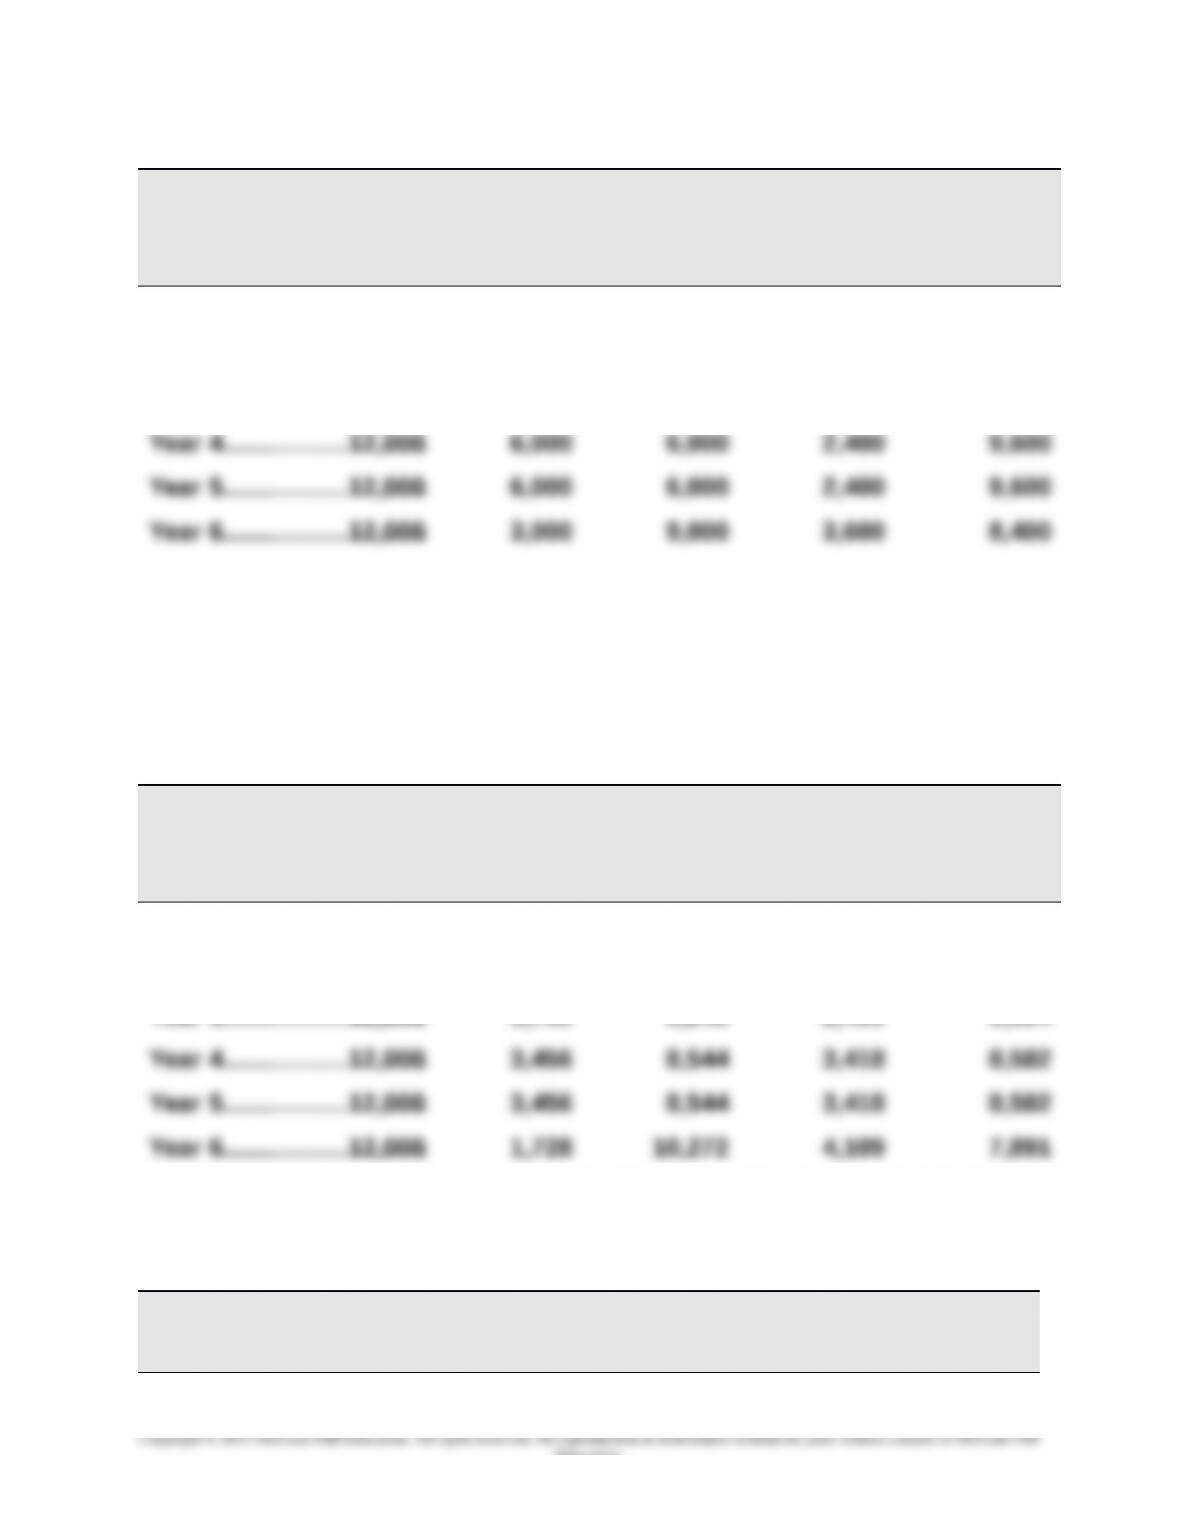
RESULTS USING STRAIGHT-LINE DEPRECIATION
(a)
Income
Before
Deprec.
(b)
Straight-
Line
Deprec.
(c)
Taxable
Income
(a) – (b)
(d)
40%
Income
Taxes
(e)
Net Cash
Flows
(a) – (d)
Year 1………………..……...$12,000 $3,000 $ 9,000 $3,600 $8,400
Year 2………………..……...12,000 6,000 6,000 2,400 9,600
Year 3………………..……...12,000 6,000 6,000 2,400 9,600
Part 2
RESULTS USING MACRS DEPRECIATION
(a)
Income
Before
Deprec.
(b)
MACRS
Deprec.
(c)
Taxable
Income
(a) – (b)
(d)
40%
Income
Taxes
(e)
Net Cash
Flows
(a) – (d)
Year 1………………..……...$12,000 $6,000 $ 6,000 $2,400 $ 9,600
Year 2………………..……...12,000 9,600 2,400 960 11,040
Year 3………………..……...12,000 5,760 6,240 2,496 9,504
Problem 25-3B (Continued)
Part 3
NET PRESENT VALUE OF ASSET USING STRAIGHT-LINE DEPRECIATION
Present Present
Net Cash Value of Value of Net
Flows 1 at 10% Cash Flows
Year 1…………………………………………………... $ 8,400 0.9091 $ 7,636
25-1482
Education.
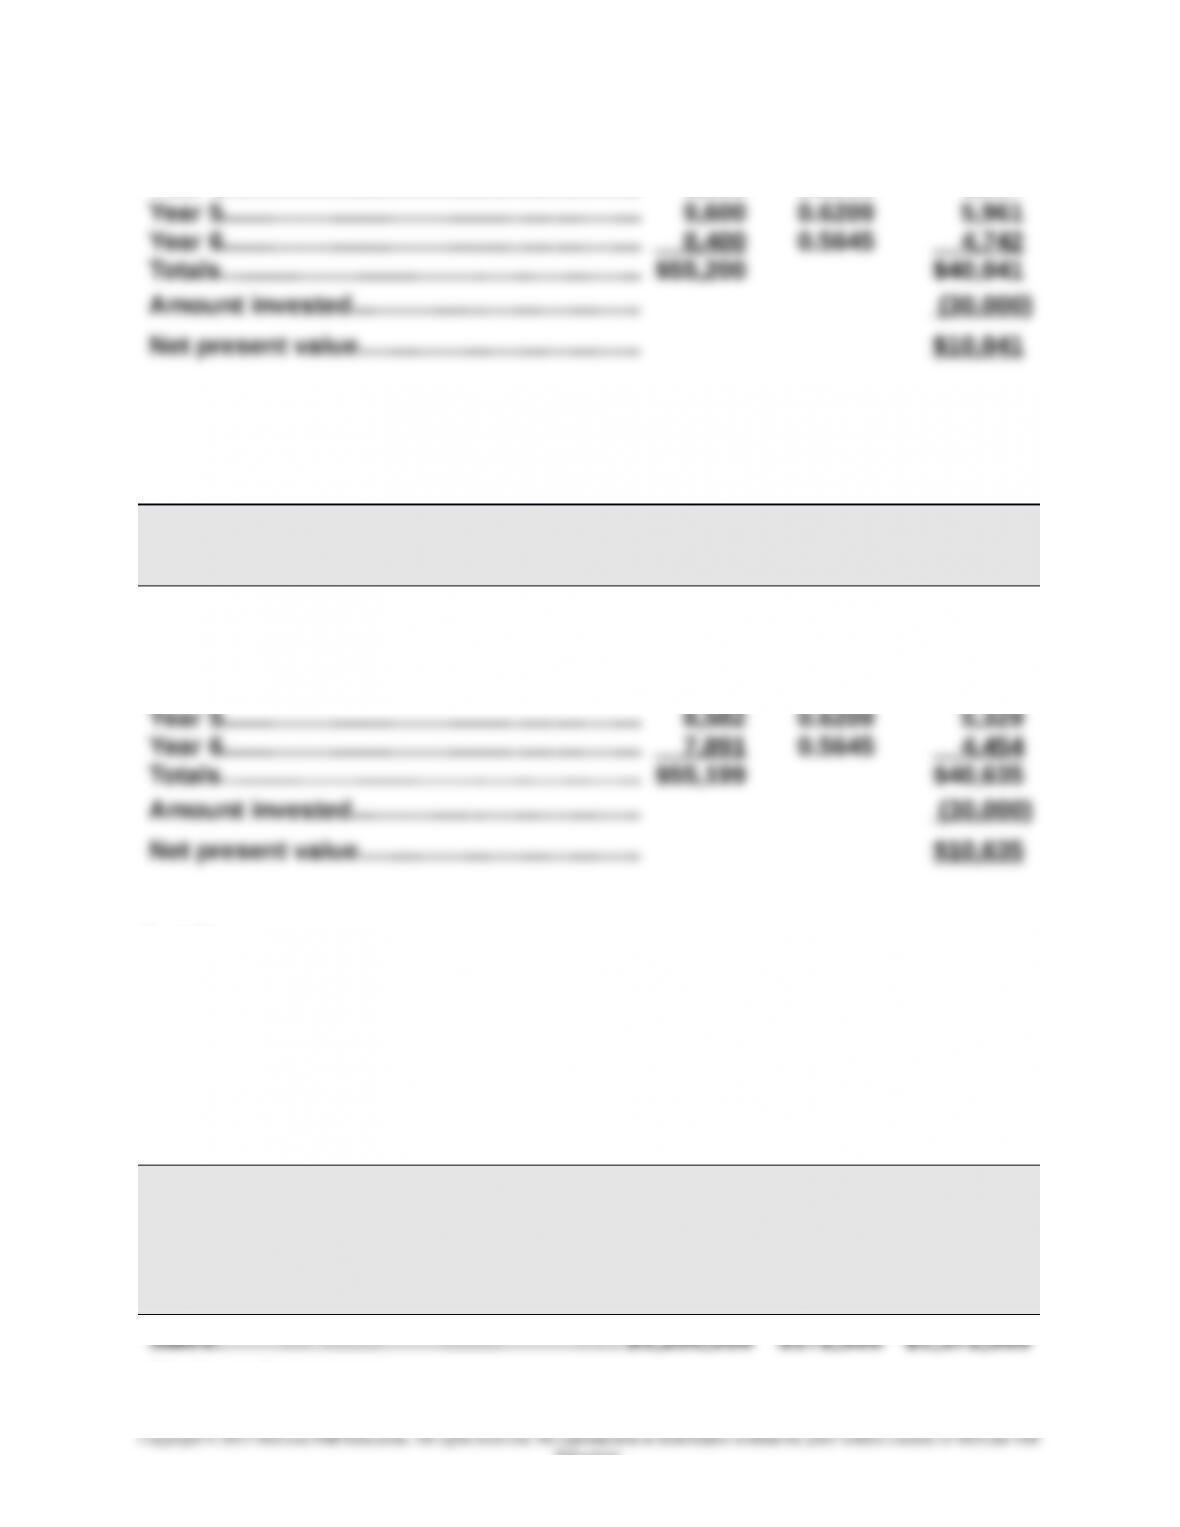
Chapter 25 – Capital Budgeting and Managerial Decisions
Year 2…………………………………………………... 9,600 0.8264 7,933
Year 3…………………………………………………... 9,600 0.7513 7,212
Year 4…………………………………………………... 9,600 0.6830 6,557
Part 4
NET PRESENT VALUE OF ASSET USING MACRS DEPRECIATION
Present Present
Net Cash Value of Value of Net
Flows 1 at 10% Cash Flows
Year 1…………………………………………………... $ 9,600 0.9091 $ 8,727
Year 2…………………………………………………... 11,040 0.8264 9,123
Year 3…………………………………………………... 9,504 0.7513 7,140
Year 4…………………………………………………... 8,582 0.6830 5,862
Part 5
Analysis: The net present value using MACRS depreciation is greater than the
net present value using straight-line depreciation because the cash flows are
larger in the earlier years of the asset’s life under MACRS depreciation. They
are larger because the depreciation deductions are larger, resulting in less
income taxes paid in the earlier years.
Problem 25-4B (45 minutes)
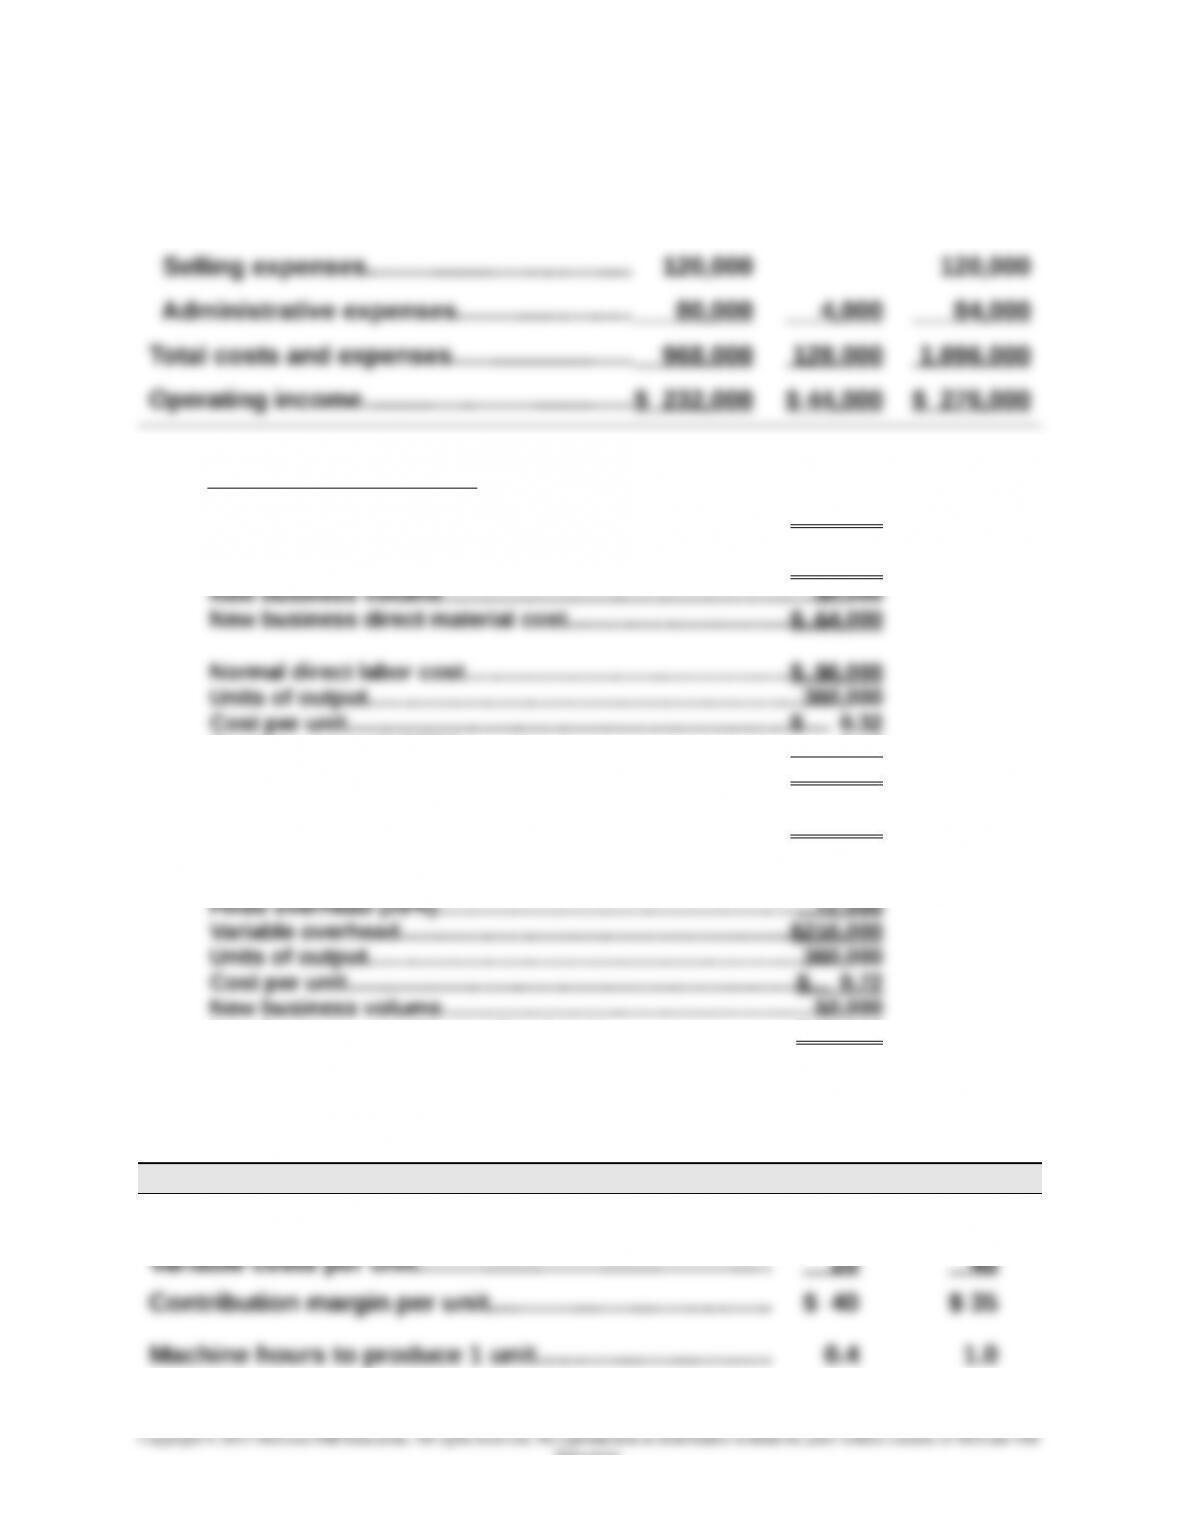
WINDMIRE COMPANY
COMPARATIVE INCOME STATEMENTS
(1) (2) (3)
Normal New
Volume Business Combined
Costs and expenses
25-1483
Education.
Chapter 25 – Capital Budgeting and Managerial Decisions
Direct materials……………….….…….…….… 384,000 64,000 448,000
Direct labor…………………….….…….…….…. 96,000 24,000 120,000
Overhead…………………………………………… 288,000 36,000 324,000
Supporting computations
Normal direct material cost…………………………….….…………….$384,000
Units of output…………………………………………………………………300,000
Cost per unit……………………………………………………….…………..$ 1.28
Overtime per unit (50%)…………………………………..………………. 0.16
New business direct labor cost per unit…..…………………….…$ 0.48
New business volume……………………………………………………...50,000
New business direct labor cost…………………………………………$ 24,000
Total overhead…………………………………………………………….…..$288,000
New business variable overhead cost……………………………....$ 36,000
Problem 25-5B (55 minutes)
Part 1
Product R Product T
Selling price per unit……………………………………………… $ 60 $ 80
25-1484
Education.
Chapter 25 – Capital Budgeting and Managerial Decisions
Part 2
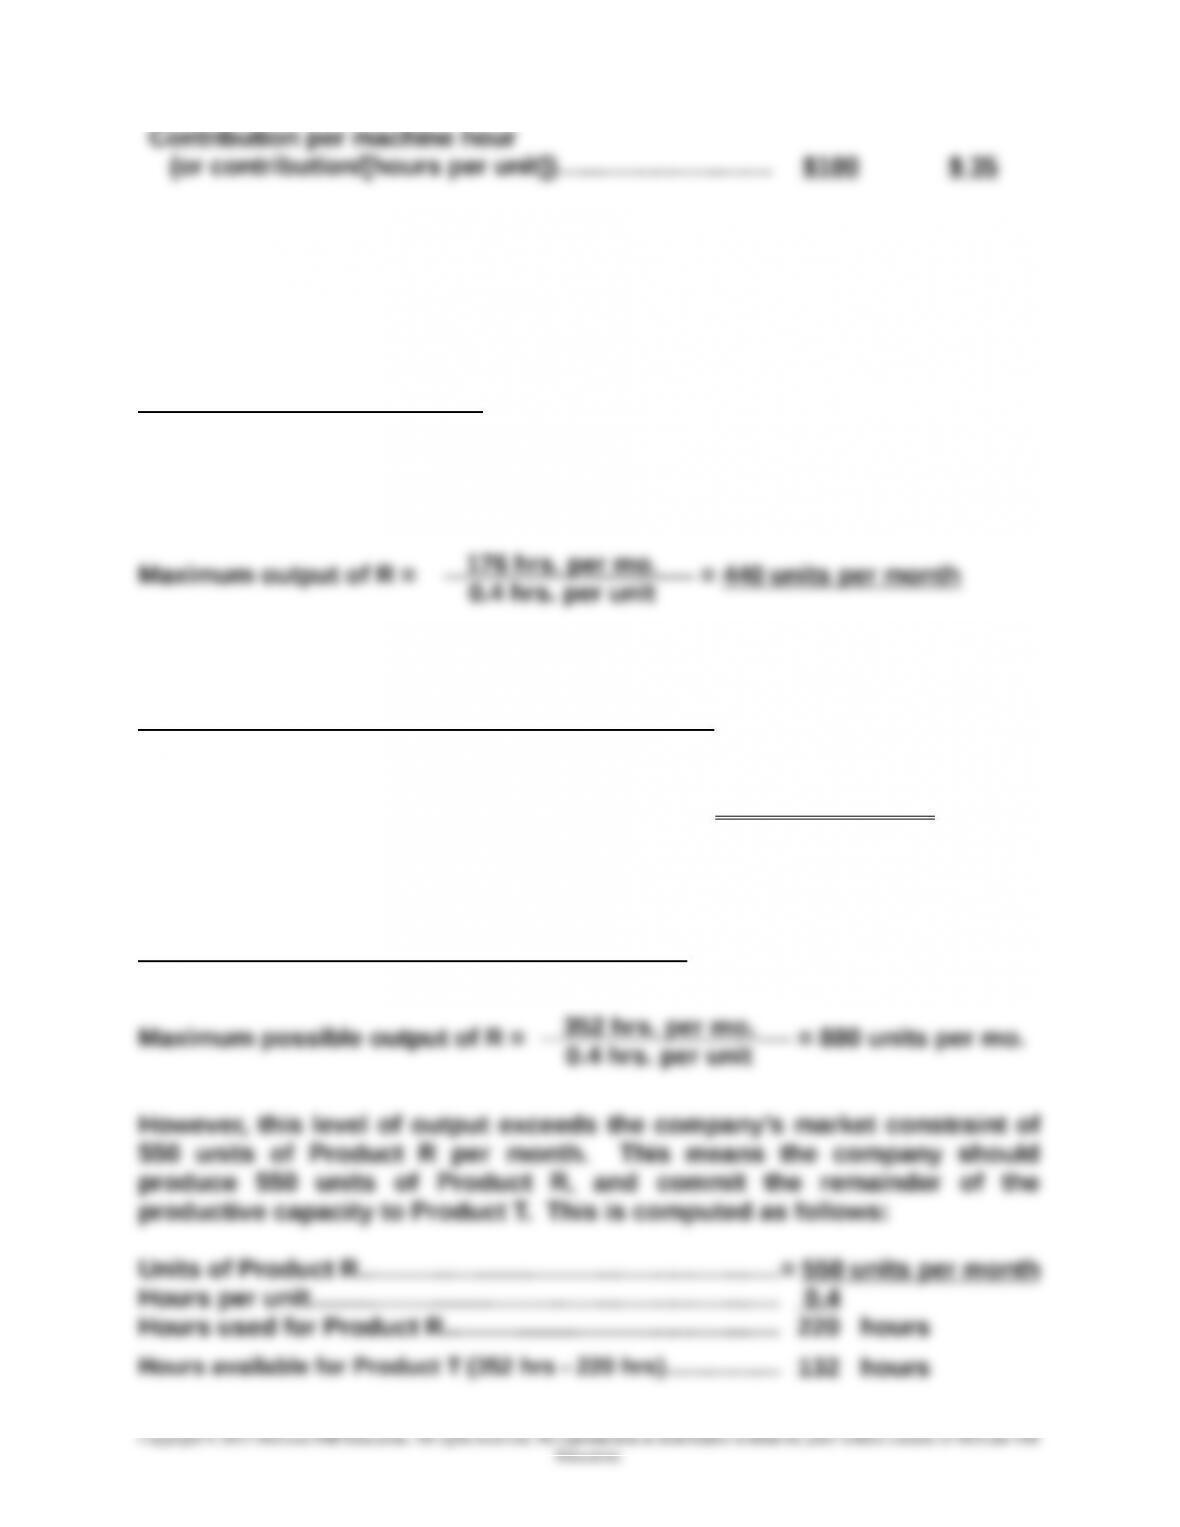
Sales Mix Recommendation To the extent allowed by production and
market constraints, the company should produce as much of Product R as
possible. With a single shift yielding 176 hours per month (8 x 22), the
company can produce these units of Product R:
Contribution Margin at Recommended Sales Mix
Contribution margin = 440 units x $40 per unit = $17,600 per month
Problem 25-5B (Continued)
Part 3
Sales Mix Recommendation with Second Shift If the second shift is added,
the maximum possible output of R will double:
25-1485
Copyright © 2015 McGraw-Hill Education. All rights reserved. No reproduction or distribution without the prior written consent of McGraw-Hill
Education.
176 hrs. per mo.
0.4 hrs. per unit
352 hrs. per mo.
Chapter 25 – Capital Budgeting and Managerial Decisions
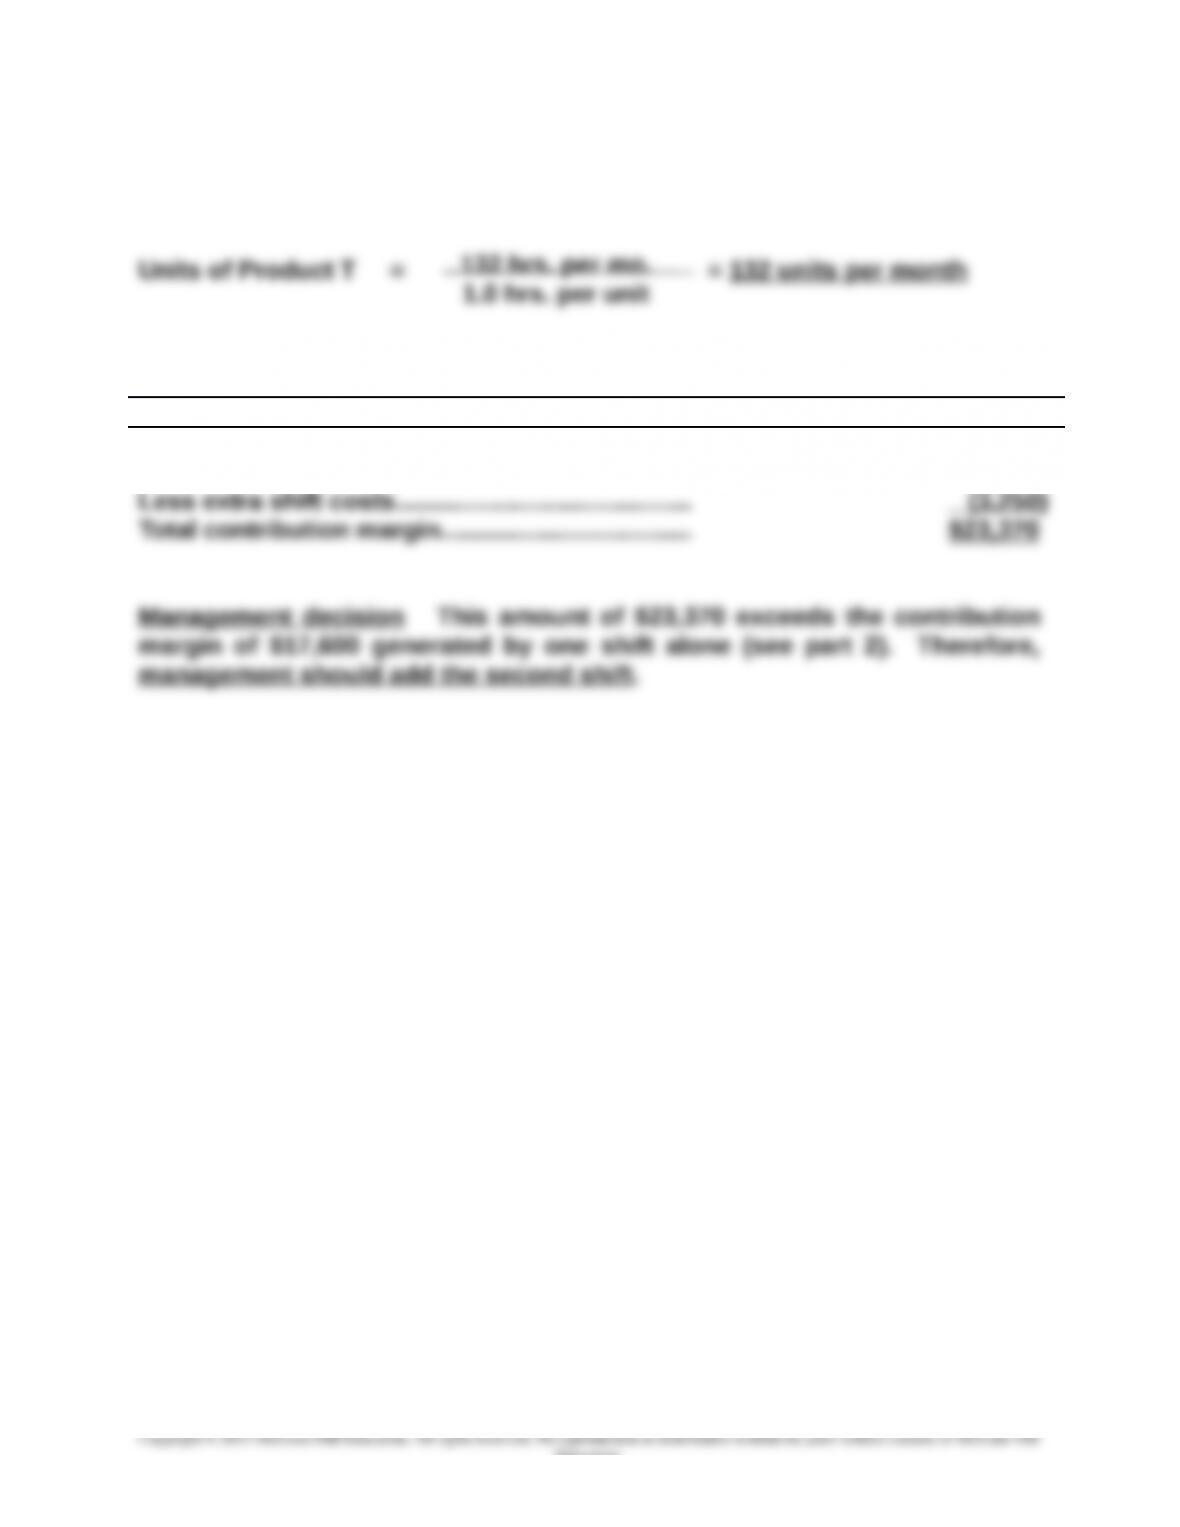
The output of Product T with 132 production hours is
Contribution Margin at This Sales Mix
Units Contr./unit Total
From R………………………………………………………….550 $40 $22,000
From T…………………………………………..….…….…… 132 35 4,620
25-1486
Education.
Chapter 25 – Capital Budgeting and Managerial Decisions
Problem 25-5B (Continued)
Part 4
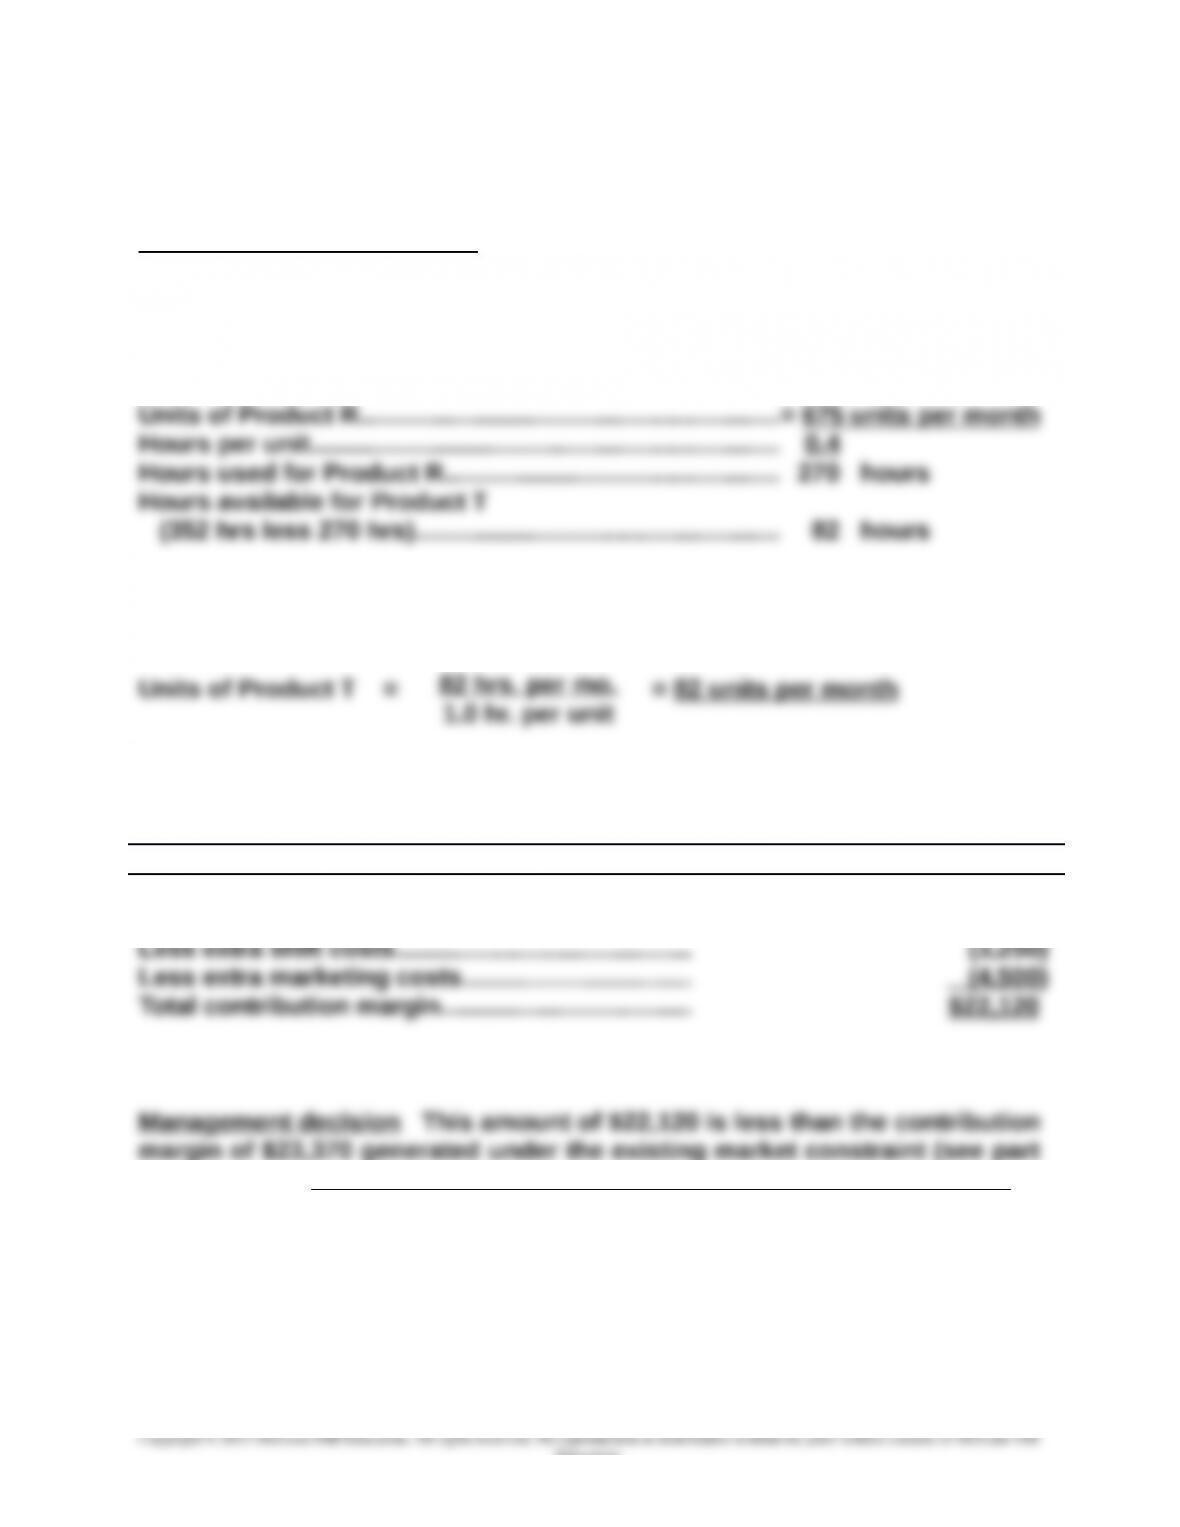
Sales Mix Recommendation By incurring additional marketing cost, the
company can relax the market constraint for sales of Product R up to the
point where 675 units can be sold. This means the company can produce
675 units of Product R, and commit the remainder of its productive
capacity to Product T. These computations are:
The output of Product T with 82 production hours is
Contribution Margin with This Sales Mix
Units Contr./unit Total
From R………………………………………………………….675 $40 $27,000
From T…………………………………………..….…….…… 82 35 2,870
3). Therefore, management should not undertake this marketing strategy.
25-1487
Education.
Chapter 25 – Capital Budgeting and Managerial Decisions
Problem 25-6B (60 minutes)
Part 1
ESME COMPANY
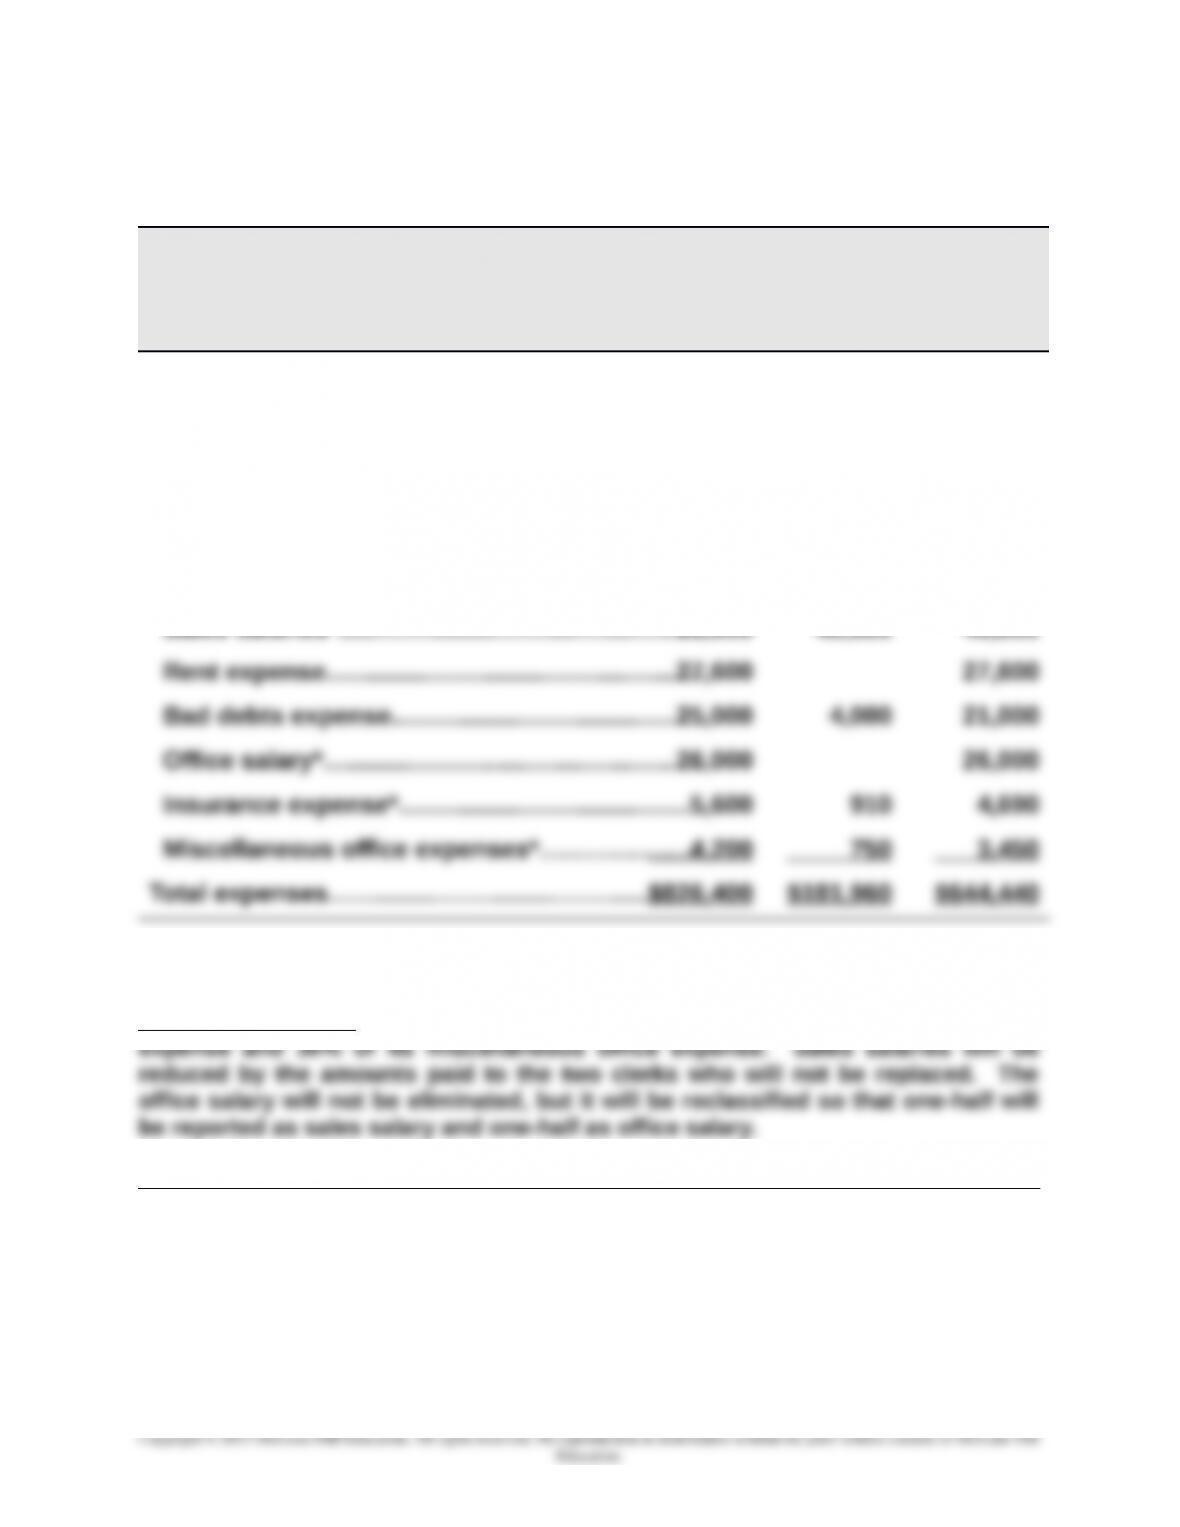
Analysis of Expenses under Elimination of Department Z
Total Eliminated Continuing
Expenses Expenses Expenses
Cost of goods sold………………………………..……...$586,400 $125,100 $461,300
Direct expenses
Advertising………………………………………….….…..30,000 3,000 27,000
Store supplies used………………..….…….…….…..7,000 1,400 5,600
Depreciation of store equip………………………….21,000 21,000
Allocated expenses
Sales salaries*………………………..….…….…….…..93,600 46,800 46,800
Computation Notes Closing Department Z will eliminate 65% of its insurance
25-1488