Problem 25-2B (Continued)
Part 4
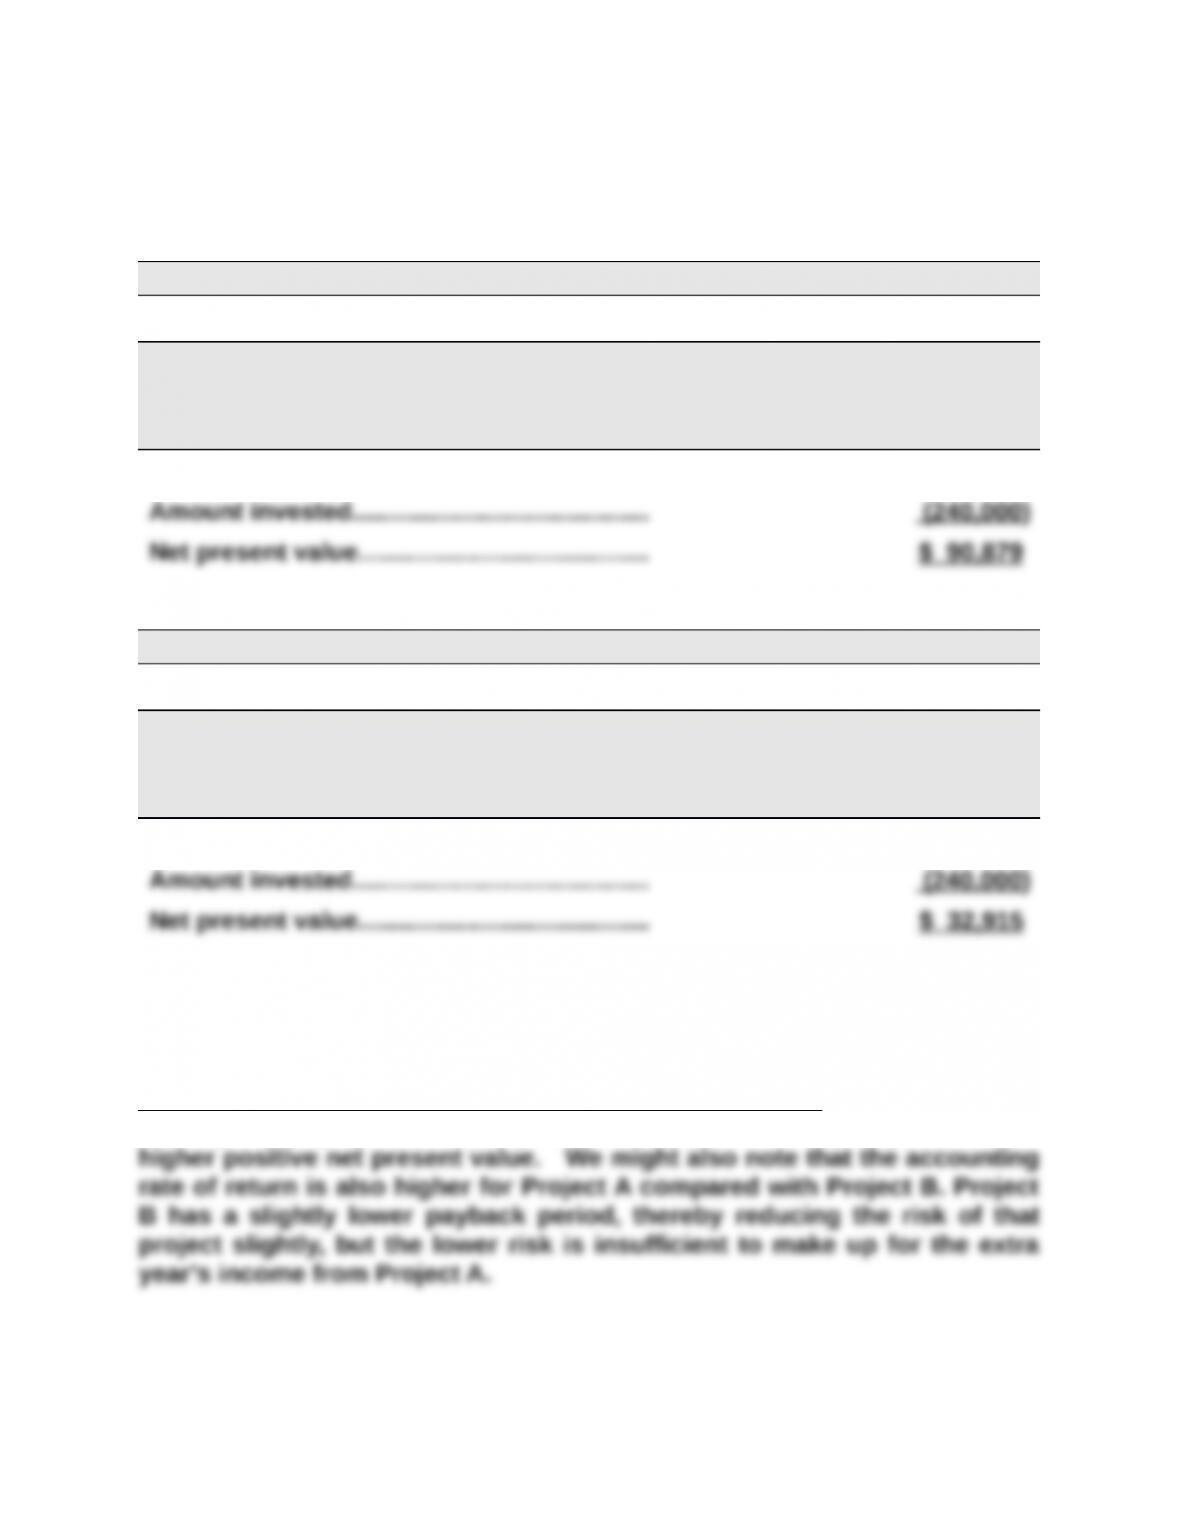
PROJECT A
Present Value of Net Cash Flows
Present Present
Value of Value of
Net Cash
Flows
1 at 8%
Annuity
Net Cash
Flows
Years 1-4……………………………………………… $99,900 3.3121 $330,879
PROJECT B
Present Value of Net Cash Flows
Present Present
Value of Value of
Net Cash
Flows
1 at 8%
Annuity
Net Cash
Flows
Years 1-3……………………………………………… $105,900 2.5771 $272,915
Part 5
Recommendation to management is to pursue Project A. This is because
although both projects have a positive net present value, Project A has a
Problem 25-3B (60 minutes)
Part 1
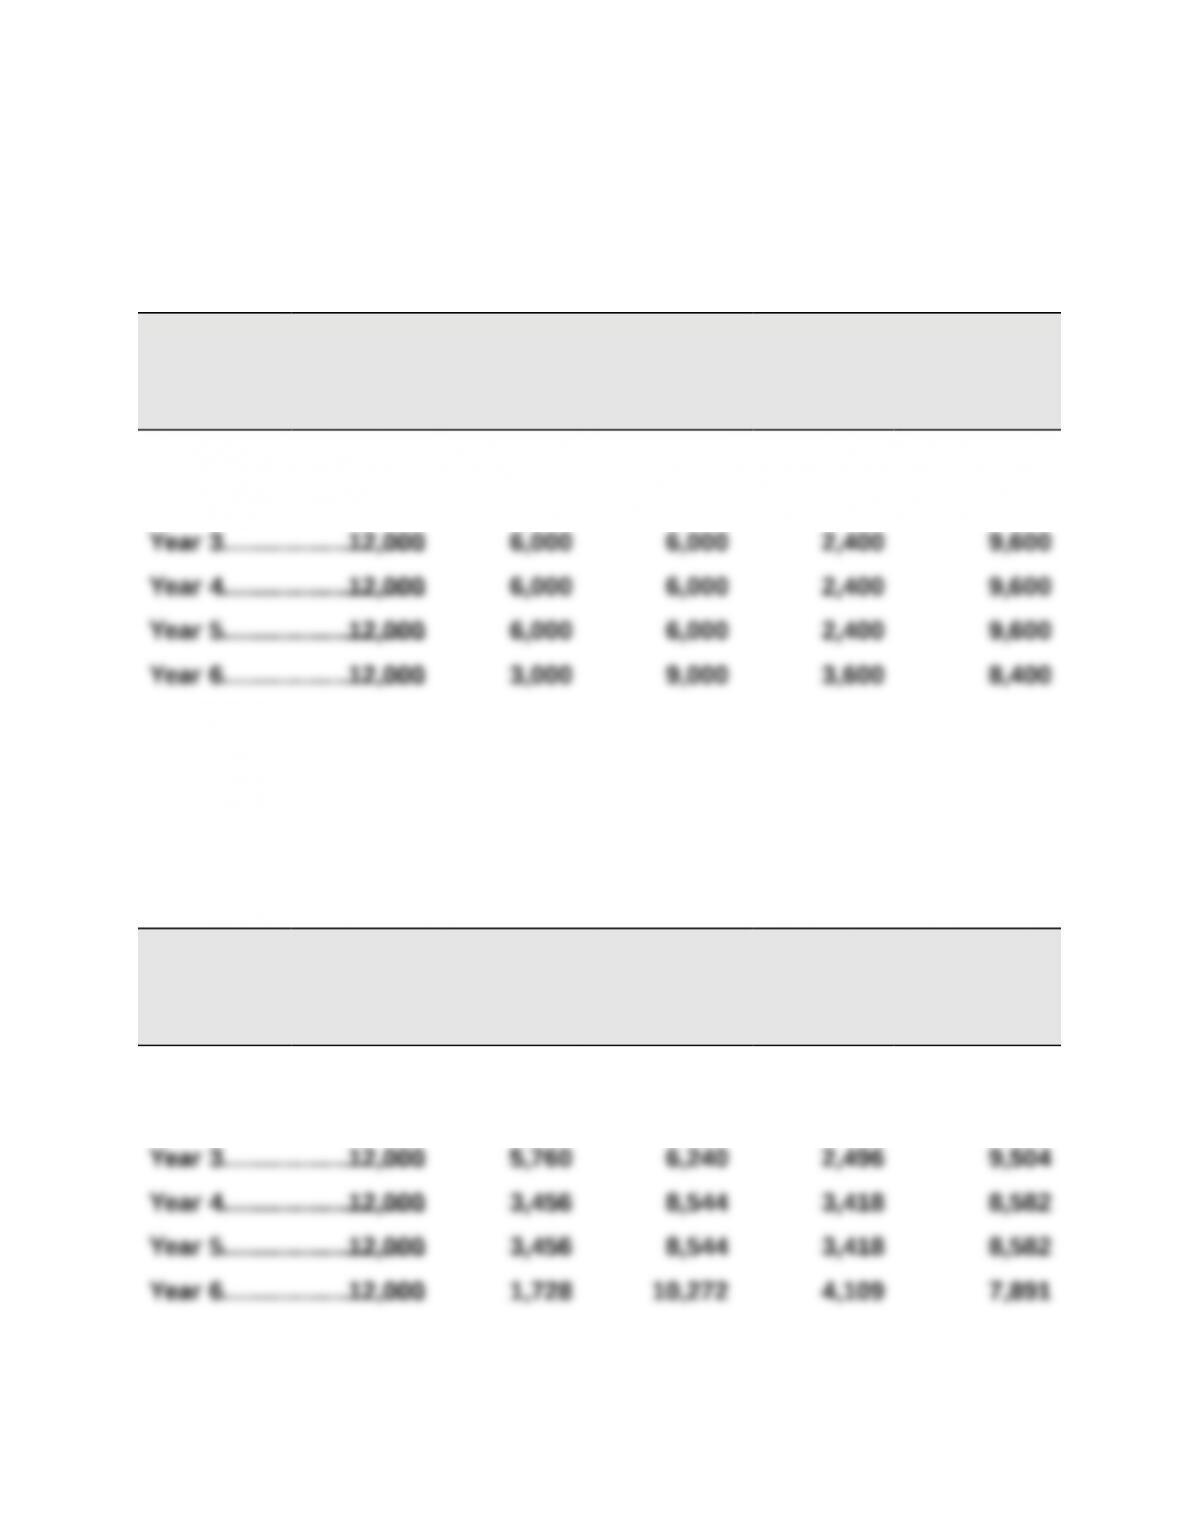
RESULTS USING STRAIGHT-LINE DEPRECIATION
(a)
Income
Before
Deprec.
(b)
Straight-Li
ne Deprec.
(c)
Taxable
Income
(a) – (b)
(d)
40%
Income
Taxes
(e)
Net Cash
Flows
(a) – (d)
Year 1……………………….$12,000 $3,000 $ 9,000 $3,600 $8,400
Year 2……………………….12,000 6,000 6,000 2,400 9,600
Part 2
RESULTS USING MACRS DEPRECIATION
(a)
Income
Before
Deprec.
(b)
MACRS
Deprec.
(c)
Taxable
Income
(a) – (b)
(d)
40%
Income
Taxes
(e)
Net Cash
Flows
(a) – (d)
Year 1……………………….$12,000 $6,000 $ 6,000 $2,400 $ 9,600
Year 2……………………….12,000 9,600 2,400 960 11,040
Problem 25-3B (Continued)
Part 3
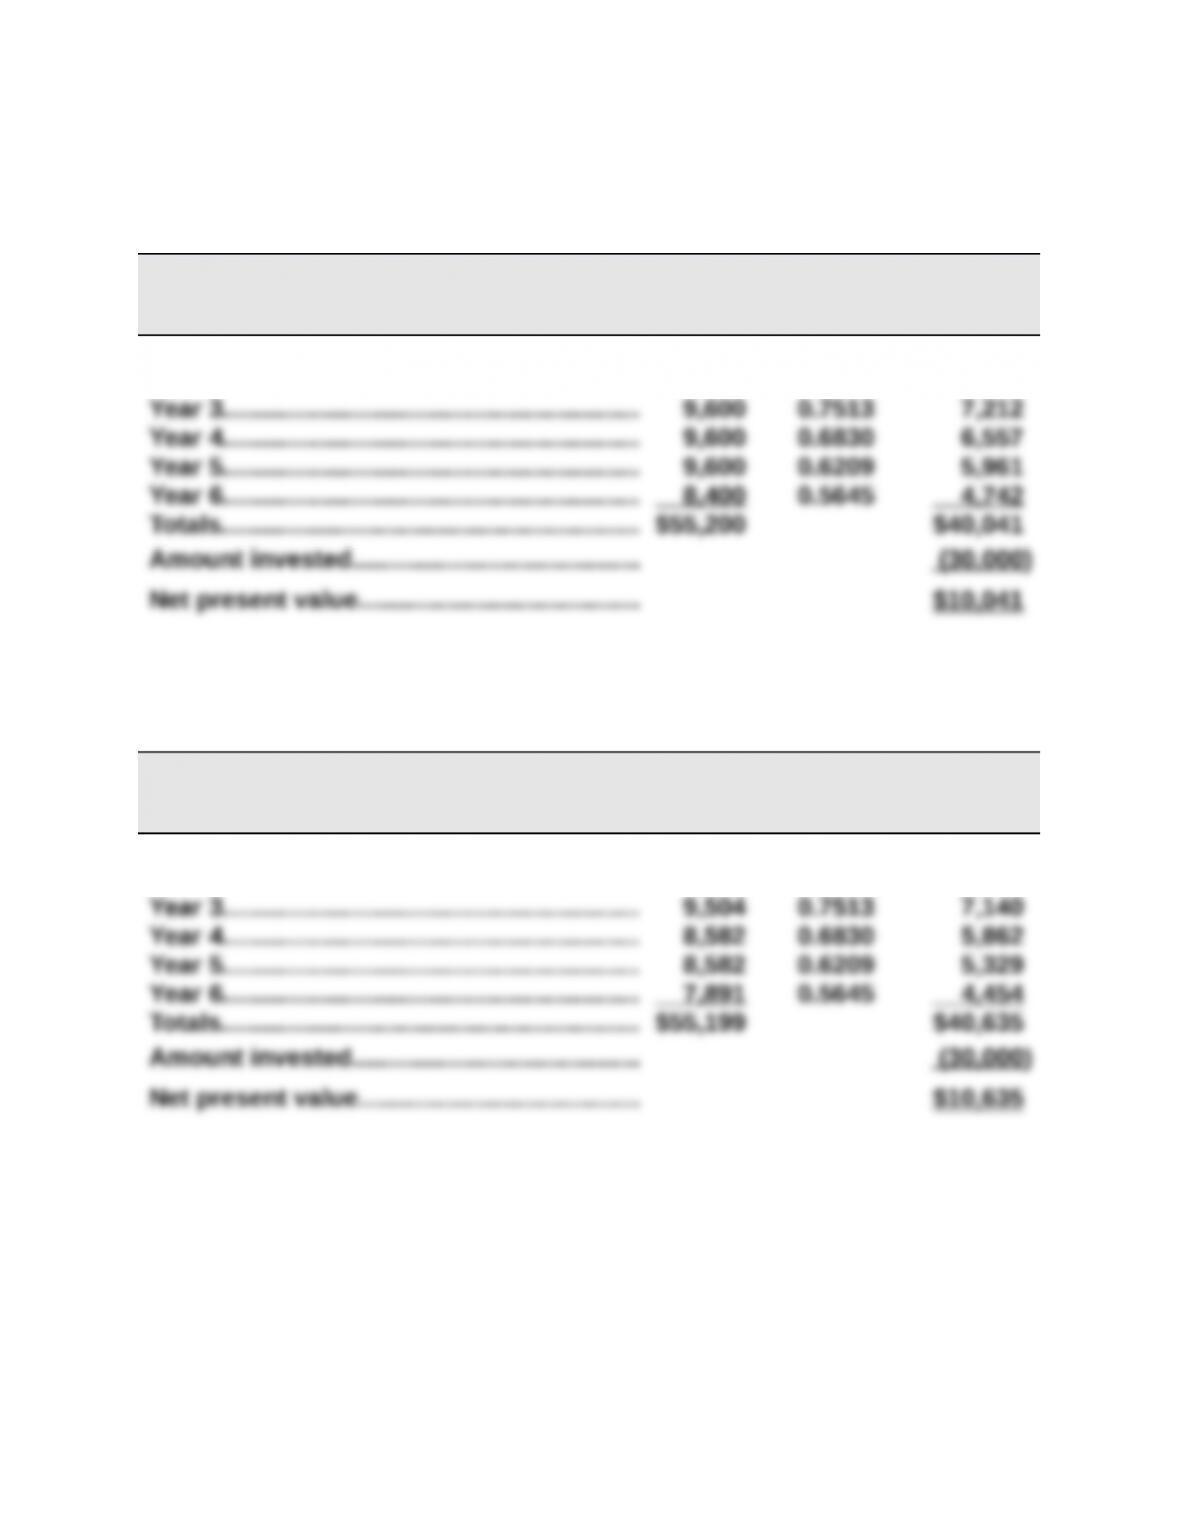
NET PRESENT VALUE OF ASSET USING STRAIGHT-LINE DEPRECIATION
Present Present
Net Cash Value of Value of Net
Flows 1 at 10% Cash Flows
Year 1…………………………………………………. $ 8,400 0.9091 $ 7,636
Year 2…………………………………………………. 9,600 0.8264 7,933
Part 4
NET PRESENT VALUE OF ASSET USING MACRS DEPRECIATION
Present Present
Net Cash Value of Value of Net
Flows 1 at 10% Cash Flows
Year 1…………………………………………………. $ 9,600 0.9091 $ 8,727
Year 2…………………………………………………. 11,040 0.8264 9,123
Part 5
Analysis: The net present value using MACRS depreciation is greater than the
net present value using straight-line depreciation because the cash flows are
larger in the earlier years of the asset’s life under MACRS depreciation. They
are larger because the depreciation deductions are larger, resulting in less
income taxes paid in the earlier years.
Problem 25-4B (45 minutes)
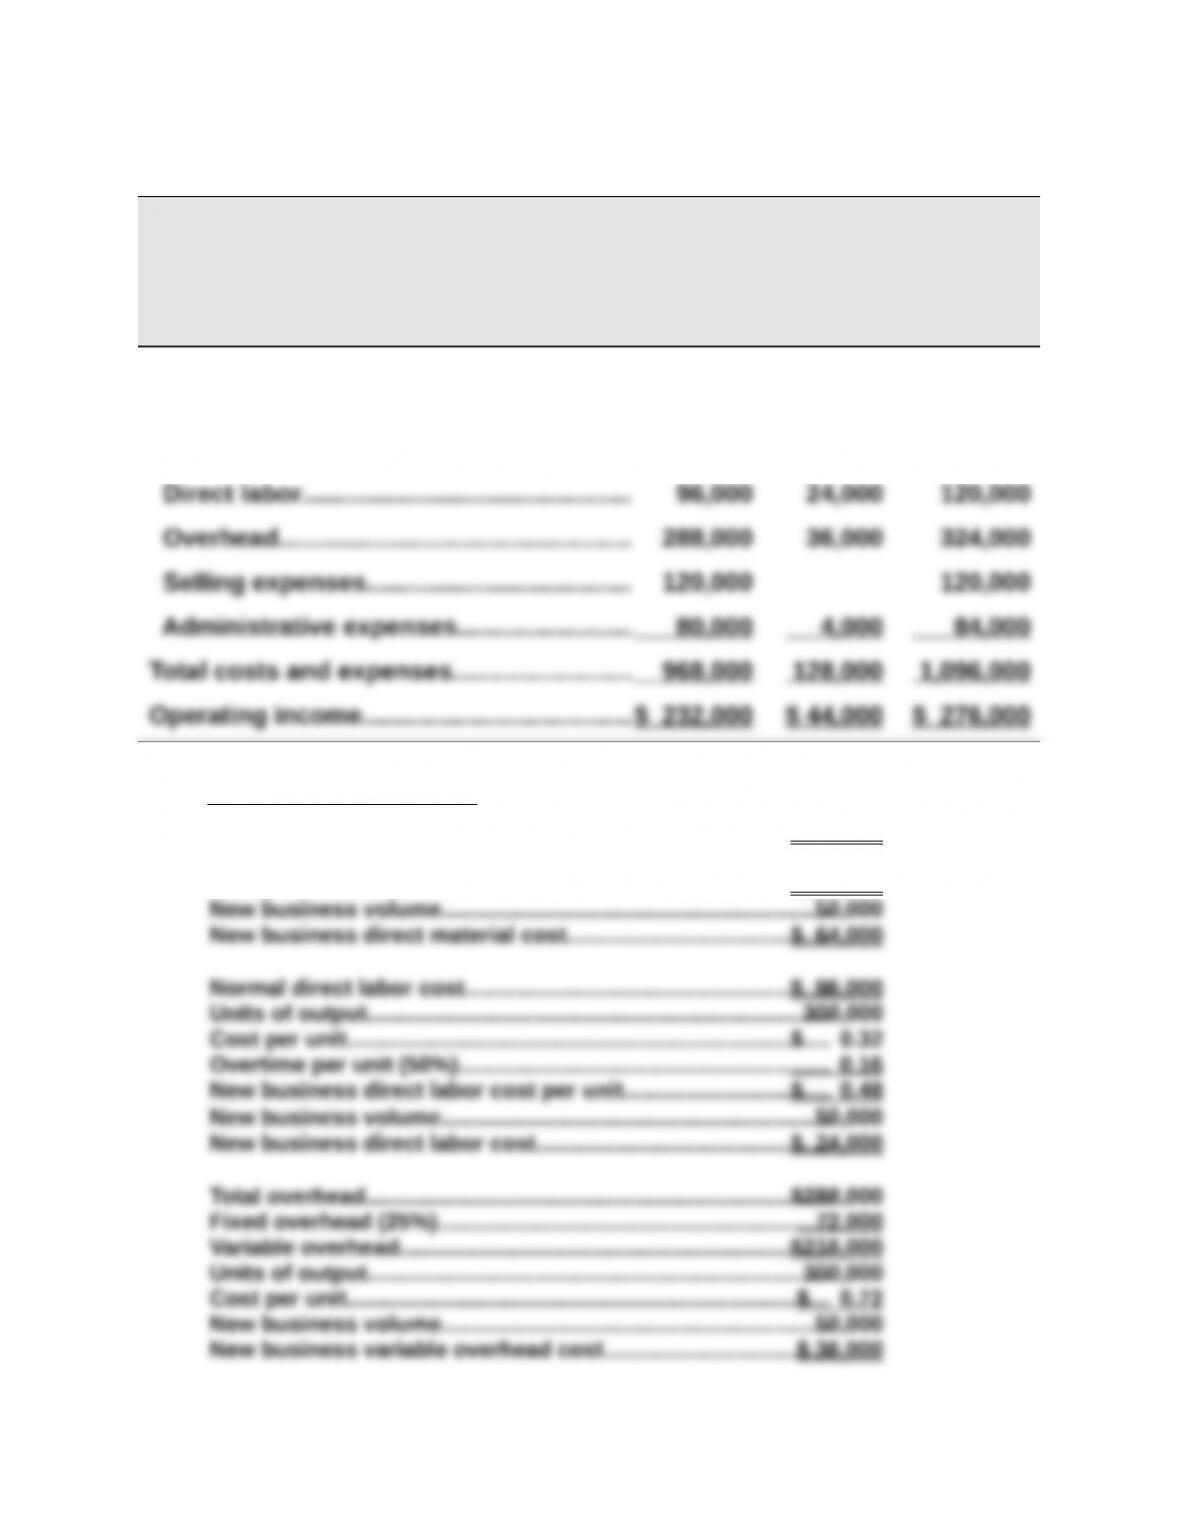
WINDMIRE COMPANY
COMPARATIVE INCOME STATEMENTS
(1) (2) (3)
Normal New
Volume Business Combined
Sales………………………………………………….$1,200,000 $172,000 $1,372,000
Costs and expenses
Direct materials………………………………… 384,000 64,000 448,000
Supporting computations
Normal direct material cost………………………………………………$384,000
Units of output…………………………………………………………………300,000
Cost per unit……………………………………………………………………$ 1.28
Problem 25-5B (55 minutes)
Part 1
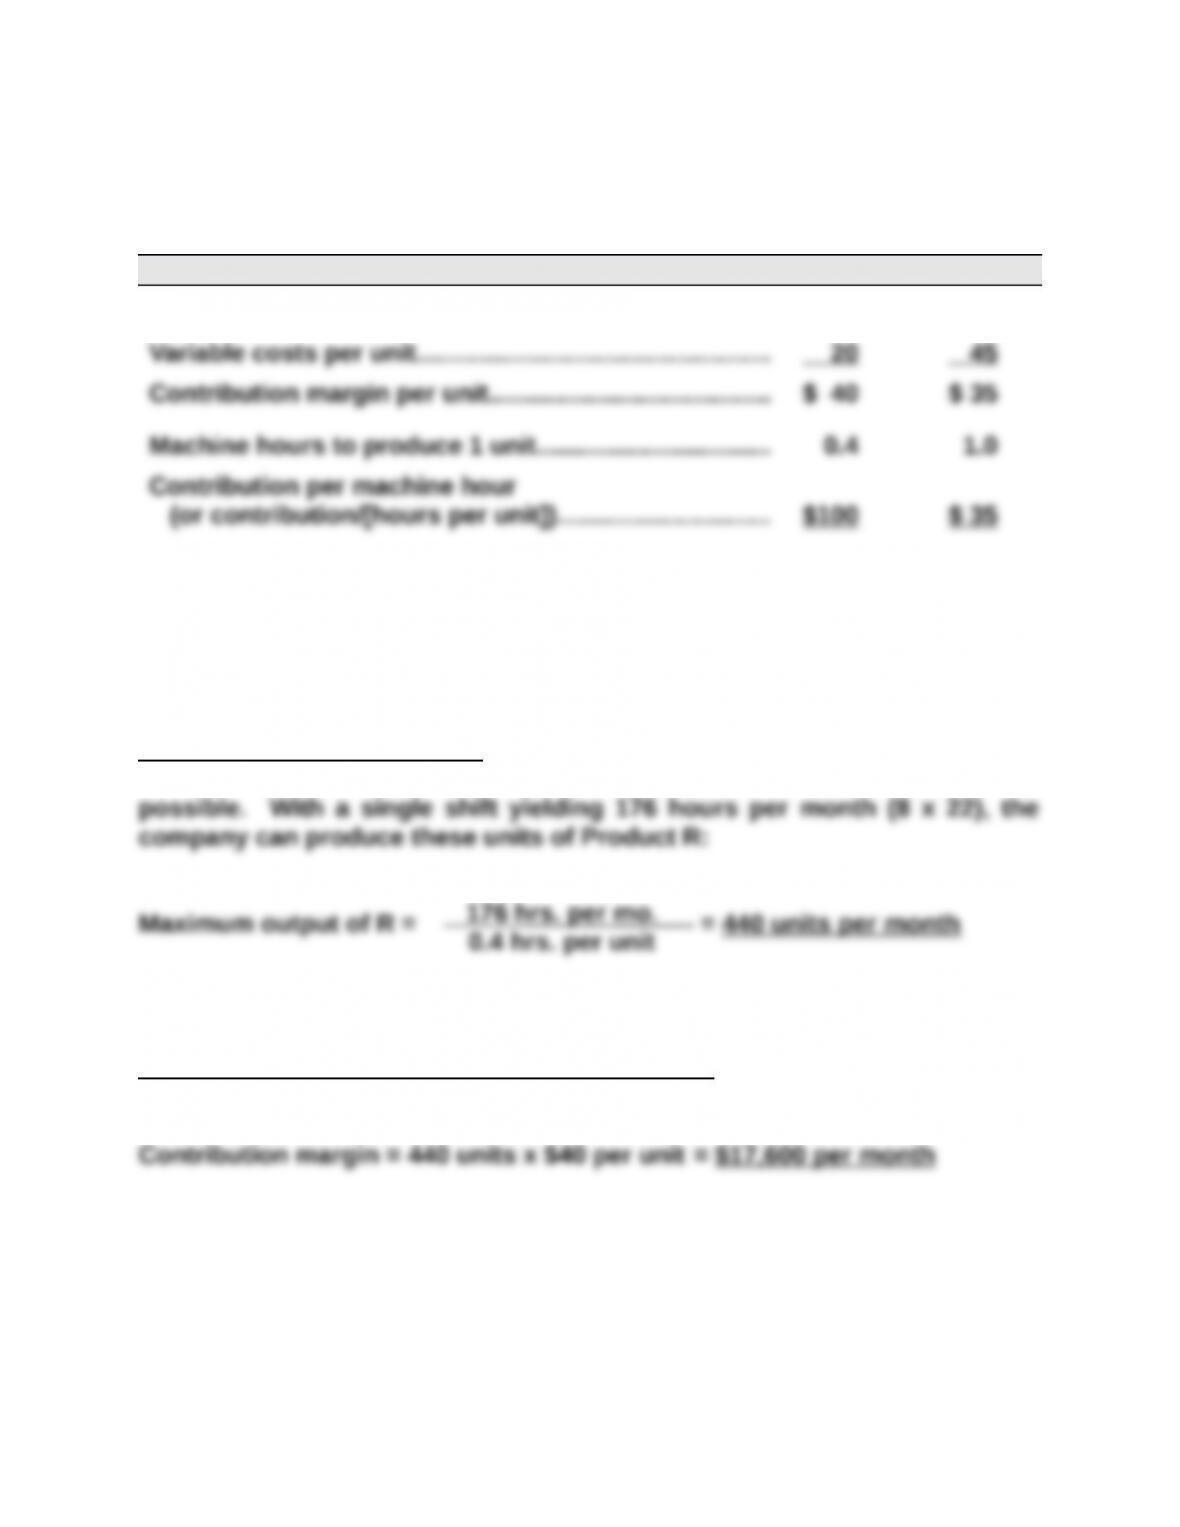
Product R Product T
Selling price per unit……………………………………………. $ 60 $ 80
Part 2
Sales Mix Recommendation To the extent allowed by production and
market constraints, the company should produce as much of Product R as
Contribution Margin at Recommended Sales Mix
Contribution margin = 440 units x $40 per unit = $17,600 per month
0.4 hrs. per unit
Problem 25-5B (Continued)
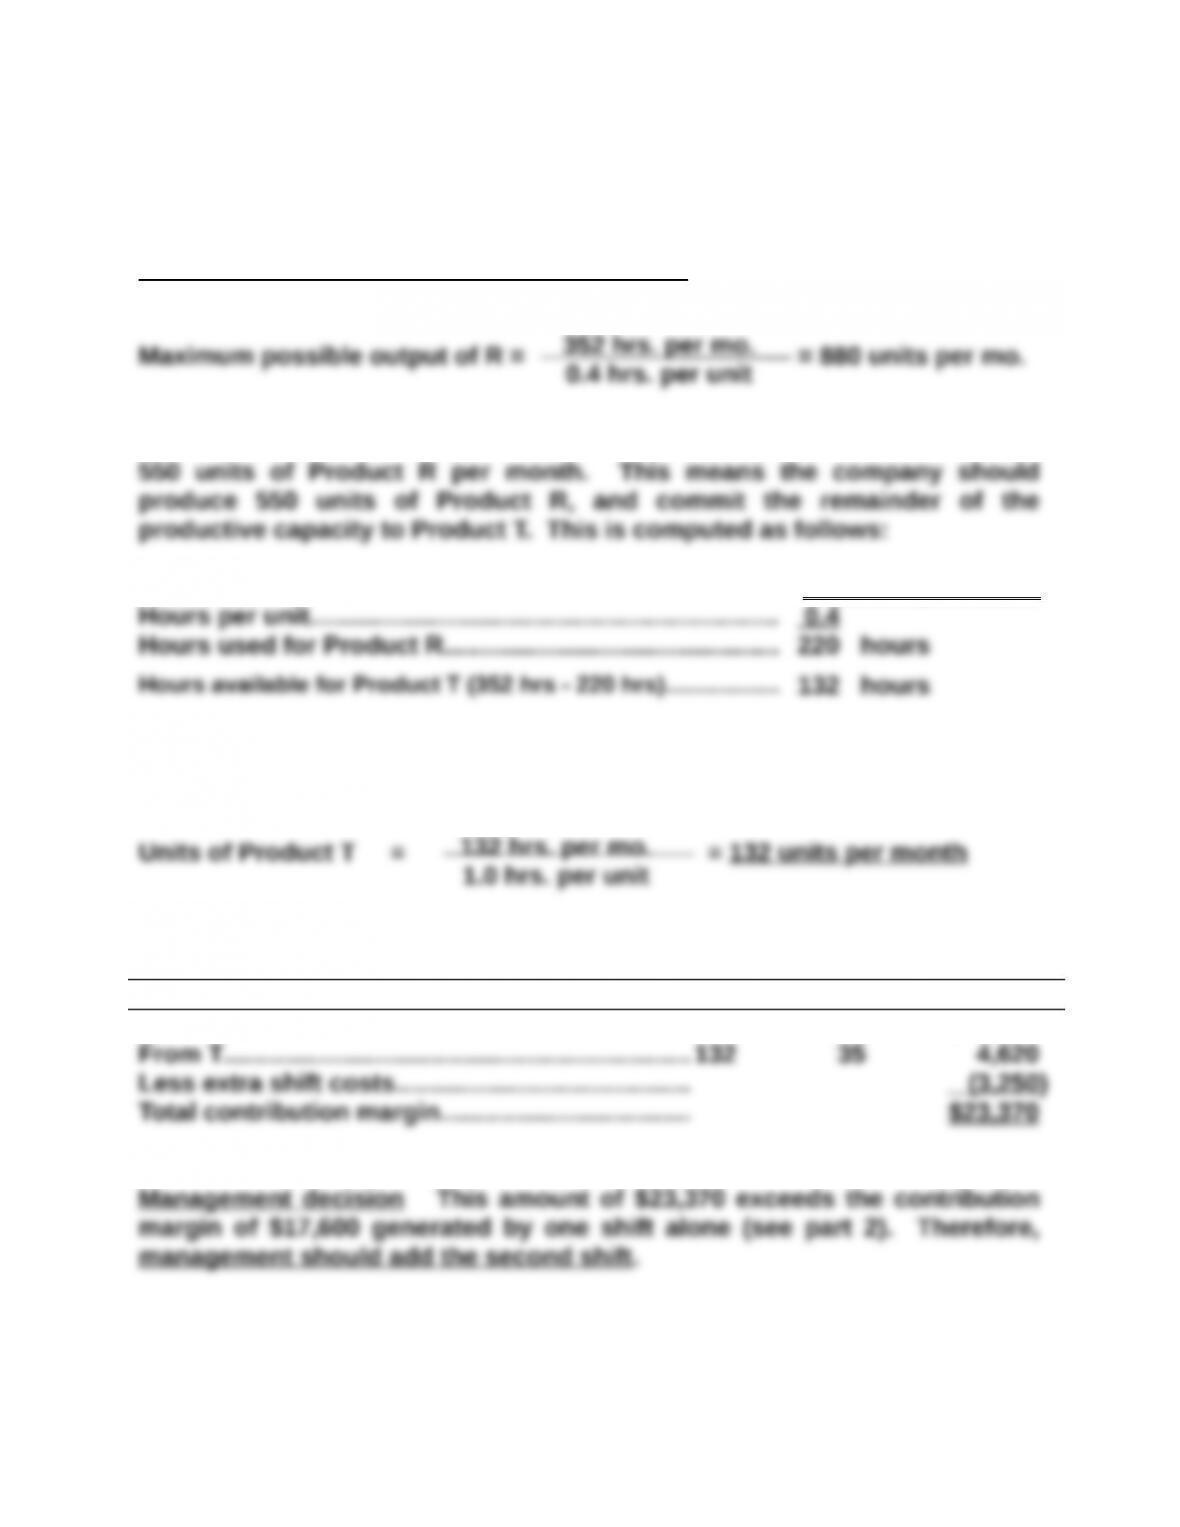
Part 3
Sales Mix Recommendation with Second Shift If the second shift is added,
the maximum possible output of R will double:
However, this level of output exceeds the company’s market constraint of
Units of Product R………………………………………………….. = 550 units per month
The output of Product T with 132 production hours is
Contribution Margin at This Sales Mix
Units Contr./unit Total
From R……………………………………………………….. 550 $40 $22,000
From T……………………………………………………….. 132 35 4,620
Less extra shift costs………………………………….. (3,250)
Total contribution margin…………………………….. $23,370
Management decision This amount of $23,370 exceeds the contribution
margin of $17,600 generated by one shift alone (see part 2). Therefore,
management should add the second shift.
352 hrs. per mo.
0.4 hrs. per unit
132 hrs. per mo.
1.0 hrs. per unit
Problem 25-5B (Continued)
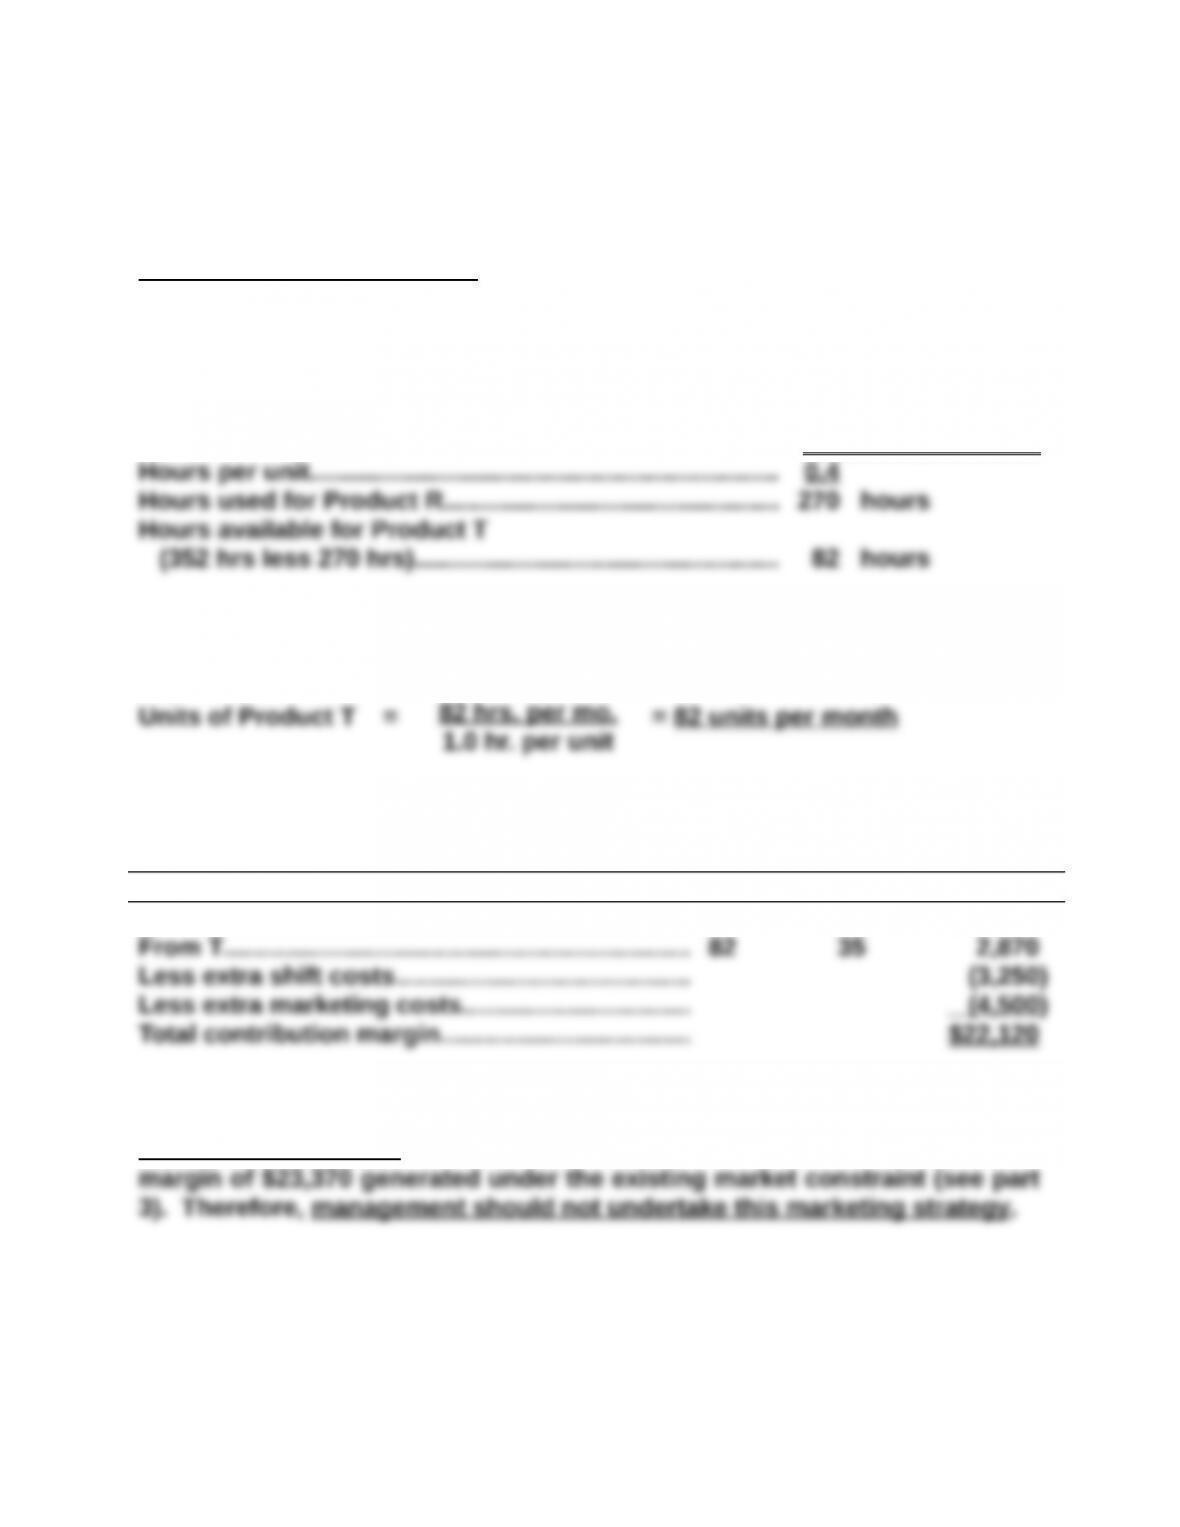
Part 4
Sales Mix Recommendation By incurring additional marketing cost, the
company can relax the market constraint for sales of Product R up to the
point where 675 units can be sold. This means the company can produce
675 units of Product R, and commit the remainder of its productive
capacity to Product T. These computations are:
Units of Product R………………………………………………….. = 675 units per month
The output of Product T with 82 production hours is
Contribution Margin with This Sales Mix
Units Contr./unit Total
From R……………………………………………………….. 675 $40 $27,000
Management decision This amount of $22,120 is less than the contribution
margin of $23,370 generated under the existing market constraint (see part
3). Therefore, management should not undertake this marketing strategy.
1.0 hr. per unit
Problem 25-6B (60 minutes)
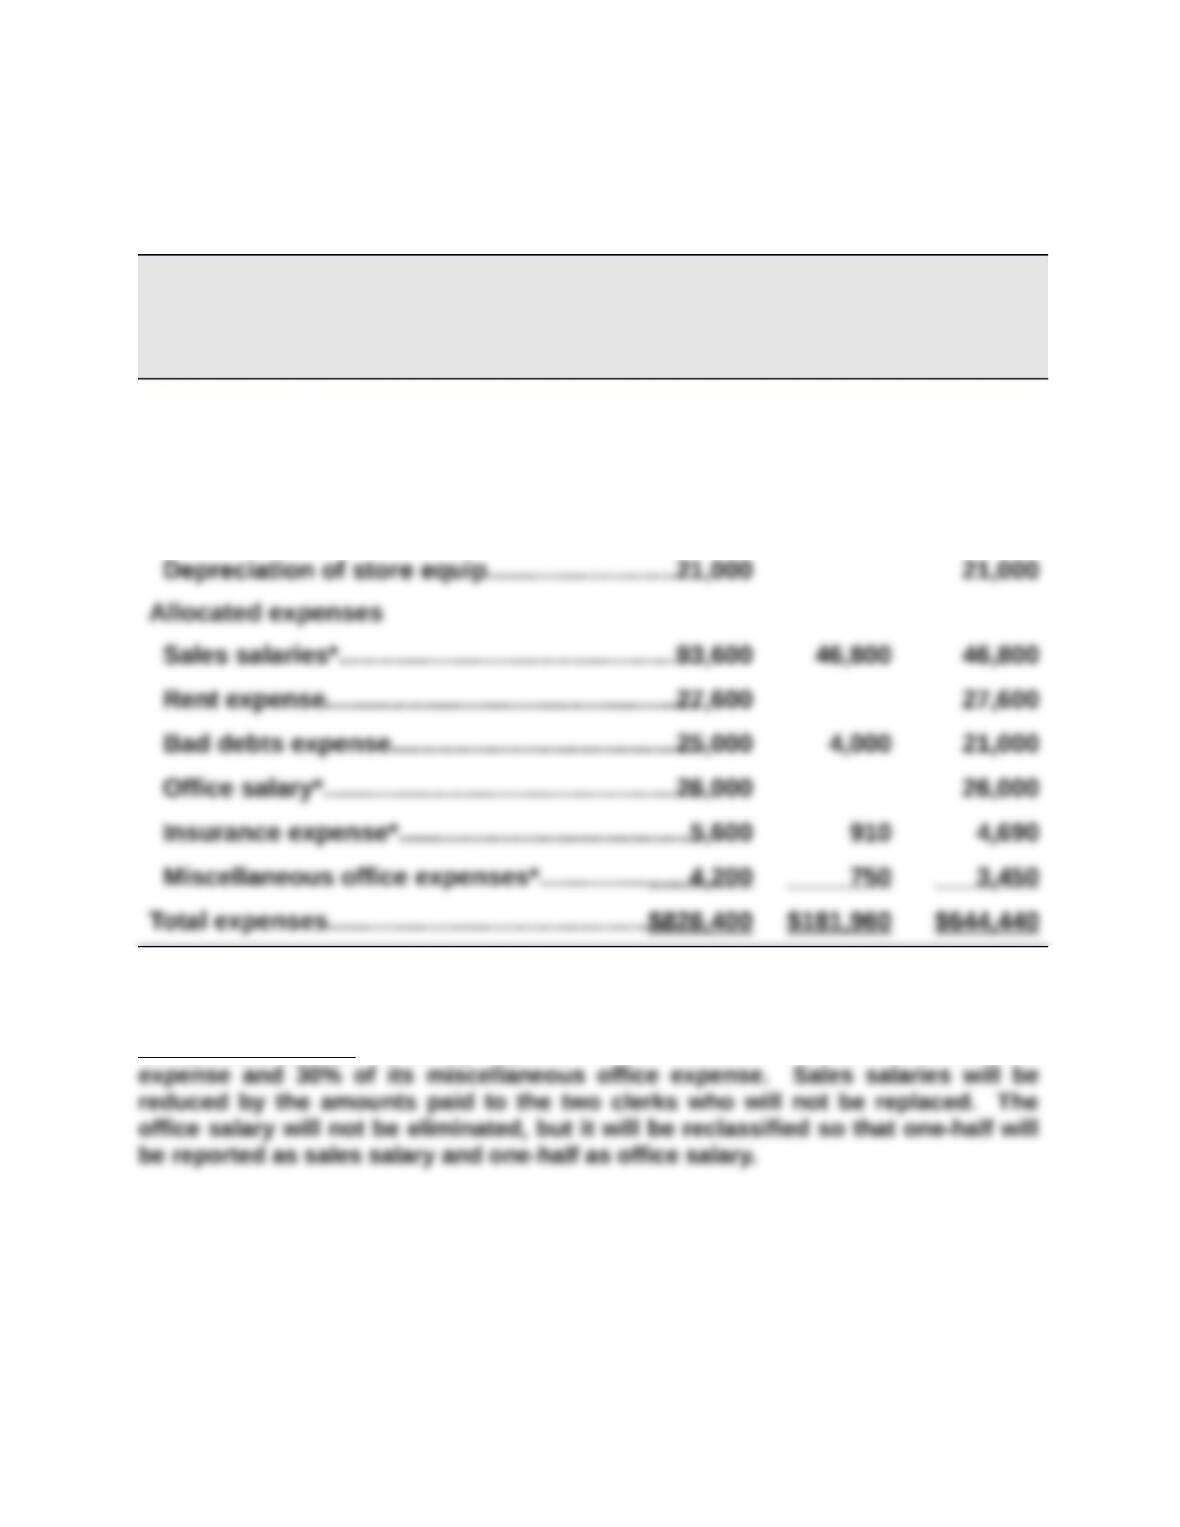
Part 1
ESME COMPANY
Analysis of Expenses under Elimination of Department Z
Total Eliminated Continuing
Expenses Expenses Expenses
Cost of goods sold……………………………………….$586,400 $125,100 $461,300
Direct expenses
Advertising………………………………………………..30,000 3,000 27,000
Store supplies used……………………………………7,000 1,400 5,600
Computation Notes Closing Department Z will eliminate 65% of its insurance
Problem 25-6B (Continued)
Part 2
ESME COMPANY
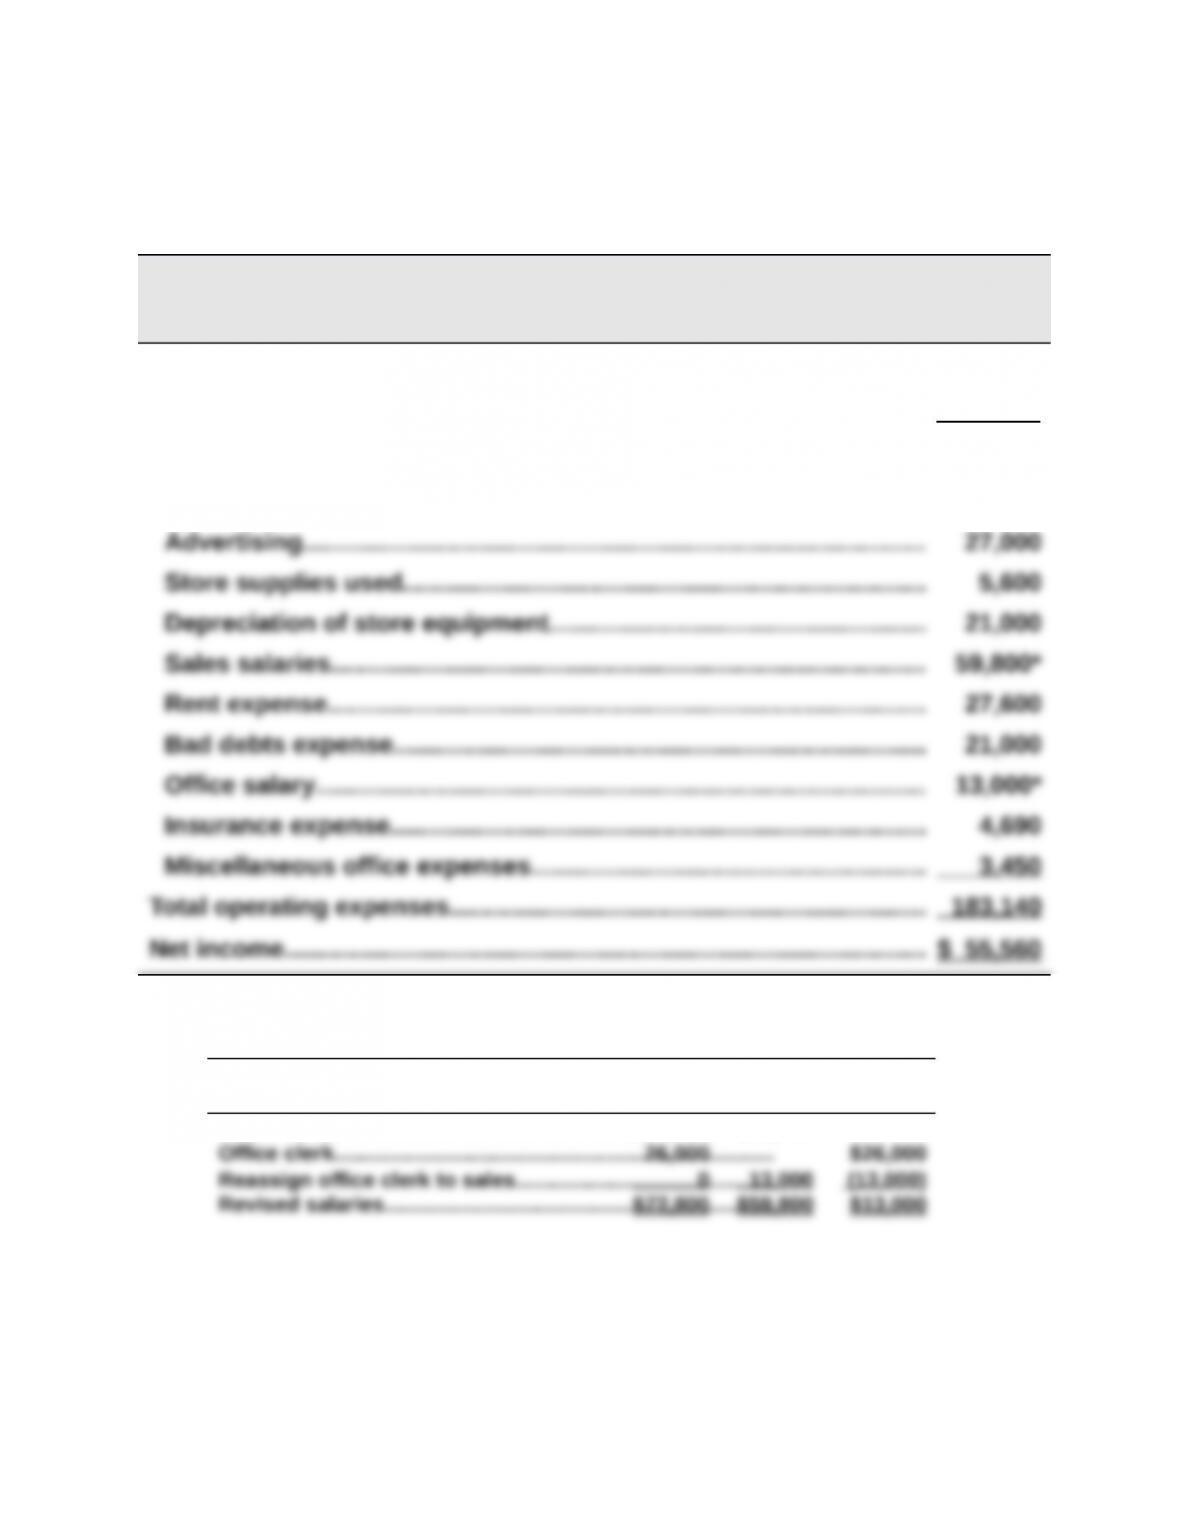
Forecasted Annual Income Statement
Under Plan to Eliminate Department Z
Sales………………………………………………………………………………………. $700,000
Cost of goods sold………………………………………………………………….. 461,300
Gross profit from sales……………………………………………………………. 238,700
Operating expenses
* Office salary reassignment
Total Sales Office
Salaries Salaries Salary
Sales clerks………………………………………………………………..$46,800 $46,800
Problem 25-6B (Continued)
Part 3
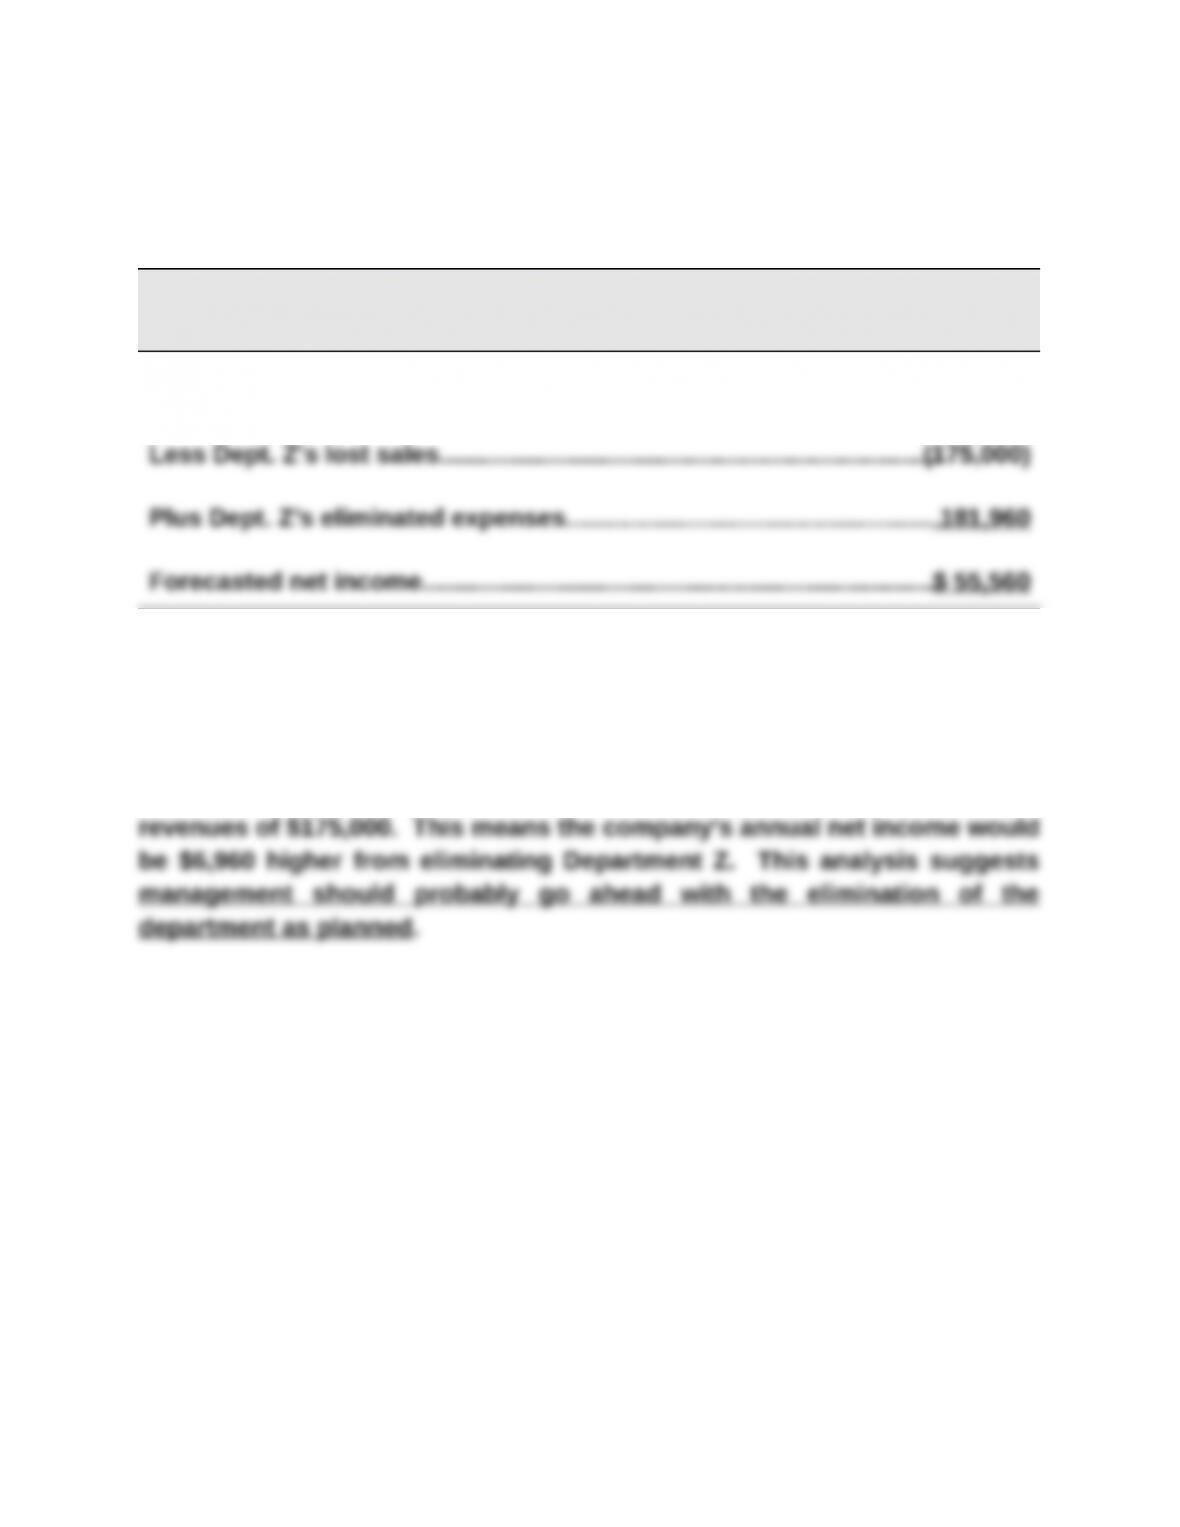
ESME COMPANY
Reconciliation of Combined Income with Forecasted Income
Combined net income ……………………………………………………………….$ 48,600
ANALYSIS
Department Z’s avoidable expenses of $181,960 are $6,960 greater than its