Problem 25-5A (Continued)
Part 3
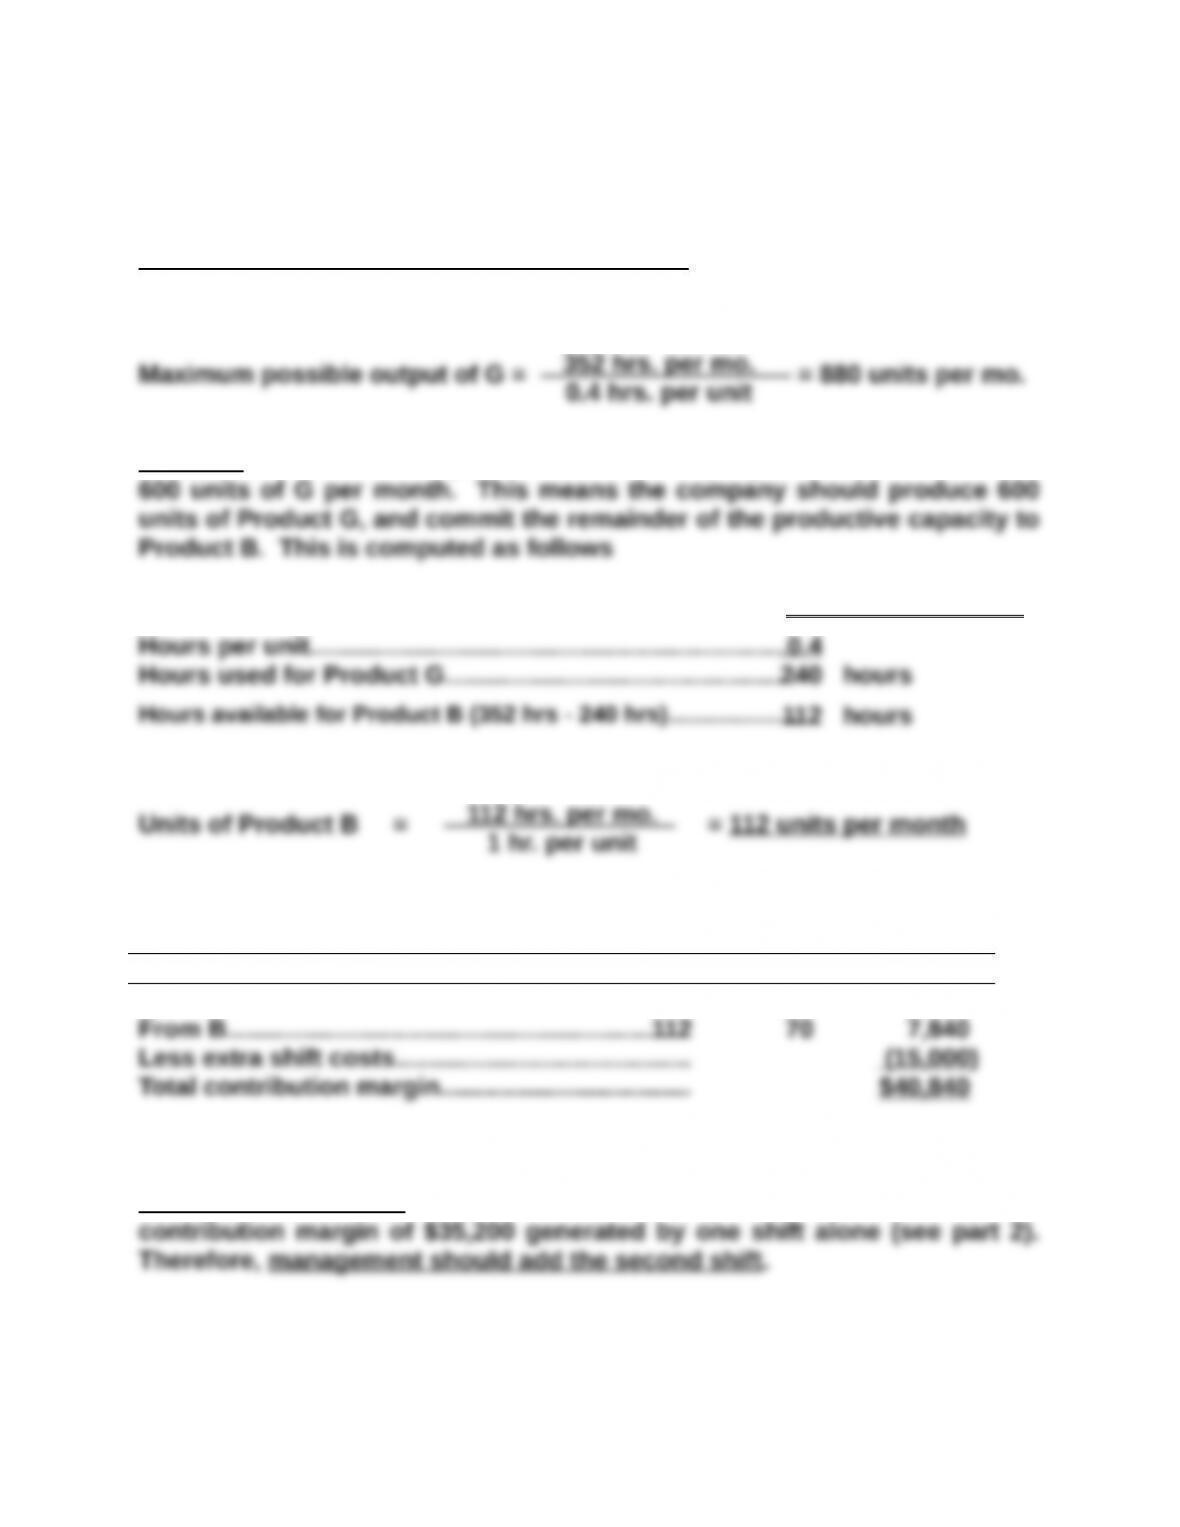
Sales Mix Recommendation with Second Shift. If the second shift is added,
the maximum possible output of G will double
However, this level of output exceeds the company’s market constraint of
Units of Product G…………………………………………………….= 600 units per month
The output of Product B with 112 production hours is
Contribution Margin at This Sales Mix
Units Contr./unit Total
From G………………………………………………………..600 $80 $48,000
Management decision. The contribution margin of $40,840 exceeds the
contribution margin of $35,200 generated by one shift alone (see part 2).
Therefore, management should add the second shift.
352 hrs. per mo.
0.4 hrs. per unit
112 hrs. per mo.
1 hr. per unit
Problem 25-5A (Continued)
Part 4
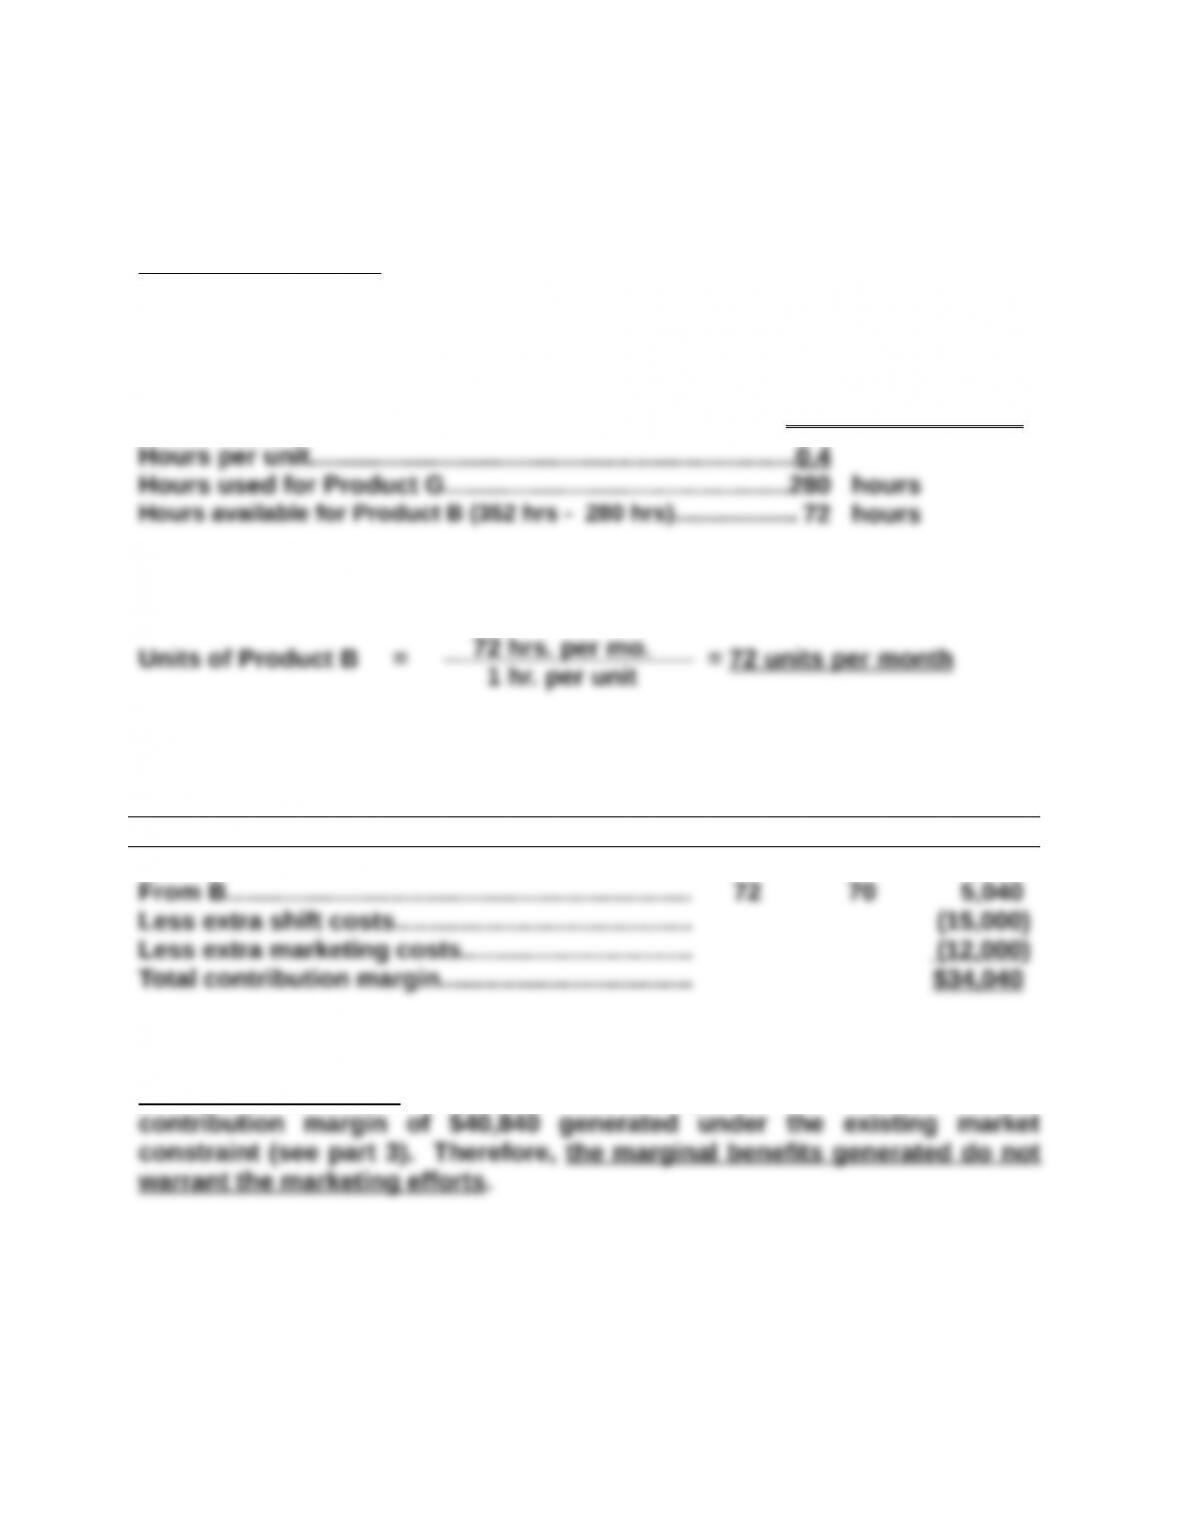
Sales Mix Recommendation. By incurring additional marketing cost, the company can relax the market
constraint for sales of Product G up to the point where 700 units can be sold. This means the company
can produce 700 units of Product G, and commit the remainder of its productive capacity, if any, to
Product B. These computations are
Units of Product G…………………………………………………….= 700 units per month
The output of Product B with 72 production hours is
Contribution Margin at This Sales Mix
Units Contr./unit Total
From G……………………………………………………….. 700 $80 $56,000
Management decision. This contribution margin of $34,040 is less than the
contribution margin of $40,840 generated under the existing market
constraint (see part 3). Therefore, the marginal benefits generated do not
warrant the marketing efforts.
72 hrs. per mo.
1 hr. per unit
Problem 25-6A (60 minutes)
Part 1
ELEGANT DECOR COMPANY
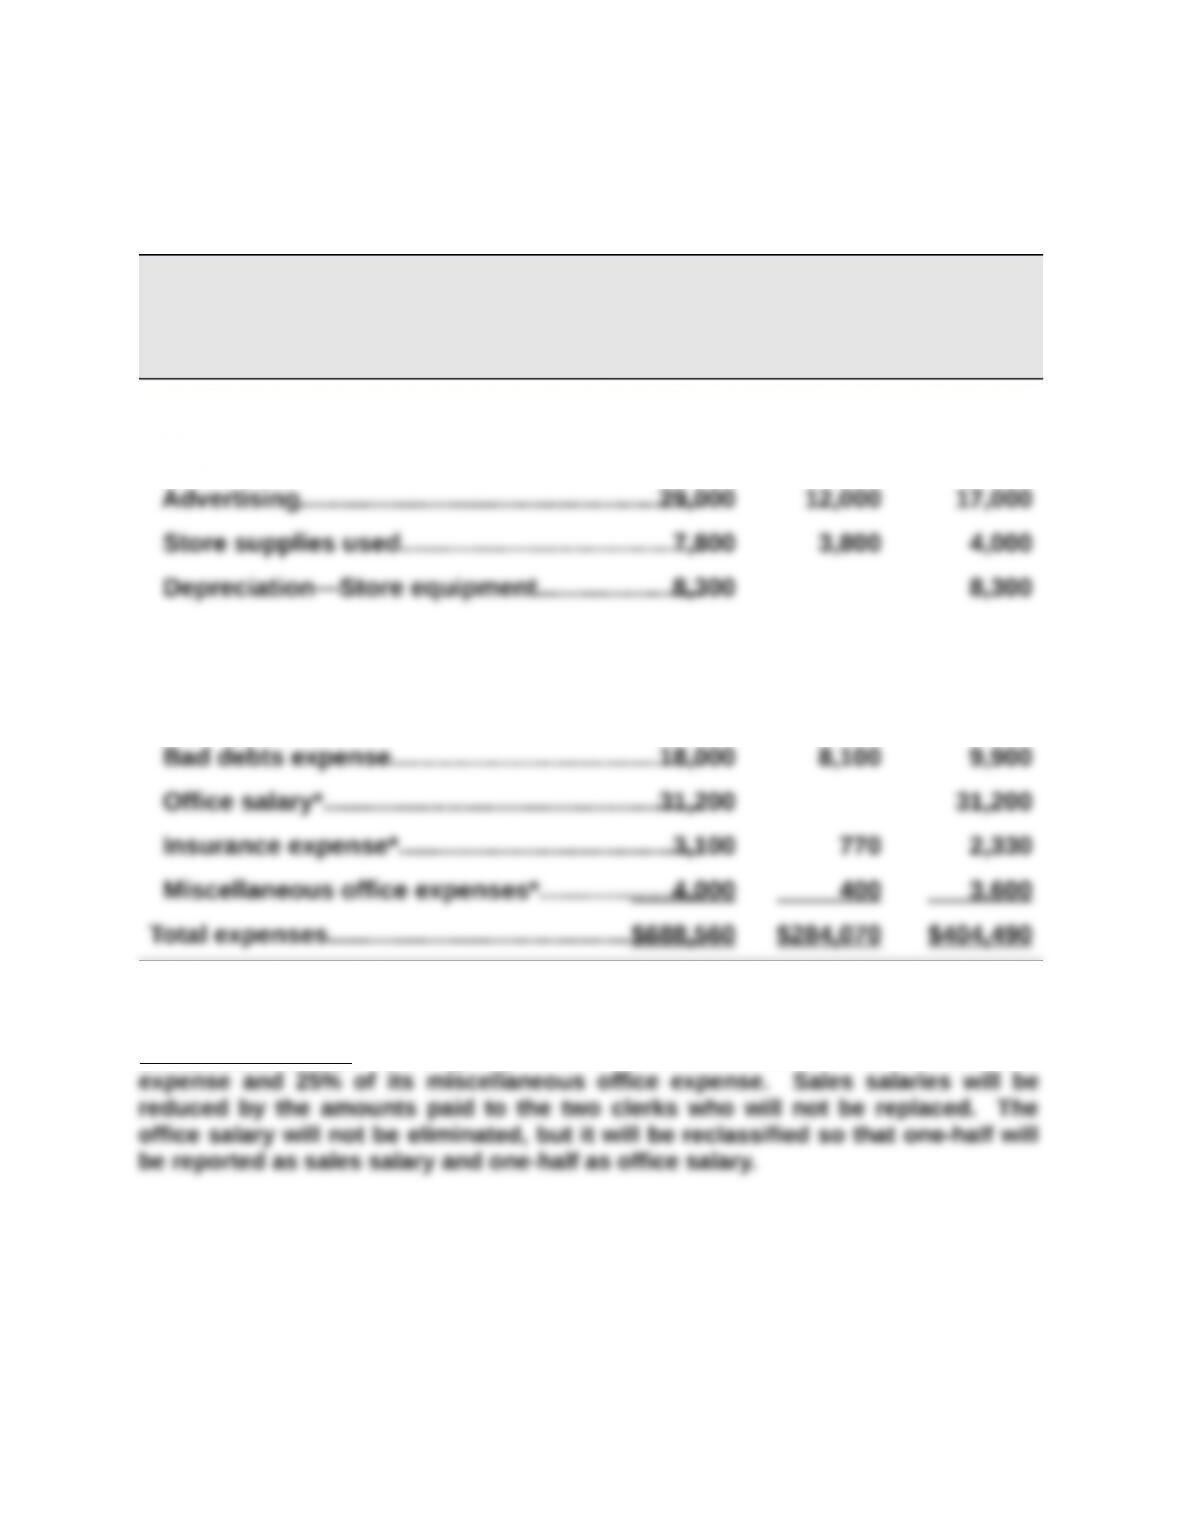
Analysis of Expenses under Elimination of Department 200
Total Eliminated Continuing
Expenses Expenses Expenses
Cost of goods sold……………………………………….$469,000 $207,000 $262,000
Direct expenses
Allocated expenses
Sales salaries*……………………………………………104,000 52,000 52,000
Rent expense……………………………………………..14,160 14,160
*Computation notes. Closing Department 200 will eliminate 70% of its insurance
Problem 25-6A (Continued)
Part 2
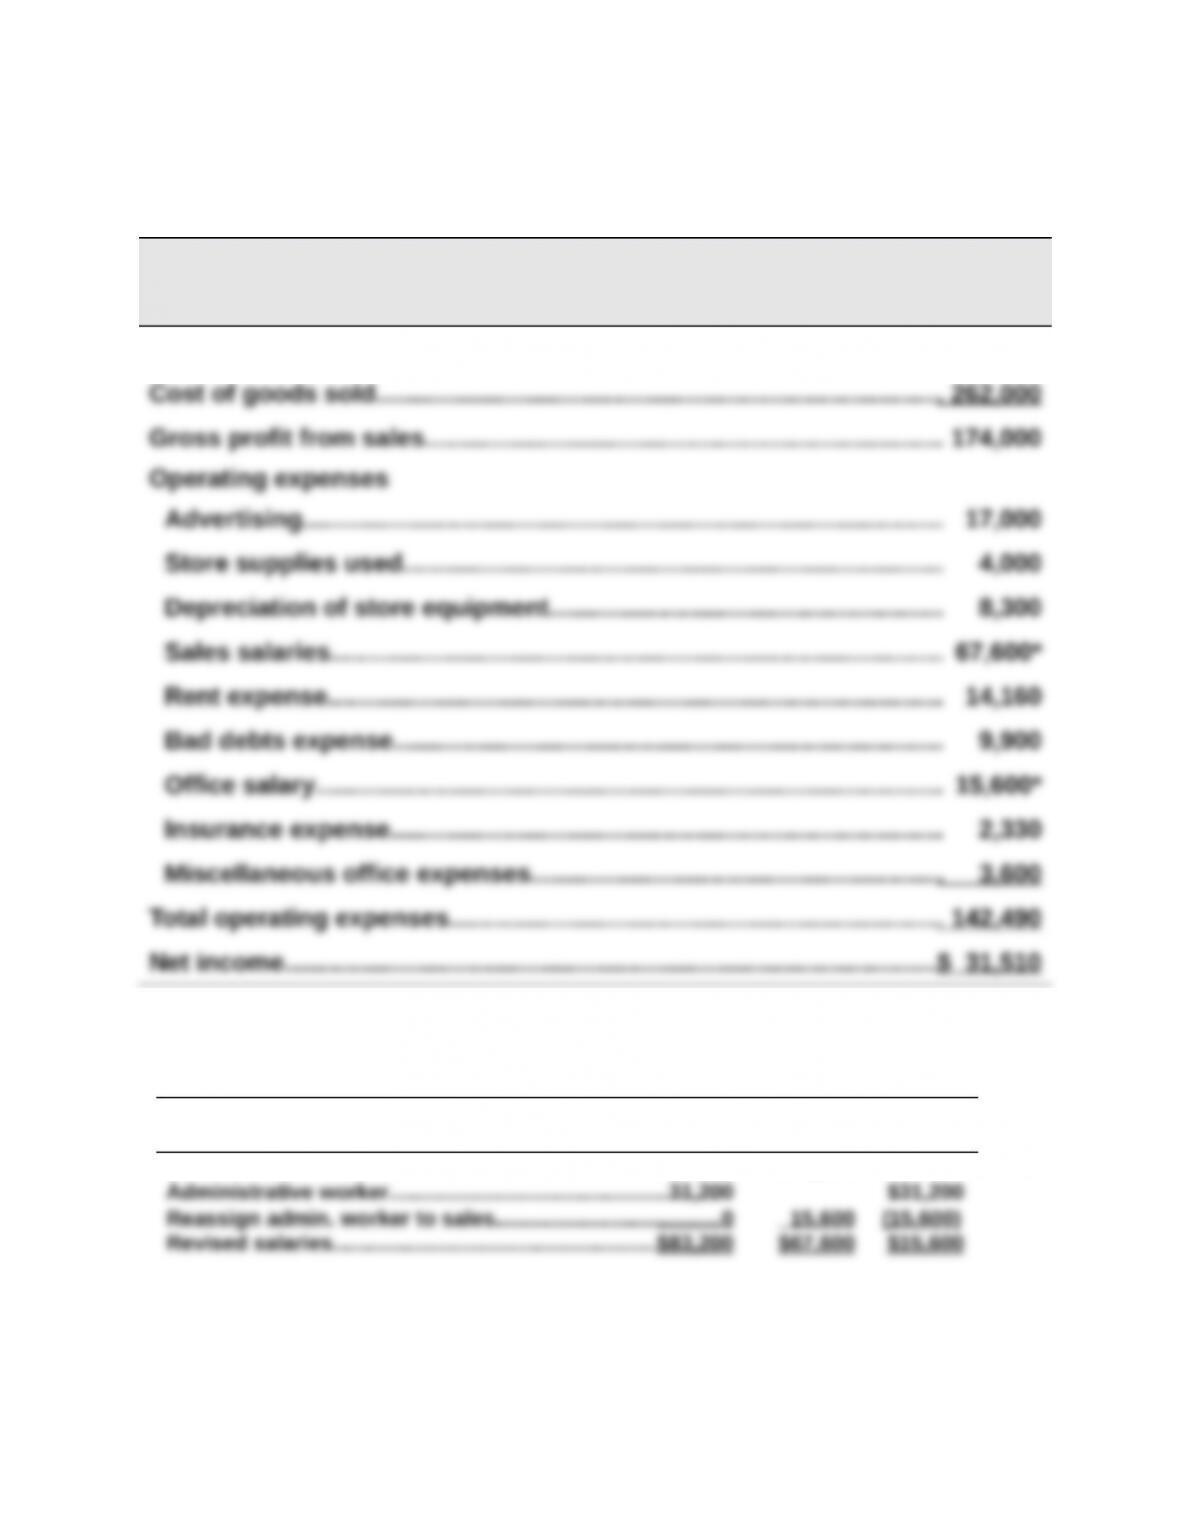
ELEGANT DECOR COMPANY
Forecasted Annual Income Statement
Under Plan to Eliminate Department 200
Sales…………………………………………………………………………………………$436,000
* Administrative salary reassignment
Total Sales Office
Salaries Salaries Salary
Salesclerks…………………………………………………………………$52,000 $52,000
Problem 25-6A (Continued)
Part 3
ELEGANT DECOR COMPANY
Reconciliation of Combined Income With Forecasted Income
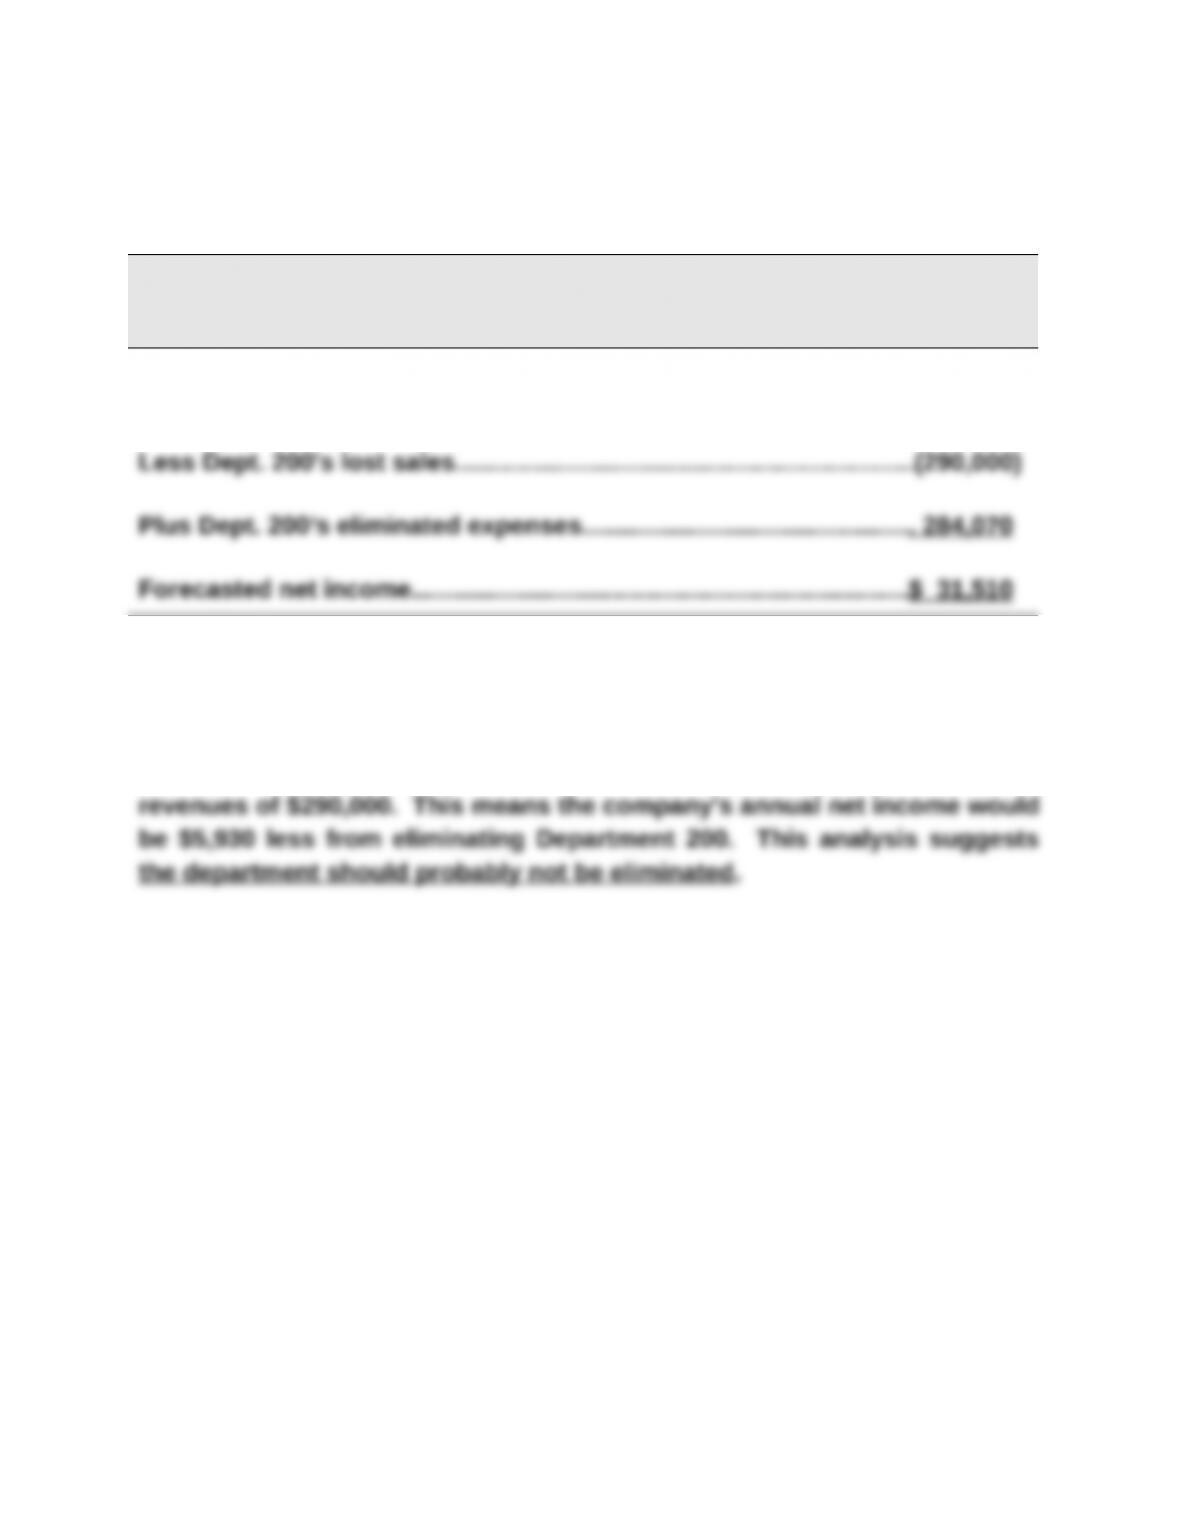
Combined net income ……………………………………………………………..$ 37,440
ANALYSIS
Department 200’s avoidable expenses of $284,070 are $5,930 less than its
PROBLEM SET B
Problem 25-1B (50 minutes)
Part 1
Part 2
Net Net Cash
Income Flow
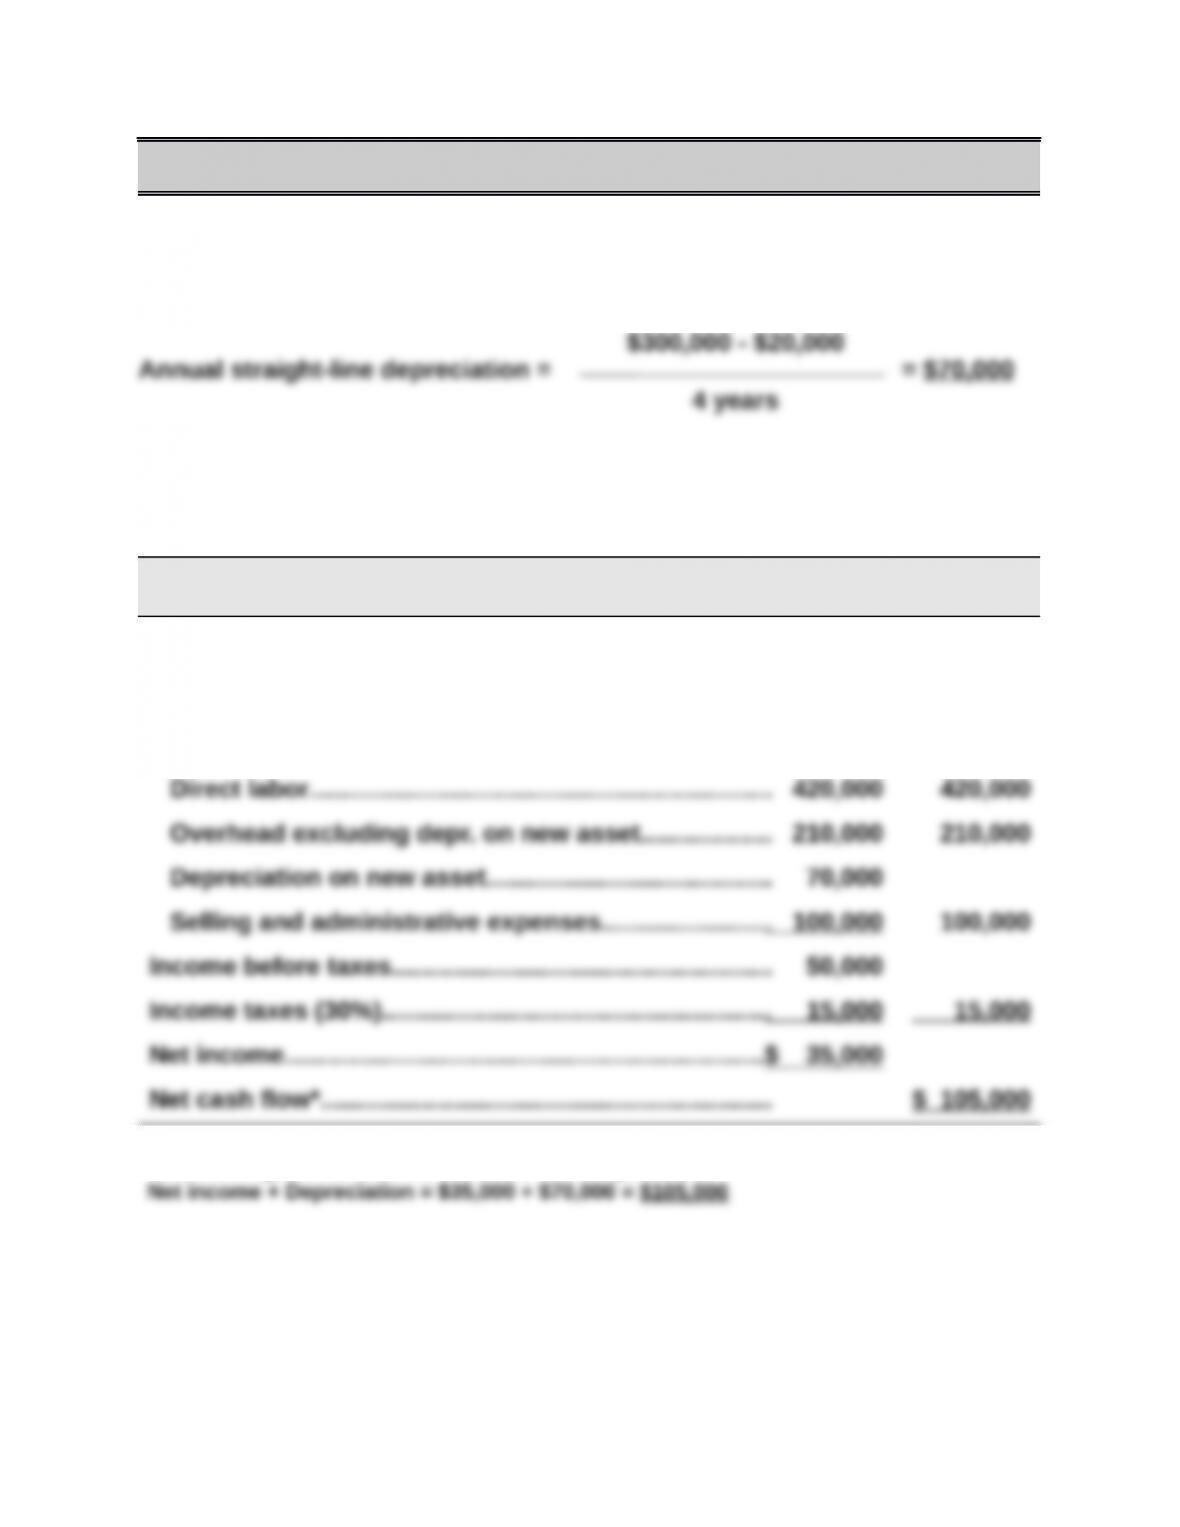
Expected annual sales of new product…………………..$1,150,000 $1,150,000
Expected annual costs of new product
Direct materials…………………………………………………. 300,000 300,000
*Alternatively, annual net cash flow can be computed as:
Net income + Depreciation = $35,000 + $70,000 = $105,000
$300,000 – $20,000
4 years
Problem 25-1B (Continued)
Part 3
Part 4
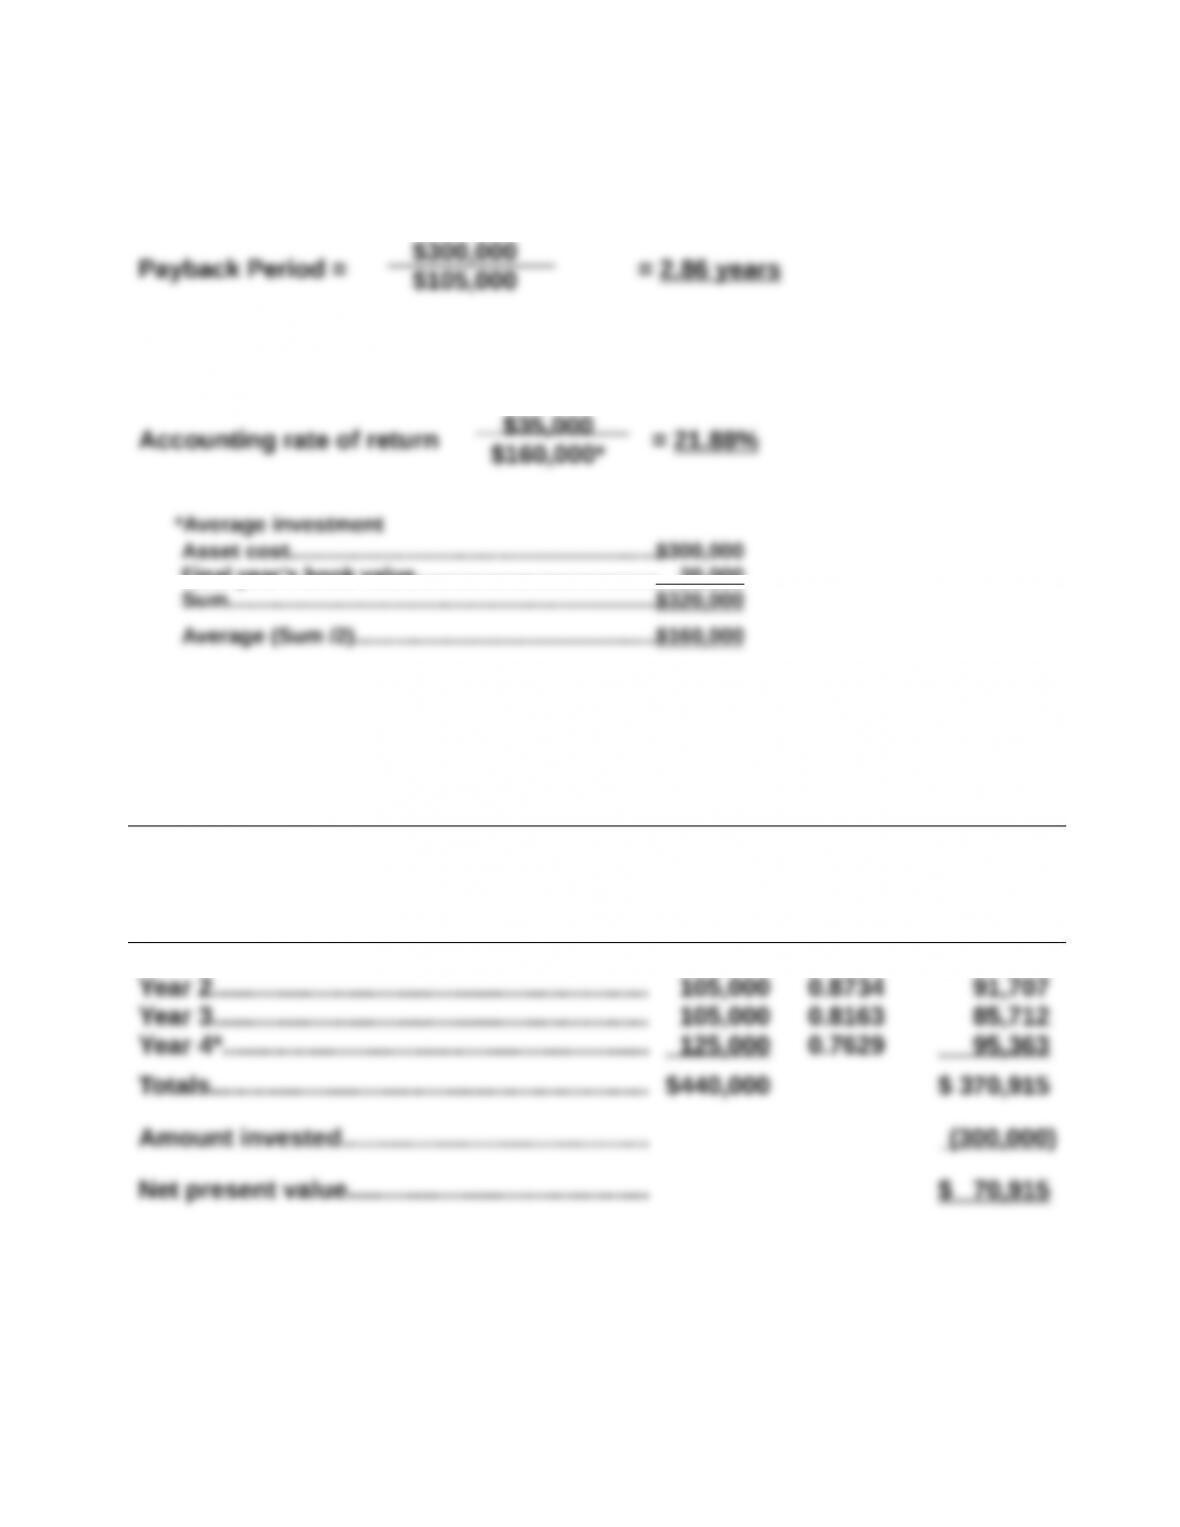
*Average investment
Final year’s book value…………………………………… 20,000
Part 5
Present Value of Net Cash Flows
Present
Present Value of
Net Cash
Flows
Value of
1 at 7%
Net Cash
Flows
Year 1……………………………………………………. $105,000 0.9346 $ 98,133
* Year 4’s cash flow includes the $20,000 salvage value.
$35,000
$160,000*
$300,000
$105,000
Problem 25-2B (55 minutes)
Part 1
PROJECT A
PROJECT B
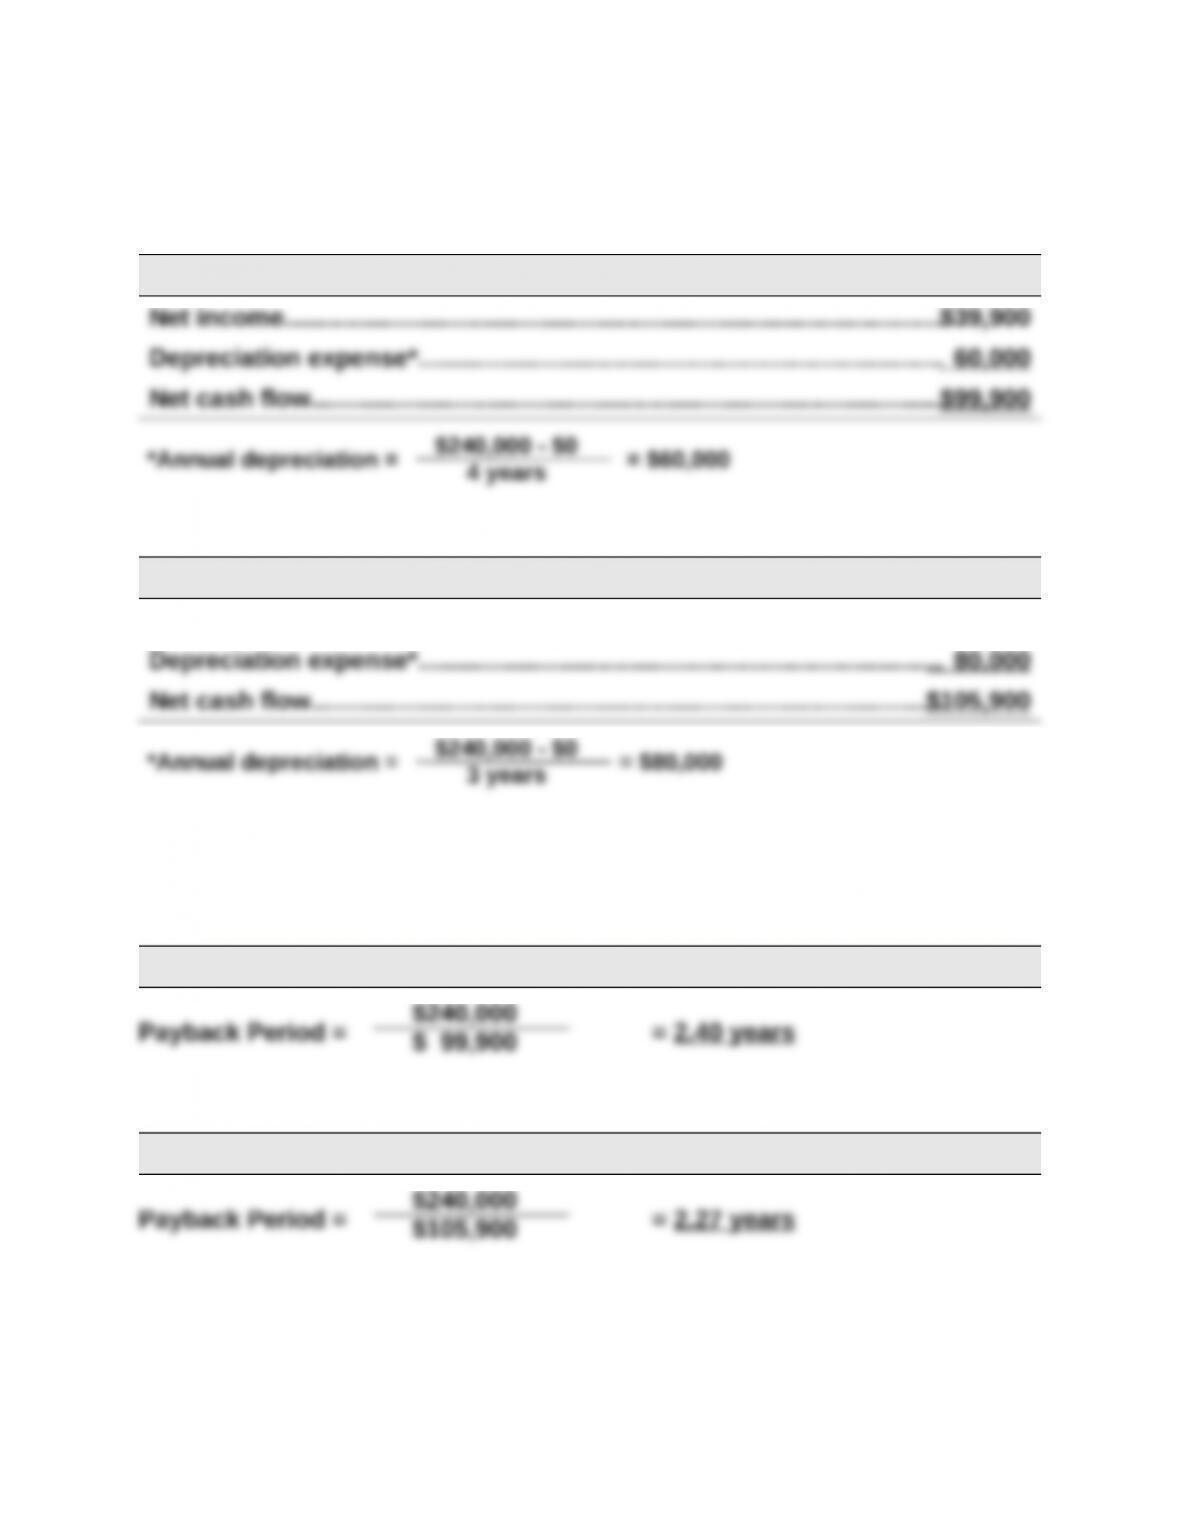
Net income………………………………………………………………………………..$ 25,900
Part 2
PROJECT A
PROJECT B
4 years
3 years
$240,000
$ 99,900
$240,000
Problem 25-2B (Continued)
Part 3
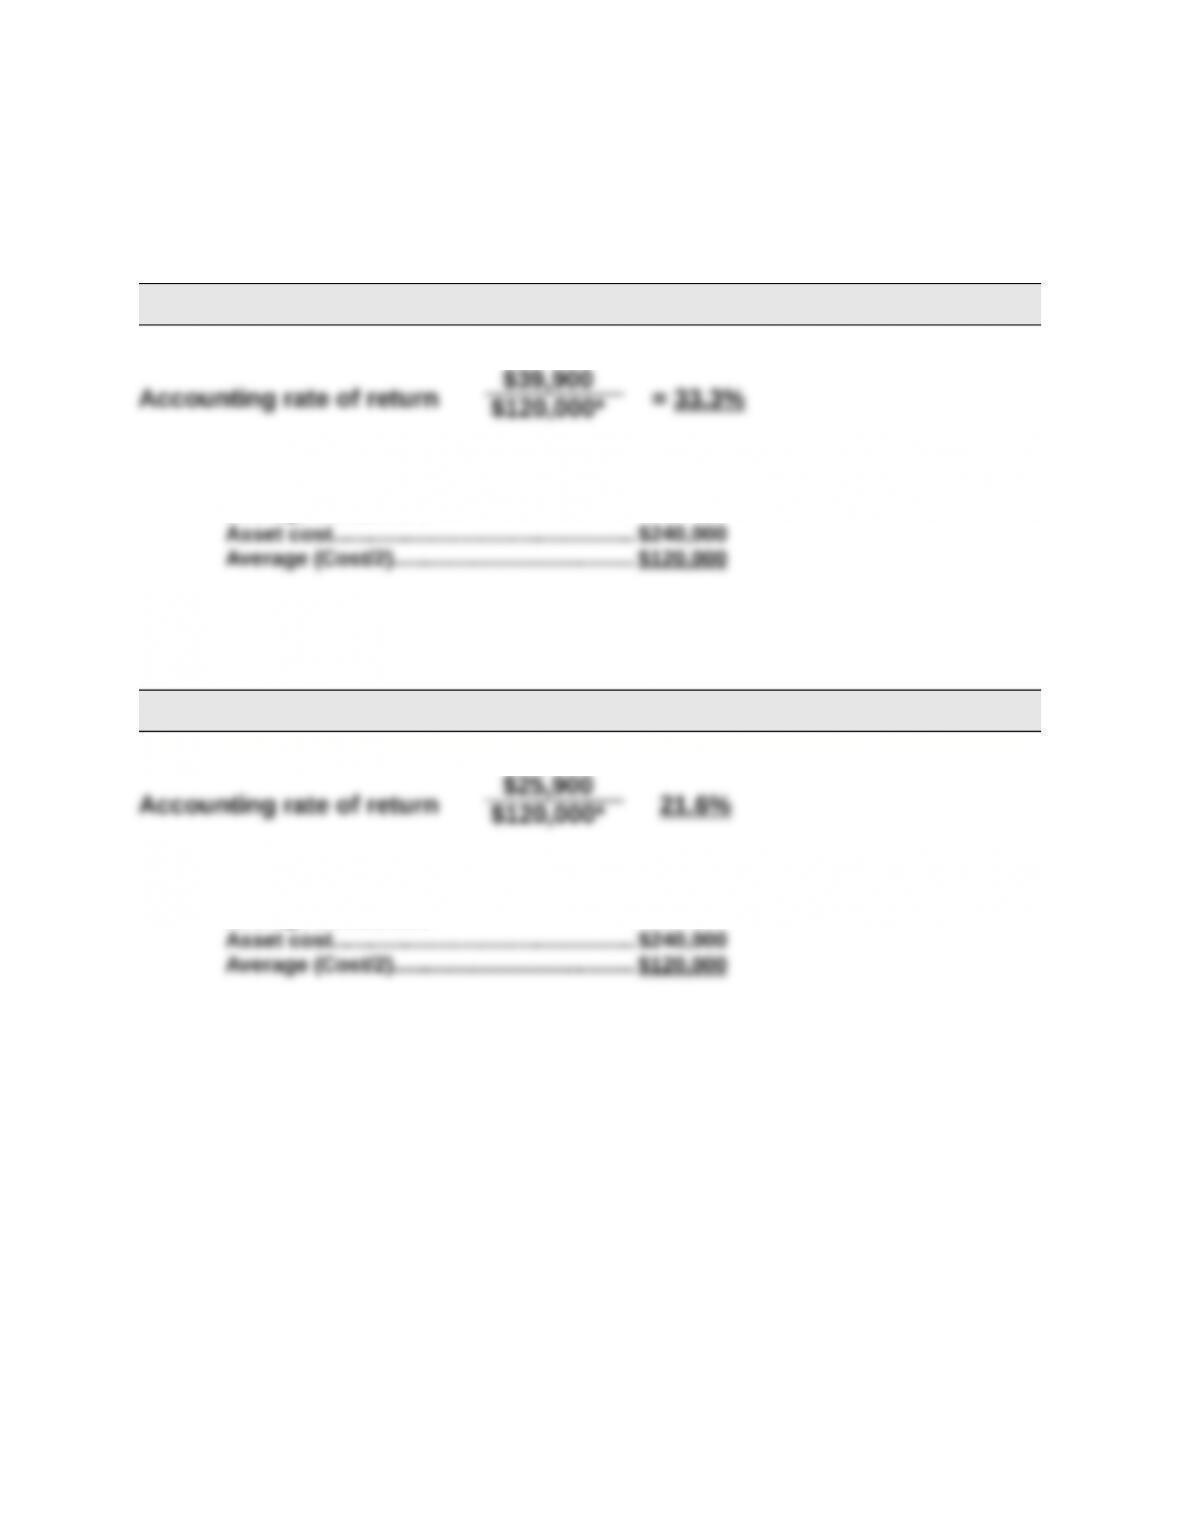
PROJECT A
*Average investment
PROJECT B
*Average investment
Asset cost……………………………………………. $240,000
Average (Cost/2)………………………………….. $120,000
$39,900
$120,000*
$25,900
$120,000*